

Abstract
Telomere-led rapid chromosome movements (RPMs) are a conserved characteristic of chromosome dynamics in meiosis. RPMs have been suggested to influence critical meiotic functions such as DNA repair and the association of the homologous chromosomes. Here, we describe a method using 3D time-lapse fluorescence imaging to monitor RPMs in Hoechst-stained mouse seminiferous tubules explants. We supplement visualization with customized quantitative motion analysis and in silico simulation. The ability to carry out live imaging, combined with quantitative image analysis, offers a sensitive tool to investigate the regulation of RPMs, chromosome reorganizations that precede dynamic mid-prophase events, and their contribution to faithful transmission of genetic information.
Keywords: mouse gametogenesis, spermatocyte, chromosome dynamics, microscopy, telomere-led rapid prophase movements
1. Introduction
Visualization and quantification of RPMs in mice has allowed new discoveries on the machinery generating RPMs(1, 2), measuring the effect of fundamental meiotic processes in RPMs, and further understand how RPM influence dynamic complex chromosome interactions in mammals. RPMs are conserved among species and share similar structural and functional characteristics and it is suggested to promote chromosome associations, reducing heterologous interactions, and resolving chromosome interlocks (reviewed in(3, 4)). Thus, RPMs participate in critical meiotic events required for normal progression of gametogenesis.
Since the initial identification of prophase chromosome movements in rat and Chinese hamster spermatocytes(5, 6), experiments in mammals have been focused in the mouse model. The approach we describe in this article proved to have the sensitivity to changes provoked by deletion in components of the machinery generating RPMs, to changes in RPM characteristics during meiotic progression, and differences in RPMs caused by defects in recombination and homologous chromosome synapsis(1).
2. Materials
2.1. Retrieving testis and preparing seminiferous tubule explants for visualization.
Male mouse, 6-8 weeks old.
Scissors and fine tip forceps.
Micropipettes and tips 1-10 μL, 20-200 μL and 100-1000 μL.
1.5 ml microtubes.
DMEM (+ 4.5 g/L D-Glucose, + L-glutamine, + 25 mM HEPES, - Phenol Red; Gibco, cat. # 21063-029). Store at 4 °C.
MEM-α (+ L-glutamine, + Ribonucleosides, + Deoxyribonucleosides, - Phenol Red; Gibco, cat. # 41061-029). Store at 4 °C.
Albumax™ I (Gibco, cat. # 11020-021).
Hoechst 33342 dye in DMSO (5 mg/ml).
Dry bath at 32 °C.
2.2. Microscopy
50 mm tissue culture dish with 40 mm cover glass bottom (FluoroDish™; cat. # FD5040-100).
Ibidi Sticky-Slide I0.2 Luer (cat. # 80168).
Ibid Perfusion set WHITE (cat. #10963).
Ibidi Clamp for sticky-Slides with adaptor for sitcky-Slide I Luer (cat. # 80040).
Cover Slips 22 x 22 mm.
Cover Slips 24 x 60 mm No.1 thickness.
Biobond Tissue Adhesive (Electron Microscopy Sciences; cat. # 71304).
Glass beads 150-212 microns Acid-washed (Sigma; cat. # G1145).
VALAP
2.3. Equipment
Zeiss Axio Observer upright fluorescence microscope.
Zeiss Plan-APOCHROMAT 63x/1.4 Oil DIC objective.
Colibri 7 light source (Zeiss).
ORCA-Fusion digital camera C14440 (Hamamatsu).
WSB ZPiezo CAN.
Ibidi Air Pressure Pump 2 with one fluidic unit (Ibidi®).
Notebook with pump control software (Ibidi®).
Zen 3.2 Blue software.
3. Methods
These procedures are based on those previously developed and described by Lee et at.(1) Before starting, set temperature of solutions in a water bath at 32 °C.
3.1. Retrieval of testes and seminiferous tubules
Euthanize one male mice, aged about 6-8 weeks, in a CO2 chamber and confirm dead by cervical dislocation.
Lay each animal on its back; sterilize the ventral surface with a 70 % ethanol solution. Remove testes from the mouse abdomen with tweezers and a pair of scissors and place the pair of testes in a 35 mm Petri dish with PBS 1X at room temperature.
Holding the fat pad with tweezers, rinse each testis twice in PBS 1X at room temperature.
To obtain seminiferous tubules, hold testis from one end with a fine-tipped tweezers and make an incision in albuginea tunic with the tip of a second forceps. Pull apart the tunic albuginea by gently grasping it with two pairs of tweezers.
2. Seminiferous tubule handling and assembling for imaging
Here we describe two alternative methods for imaging seminiferous tubules, experiments are performed either in rounded glass dishes (A) or using ibidi microfluidic slides (B). Although both have shown to be proficient for measuring speed and characteristics of RPMs, the use of the Ibidi system allows keeping seminiferous tubules alive for longer time periods and consequently extended times of visualization are possible. For both methods, nuclei spermatocyte staining with Hoechst allows visualization of centromeric heterochromatin. In each nucleus, Hoechst stained “blobs” represent one or several chromosomal centromeres. It is important to emphasize that Hoechst 33342 staining of heterochromatin centromeric spots is pericentromeric and in the mouse, represents half of the chromosome ends in the nucleus.
During the ~10 days those spermatocytes spend in pachytene, they move away from the seminiferous tubule wall to a location deep inside the tubule where spherical aberrations prohibit clear imaging using wide-field, high numerical aperture optics. Thus, the meiotic prophase stages after pachytene-diplotene are not analyzed with these methods.
4-6 seminiferous tubule bundles (approximately ¾ of a testis) are transferred into Eppendorf tubes containing 1 ml MEM-20% Albumax with added Hoechst 33342 chromatin dye (0.05 mg/ml). After 30 min incubation at 32 °C (no shaking), the tubule bundles are rinsed twice by transferring them to Eppendorf tubes containing 1 ml MEM-Albumax (no Hoechst) and stored in this media at 32 °C until analysis (not exceeding 1 h).
For experiments performed in rounded glass bottom dish (short-term movies (10-30 min)), 10-20 seminiferous tubules (approximately 1mm length each) were placed between a glass bottom dish (cat. # HBSt-5030, Willco Wells) and coverslip separated by glass beads (150-212 microns) in DMEM and sealed with VALAP (Fig. 1A).
Figure 1.
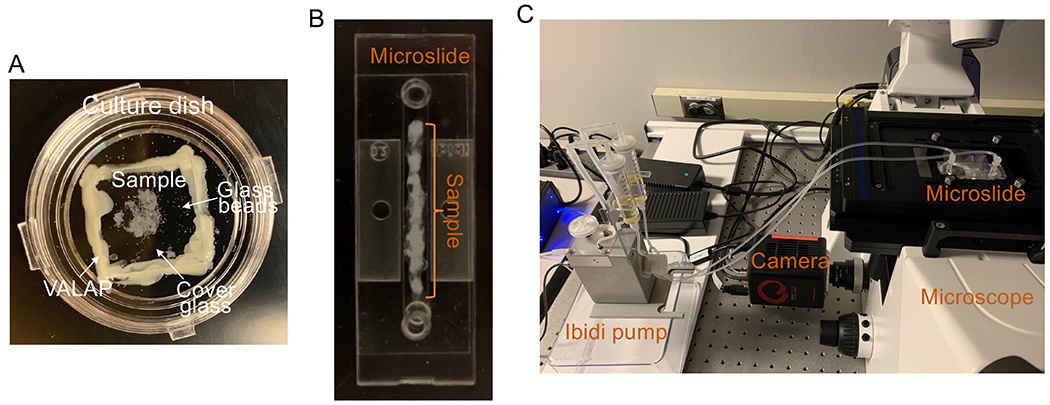
Images show sample preparation and mounting before visualization. A. Use of culture dish for short term RPM measurements. B. sample preparation in a Ibidi microfluidics chamber. C. Ibidi microfluidic system and inverted epifluorescent microscope used to visualize RPMs in long term movies.
Experiment using Ibidi microfluidic slide long-term movies (30 min - 10 hours):
Prior to sample mounting we assemble the fluid unit and add 6 ml of MEM-α plus Albumax I in each reservoir holder. To eliminate bubbles in the system it is necessary to leave the pump working for at least 5 minutes without any slide applying 50 mbar pressure.
When the pump is ready, mount seminiferous tubule bundles along the channel of the sticky-Slide I0.2 Luer chamber (50 μm high) with sufficient media to avoid tubule dehydration and remove the protection film (Fig. 1B). Seal the chamber with a sterile glass coverslip (pretreated with biobond) and press firmly until the bottom is completely sealed. For better results use the Ibidi Clamp for sticky-Slides with the adaptor for sitcky-Slide I Luer.
Before connecting the microslide, make sure that the Ibidi pump (Fig. 1C) is turn off and use the hose clip provided with the fluid unit to block the liquid inside the tube.
Carefully attach the slide to the tubes in both sides and release the clip. In the pump control software change from without to slide-to-Slide I0.2 Luer chamber and apply a pressure of 5 mbar.
3. Acquisition of movies
Mounted samples were placed in the microscope stage holder (Fig. 1C).
3-D time course movies (stack images, 16 slices with 1 μm steps) (Fig. 2) were acquired every 10 sec for a total of 10 minutes (short-term movies) or every 1-5 minutes for 1-12 hours (long-term movies).
Figure 2.

Maximum intensity projections of time lapse images of wild type zygotene spermatocytes. Red, blue, green, and yellow dots mark a defined centromere blob revealed by Hoechst 33342. Magnification bar represents 1 μm. The right panel show the traces of spots marked in each time frame.
We use a Zeiss Axio Observer upright fluorescence microscope fitted with a Zeiss Plan-APOCHROMAT 63 x / 1.4 Oil DIC objective, 92 HE DAPI/GFP/mCherry filter, ORCA-Fusion digital camera and Zen 3.2 Blue acquisition software. As a light source we used the Zeiss Colibri light source 7 LED 385 nm at 5%, with 10 ms exposure and 30% shift.
4. Analysis of chromosome movements
To reduce the effects of noise and anisotropic resolution (0.1 μm along the X and Y axes and 1.0 μm along the Z axis), spot positions were smoothed by taking the average of the positions in a moving window over every three time-points.
Before starting the quantification process save the file as .zvi in a separate folder, allowing RAW files to be saved in the selected location.
Open OMRFQANT(7) color movie and zvi software and open the Axiovision file (.zvi).
In the 20110420OMRFQANT software go to: File_Open_choose all files (.raw). Check if the order is correct and press OK.
Select open as plate of thumbnails, by time point: X4000 Y3000; get/set image stacks settings: 1024x1024x16 and press OK. Save with the same name as the avi file.
Click uncrop, adjust window using loX hiX and loY hiY and use scroll to navigate.
Open file in the Zen software to guide you to choose the cells. Back to OMRFQANT in the “make or edit” 3DPlate window (in the left) select “enable controls to make and score in 4D excerpts” and ON (use only for .pi8 with original data as time point) (Fig. 3A).
Select the cell of interest using CTRL and the left button (drag down diagonally) and click save excerpt: X=0.103; Y=0.103; Z=1; T= time elapsed between stacks in seconds.
Click Auto and OK and save with the same name cell 1, 2, 3 etc.
To analyze the spots, open one cell, hit uncrop, equalize and adjust bright/contrast in window/level.
Go to tool_score in 4D and set save file (save as same name cell1 score) and mark spots with CTRL+left button, scrolling up and down with mouse wheel (Fig. 3B).
Click add to file, follow other spots, add to file again. When finished click view animation, Splines, save images: single tiff (Fig. 3C).
To analyze speed, go to Tool_XYZT analysis and the Time analysis in 4D window will open (Fig. 3D). Open the score file and choose NO to the question in the pop-up. Set output file (same name score analysis) and click Fit to sphere followed by One spot analysis. The results will be saved as .txt (Fig. 3E).
Figure 3.

Analysis of chromosomes movements using the software OMRFQANT. A. Example of an image opened with OMRFQANT. B. Single cell scoring. C. Splines animation of four spots (red, blue, green and yellow) scored in one cell. D. Time-lapse analysis window. E. Example of the final results obtained as a text file.
Acknowledgment
We thank Mike Dresser, a pioneer in RPMs studies, for his constant support.
This work was supported by R01-NIGMS R01 GM125803 and R21-NICHD R21 HD103562 to RP.
4. Notes
It is important to note that the relative positions of the spots at each time-point remain unchanged using either approach.
It is important to have a calibrated objective. The pixel distances can vary.
The speed results are given in μM/second.
References
- 1.Lee CY et al. , Mechanism and regulation of rapid telomere prophase movements in mouse meiotic chromosomes. Cell Rep 11, 551–563 (2015). [DOI] [PMC free article] [PubMed] [Google Scholar]
- 2.Morimoto A et al. , A conserved KASH domain protein associates with telomeres, SUN1, and dynactin during mammalian meiosis. J Cell Biol 198, 165–172 (2012). [DOI] [PMC free article] [PubMed] [Google Scholar]
- 3.Link J, Jantsch V, Meiotic chromosomes in motion: a perspective from Mus musculus and Caenorhabditis elegans. Chromosoma 128, 317–330 (2019). [DOI] [PMC free article] [PubMed] [Google Scholar]
- 4.Alleva B, Smolikove S, Moving and stopping: Regulation of chromosome movement to promote meiotic chromosome pairing and synapsis. Nucleus 8, 613–624 (2017). [DOI] [PMC free article] [PubMed] [Google Scholar]
- 5.Parvinen M, Soderstrom KO, Chromosome rotation and formation of synapsis. Nature 260, 534–535 (1976). [DOI] [PubMed] [Google Scholar]
- 6.Ellingson DJ, Yao KT, Growth and observations of Chinese hamster seminiferous epithelium in vitro. J Cell Sci 6, 195–205 (1970). [DOI] [PubMed] [Google Scholar]
- 7.Conrad MN et al. , Rapid telomere movement in meiotic prophase is promoted by NDJ1, MPS3, and CSM4 and is modulated by recombination. Cell 133, 1175–1187 (2008). [DOI] [PubMed] [Google Scholar]