

SUMMARY
Glioblastoma (GBM) is defined by heterogenous and resilient cell populations that closely reflect neurodevelopmental cell types. While it is clear that GBM echoes early and immature cell states, identifying the specific developmental programs disrupted in these tumors has been hindered by a lack of high-resolution trajectories of glial and neuronal lineages. Here, we delineate the course of human astrocyte maturation to uncover discrete developmental stages and attributes mirrored by GBM. We generated a transcriptomic and epigenomic map of human astrocyte maturation using cortical organoids maintained in culture for nearly two years. Through this approach, we chronicled a multi-phase developmental process. Our time course of human astrocyte maturation includes a molecularly distinct intermediate period that serves as a lineage commitment checkpoint upstream of mature quiescence. This intermediate stage acts as a site of developmental deviation separating IDH-wildtype neoplastic astrocyte lineage cells from quiescent astrocyte populations. Interestingly, IDH1-mutant tumor astrocyte lineage cells are the exception to this developmental perturbation, where immature properties are suppressed as a result of D2HG oncometabolite exposure. We propose that this defiance is a consequence of IDH1mt-associated epigenetic dysregulation and we identified biased DNA hydroxymethylation (5hmC) in maturation genes as a possible mechanism. Together, this study illustrates a distinct cellular state aberration in GBM astrocyte lineage cells and presents developmental targets for experimental and therapeutic exploration.
INTRODUCTION
The hijacking of early cell development programs is a common oncogenic feature to promote tumor survival1–3, as evidenced by recent single cell studies4–8. This is apparent in Glioblastoma (GBM), the most severe type of adult glioma, where tumor cells bear a resemblance to three major neurodevelopmental cell types: neural precursor cells (NPC-like), oligodendrocyte precursor cells (OPC-like), and astrocytes (AC-like) 9–16. These cells, along with a fourth mesenchymal cell state (MES-like), exist on a proliferative spectrum, populate patient tumors in varying ratios and demonstrate the capacity to transition into one of the other cell states 12. Together, this cellular heterogeneity and plasticity makes it especially challenging to study and treat GBM. However, while we now have a plethora of transcriptomic datasets characterizing GBM composition and heterogeneity 9–13, 15, we still lack a sufficiently detailed understanding of human CNS lineages to identify how and where GBM cells deviate from normal developmental programs.
Astrocytes are among the most challenging neurodevelopmental trajectories to define because the majority of human astrocyte maturation occurs between late gestational and early postnatal ages 17–20 when access to primary human tissue samples is restricted. Rodent models and a limited number of second trimester fetal tissue samples demonstrate large-scale transcriptional 21–26, morphological 26–30, and functional 17, 27, 30 differences between fetal/embryonic and postnatal astrocytes, suggesting that these cells undergo a profound maturation process during this elusive developmental window. However, far less is known about the molecular dynamics that occur throughout human astrocyte maturation and the TFs and gene sets that promote a quiescent, non-proliferative state during later stages of development.
To overcome this hurdle, we used human cortical organoids (hCOs) to capture a critical longitudinal window of neurodevelopment and create a detailed molecular timeline of astrogenesis spanning nearly two years in culture. This system recapitulates many features of human cortical development 31, 32, including astrocyte maturation, making it a practical and informative approach for studying this time-sensitive process at a high temporal resolution.
Using a combination of RNA-seq and ATAC-seq, we mapped dynamic TF binding and developmental gene programs across normal human astrocyte maturation and investigated how these networks are disrupted in GBM astrocytes. Clarifying the human astrocyte trajectory identified specific regulatory mechanisms that are perturbed in GBM astrocytes and provides additional opportunities for guiding experimental and therapeutic approaches targeting astrocyte maturation.
RESULTS
A molecular map of astrocyte maturation in cortical organoids
To temporally define the molecular changes across normal astrocyte maturation, we formed human cortical organoids (hCOs) from one male and one female hiPSC line using previously established methods 33. We sampled astrocytes across ten timepoints spanning the earliest onset of astrogenesis in hCO cultures (80 days), when astrocytes reflect a proliferative immature signature, through 550 days in culture, a timepoint that we previously demonstrated well-reflected quiescent adult human astrocytes 34 (Fig. 1a). Astrocytes across these developmental stages exhibited evidence of accumulating morphological complexity and retained genetic integrity even through timepoints as late as day 821 in culture (Fig. 1b and Extended Data Figure 1). At each time point, we purified hCO-derived astrocytes using a modified version of a previously established immunopanning protocol 22 and examined the changes of transcription factor binding and gene expression genome-wide, using ATAC- and RNA-seq, respectively (Supplementary Table 1).
Figure 1. A molecular trajectory of human astrocyte maturation.

(a) Schematic of astrocyte maturation collection timepoints. (b) Immunohistochemistry of GFAP in hCOs across three time points- d100, d208, and d345. Scale bar for large images are 100 um. Scale bar for insets: 20um. (c) PCAs of RNA-seq and (d) ATAC-seq across timepoints. (e) WGCNA heatmaps across maturation time points for gene expression (top) and ATAC peaks (bottom). Heatmap values are module Eigengenes. (f) Expression of representative genes from Early, Middle, and Late gene modules. Color corresponds to time point. (g) UMAP of human fetal cortical plate nuclei from Ramos et al 2022 dataset. Glial nuclei used for comparative analysis are colored. (h) Color-coded cell-type clusters used for analysis, including astrocytes, gIPCs, OPCs, and TACs. (i) UMAP depicting age of tissue sample. (j) Feature plots depicting maturation module gene scores. Heatmap of correlation between hCO astrocyte data and pseudobulk (k) age-binned astrocytes and (l) gIPC data from Ramos et al 2022. Glial intermediate progenitor cells (gIPCs), oligodendrocyte precursor cells (OPCs), transit amplifying cells (TACs).
Astrocytes appear to cluster in three groups that we define as “early” (d80-d150), “middle” (d200-d350), and “late” (d400-d550) developmental stages (Fig. 1c and 1d). To delineate the transcriptional and chromatin changes that define these maturation stages we performed both weighted gene co-expression network analysis (WGCNA) and non-negative matrix factorization (NMF). These analyses revealed transcriptional and chromatin accessibility peak sets that uniquely define five modules — “early”, “middle”, and “late”, as well as transitionary “early/middle” and “middle/late” signatures (Fig. 1e and Extended Data Figure 2a-b; Supplementary Tables 2 and 3). Early astrocyte stages (d80 – d250) include transcriptomic signatures associated with a proliferative (MKI67, TOP2A, ID3, NES) cell state and physiological properties such as early response to environmental cues and cell motility (Fig. 1f and Extended Data Figure 2c; Supplementary Table 2). Later maturation phases are distinguished by quiescent mature genes (GJA1, AQP4, ALDH1L1) and those associated with CNS vascular formation, ion homeostasis, astrocyte-mediated synapse organization, and metabolic support (Fig. 1f and Extended Data Figure 2c; Supplementary Table 2). These findings are consistent with a physiological shift from progenitors colonizing the cortex to functionally mature cells that play an integral role in shaping and sustaining the developing brain. Interestingly, the “middle” stage of astrocyte maturation contains an abundance of glial differentiation genes, including those that encode key fate determining transcription factors such as SOX9, OLIG1/2, LHX2, POU3F3 (BRN2), EMX1, and SOX2 (Fig. 1f and Extended Data Figure 2c; Supplementary Table 2). While it is possible that these gene signatures are the result of multiple asynchronous populations, our data suggest that new astrogenesis is limited during mid – late stages (Extended Data Figure 2c).
We next aligned our data to a published human neurodevelopmental atlas that spans all three trimesters (17–39 GW, Fig. 1g) 35. This time course was particularly relevant, since our hCO astrocyte signatures should extend into late third trimester stages. Our hCO-derived astrocyte maturation modules were well-represented in the Ramos et al fetal dataset and aligned closely with increasing gestational age through 39 weeks (Fig. 1h-k and Extended Data Figure 3). Uniquely, the “middle” maturation stage also appears to correlate with the Ramos et al glial intermediate progenitor cell (gIPC) population, a bi- 35, 36, or potentially tri-potent 37, 38 progenitor capable of generating astrocytes, oligodendrocytes, and inhibitory interneurons (Fig. 1l and Extended Data Figure 3d).
Predicting TF drivers of human astrocyte maturation
When paired together, ATAC-seq and RNA-seq datasets are complementary tools for predicting transcription factors (TFs) that drive lineage transitions 23, 39. We utilized PECA2 40, 41, an algorithm to (1) score the potential of all TFs to regulate putative target genes (TGs), (2) assess how these TF-TG regulatory networks change across astrocyte maturation, and (3) identify top TF hits that are most likely to regulate our module target genes (Fig. 2a-f). After binning our maturation samples into “early”, “middle”, and “late” groups, we used PECA2 to compare TF-TG network differences over time and identify candidate TF drivers of astrocyte maturation at each stage (Fig. 2a).
Figure 2. Predicted TF drivers of human astrocyte maturation.

(a) Schematic depicting use of PECA algorithm to predict transcription factor (TF) – target gene (TG) interactions during early, middle, and late stages of astrocyte maturation. (b-e) Example validation of PECA-predicted TF-TG networks. (b, d) Expression of TGs (IL17RD and GFAP) and TFs (OTX2 and NR3C2) across maturation time points. (c, e) ATAC signal in regulatory regions. TF (OTX2 and NR3C2) binding sites are located at thin black line. ATAC signal displayed across early (C4 d80), middle (C4 d200), and late (C4 d450) time points. (f) Approach to filter for TFs that regulate astrocyte maturation. (g) Accessibility (left) and gene expression (right) of candidate drivers of astrocyte maturation. (h) Percent of TGs in each maturation gene module for all candidate TFs. (i, j) IHC assessing co-expression of maturation TF candidates SOX21, OLIG2, and NR3C2 (cyan) with (i) GFAP (magenta) and (j) NFIA (yellow) in hCOs. Scale bars are 50 um. (k - n) Quantification of (l) SOX21, (m) NR3C2, and (n) OLIG2 fluorescence intensity in SOX9+ (l,m) or NFIA+ (n) cells. A two-tailed Wilcoxon signed-rank test was used for these comparisons.**** p < 2.2e-16
We identified 29 candidate TFs (Supplementary Table 4) that demonstrate temporally graded changes in motif enrichment, occurrence (Fig. 2g), and expression (Fig. 2g). Notably, while subsets of these TFs exhibited highly correlated gene expression and motif accessibility, the ATAC- and RNA-seq measurements did not always change congruently, a discordance documented by other groups that could result from trans-acting influences or regulation of RNA polymerase 42, 43. We next asked which target genes these TFs are predicted to modulate. For each candidate TF, we identified top target genes (based on a trans-regulation score) and quantified their distribution across our five previously defined maturation modules. Reassuringly, TFs active at early time points (d80–150) exhibited regulatory potential directed predominantly towards “early” module TGs, while TFs active in middle (d200–350) and late (d400–550) developmental stages were enriched for TGs belonging to more mature modules (Fig. 2h). We next confirmed protein-level presence of several candidate maturation TFs in hCO astrocyte-lineage cells (Fig. 2i-n and Extended Data Figure 4). Lastly, we tested the functional capacity of one of our top candidates, ASCL1, to influence astrocyte maturation. While ASCL1 has been previously implicated in astrogenesis23, less is known about its role in maturation induction. We developed a doxycycline-inducible lentiviral construct to induce ASCL1 expression in both primary fetal tissue and hCOs at d130, a developmental stage early in our maturation timeline, but after astrocyte specification. Upon ASCL1 induction we observed a substantial enrichment of maturation genes including robust induction of gIPC markers—EGFR, OLIG1, and OLIG2 (Extended Data Figure 5 & 6).
IDHwt tumor and margin molecular differences
Astrocytes within GBM tumors exist on a differentiation spectrum 12. Therefore, we next asked what molecular and genomic features distinguish neoplastic astrocyte lineage cells from parenchymal astrocytes in surrounding margin tissue. Using fresh primary GBM tissue samples, we performed bulk ATAC- and RNA-seq on purified astrocytes acquired from 12 IDHwt (grade IV GBM) tumor core and 11 paired non-contrast enhancing margin tissues (resected upon surgical approach) (Fig. 3a; Supplementary Tables 5-6). For each sample, we immunopanned to enrich for astrocyte lineage cells, as previous studies have demonstrated that antibodies directed against HepaCAM can capture both normal and neoplastic astrocytes 22, 44, 45. We observed clear chromatin- and transcriptome-level separation between tumor core and margin astrocyte populations (Fig. 3b and c; Supplementary Table 7).
Figure 3. Diverging molecular profiles of GBM tumor and margin astrocyte lineage cells.

(a) Schematic showing collection of IDHwt tumor and margin astrocytes for joint ATAC-seq and RNA-seq profiling. (b) PCAs of ATAC-seq and (c) RNA-seq data from IDHwt tumor (green) and margin (purple) astrocyte enriched samples. (d) Differentially accessible peaks between IDHwt tumor and margin astrocyte lineage cells (padj < 0.05 and |log2FC| > 1). Columns are annotated with a stemness score derived from the scaled and summed expression of common stem markers (Supplementary Table 9). (e) Heatmap showing differential gene expression between margin (FDR<0.05 and log2FC<−2) and tumor (FDR<0.05 and log2FC>2) astrocyte lineage cells. (f) Volcano plot showing DEGs between margin (padj < 0.05 and log2FC < −2) and tumor (padj < 0.05 and log2FC > 2) astrocyte lineage cells (gray). Mature astrocyte markers are colored purple and fetal astrocyte markers are green. (g) Schematic of collection of IDHwt tumor and margin nuclei from frozen primary tissue samples for single-nuclei multiome (ATAC-seq and RNA-seq) profiling. (h) UMAP of single nuclei (gene activity; combined RNA and ATAC). Astrocyte-lineage clusters are in blue (see Extended Data Figure 7a). (i) Non-neoplastic astrocyte-lineage cells in gray and neoplastic cells in blue, as defined by gene expression and CNV identity (see Extended Data Figure 7). (j) Combined gene activity score of postnatal (top) and fetal (bottom) astrocyte gene signatures within astrocyte lineage clusters.
We found that differential peak accessibility appeared to be closely associated with the degree of sample stemness, which we calculated using the normalized cumulative expression of previously defined stem-like markers (Fig. 3d; Supplementary Tables 8 and 9). At the transcriptomic level, differential expression analysis (FDR<0.05, |log2FC|>2) between IDHwt tumor and margin astrocytes revealed a significant overrepresentation of fetal astrocyte genes upregulated in tumor astrocyte lineage cells (p= 1×10⁻¹²) as compared to postnatal astrocyte genes in margin astrocytes (p= 7.7×10⁻¹⁴) (Fig. 3e-f; Supplementary Tables 10-12).
While bulk sequencing of purified astrocytes provides the read depth to investigate even subtle molecular differences, an important caveat is the possibility that immunopanning might not capture all astrocyte lineage cells. To account for this, we performed single-nucleus multiome (snRNA-seq and snATAC-seq) sequencing on a subset of the tissue samples from the above sample collection (Fig. 3g; Supplementary Tables 13-14). We annotated clusters using gene activity scores of known cell type-specific markers (Supplementary Table 15) and identified all primary CNS cell types (Fig. 3h and Extended Data Figure 7; Supplementary Table 16) Astrocyte lineage populations were defined by high gene activity scores for a combination of pre-defined astrocyte markers (Supplementary Table 17) and we focused on these clusters for downstream analyses (Fig. 3h-i). Next, we classified cells as either neoplastic or non-neoplastic based on tissue source, transcriptomic marker expression, and CNV enrichment (Fig. 3i and Extended Data Figure 7c-f). While neoplastic and non-neoplastic astrocytes largely segregated by whether they were collected from tumor core or margin resections, we observed sporadic exceptions to this trend, likely indicative of infiltrating tumor cells within the margin samples. When examining the gene activity score for fetal and postnatal human astrocyte genes (Supplementary Table 7), we again observed a clear enrichment of postnatal astrocyte genes in non-neoplastic astrocytes and a general enrichment of fetal astrocyte genes in neoplastic cells (Fig. 3j). However, this panel of astrocyte genes represents the extreme limits of the developmental spectrum and we hypothesized that our high-resolution astrocyte trajectory would provide a more specific indication of where neoplastic astrocyte lineage cells align or deviate from normal development.
Projecting GBM astrocytes onto a normal maturation trajectory
We next projected our bulk GBM astrocyte data onto our newly defined human astrocyte maturation timeline (Fig. 4a). At the bulk level, tumor astrocytes predominantly share a molecular signature with developing astrocytes from early - middle time points, unlike margin astrocytes, which more closely resemble hCO astrocytes from middle - late time points (Fig. 4b).
Figure 4. GBM astrocyte lineage cells deviate from normal development at middle stages.

(a) Approach for projecting astrocyte maturation trajectory onto IDHwt tumor and margin astrocyte lineage cells. (b) Spearman correlation of maturation signature between IDHwt tumor and margin astrocyte lineage cells and hCO-derived astrocytes at each timepoint. (c) UMAPs of scaled gene activity for top 50 genes within each maturation module across astrocyte lineage clusters. (d, Top) GBmap scRNA-seq data 46 annotated for neoplastic astrocyte-like (light blue), neoplastic astrocyte-like proliferating (dark blue), and non-neoplastic parenchymal astrocyte (purple) clusters. (d, Bottom) Scaled expression of top 100 genes in each maturation module across each GBmap astrocyte lineage cluster. (e) Spatial transcriptomic surface plots showing enrichment of “early”, “middle”, and “middle/late” maturation gene modules in (left) histologically defined regions 47. (f) Normalized motif enrichment of PECA maturation TFs in neoplastic and non-neoplastic astrocyte lineage clusters with a line of best fit and SEM envelope. (g) Scaled motif deviation scores for PAX3 (top) and RFX4 (bottom) across astrocyte lineage clusters.
To further resolve this developmental bifurcation, we examined the enrichment of each maturation module (Supplementary Table 18) across our single nuclei astrocyte lineage cell clusters. This analysis again demonstrated a profound enrichment for “early”, “early/middle”, and “middle” gene modules within neoplastic astrocyte lineage cells (Fig. 4c). Conversely, non-neoplastic cells predominantly exhibited an enrichment of “middle/late” and “late” maturation modules, consistent with a more mature identity (Fig. 4c). Patient-to-patient heterogeneity is a defining hallmark of GBM, so we expanded this analysis to see if these findings held true across a larger and more diverse cohort. We analyzed sc-RNA-seq data collected from 110 separate individuals (>300k cells) with IDHwt GBM tumors 46. As we observed in the bulk and single nucleus data, we again saw a strong enrichment of the “middle” signature in the majority of neoplastic astrocyte lineage cells (Fig. 4d). To investigate the spatial organization of our maturation gene signatures, we overlayed our modules onto published spatial transcriptomics datasets 47. There, we found distinct spatial arrangements, with “early” and “middle” genes enriched in the tumor parenchyma, including proliferative pseudopalisading regions (Fig 4e).
Astrocyte maturation TF candidates also displayed unique enrichment within GBM astrocyte lineage cells. We calculated motif enrichment for our 29 PECA-predicted TF candidates (Supplementary Table 4) across single nuclei from astrocyte lineage cells and found several TFs exhibited biased motif accessibility within neoplastic cells — POU3F2, POU3F3, POU3F4, PAX3, OLIG1, OLIG2, HEY1, and MYCN — many of which have been previously implicated in GBM and astrocyte lineage commitment (Fig 4f-g) 35–37, 48–57.
Subtype-specific molecular signatures in GBM astrocytes
Over the course of tissue collection, we procured tumor samples harboring a variety of genetic abnormalities. These included primary IDHwt GBM, IDH1-mutant (IDH1mt) adult-type diffuse gliomas, and several recurrent IDHwt GBM tumors. Our cohort of IDHwt tumors contained various combinations of common GBM-associated aberrations in genes like EGFR, PDGFRA, and PTEN (Supplementary Table 6). To account for how these variables may contribute differences in maturation state, we sought to identify molecular and transcriptomic signatures associated with each feature. To make these statistical comparisons, we binned our samples into six categories for which there was a minimum of at least two samples per group- (1) IDH1mt, (2) EGFR, (2) PTEN, (4) EGFR+PDGFRA, (5) EGFR+PDGFRA+PTEN, (6) recurrent (Supplementary Table 19).
At the ATAC-seq level, we found 11,134 peaks specific (FDR<0.05) to astrocytes from one or more of our six categories, with 5,730 peaks unique to only one of the six categories (Fig. 5a; Supplementary Table 20). Within these specific peak signatures, we identified enrichment of unique sets of TF motifs affiliated with biological functions including stem cell maintenance, immune response, and early forebrain development (Fig. 5b; Supplementary Table 21). Interestingly, peaks associated with tumors harboring EGFR amplifications were enriched for glial development TF binding sites, including SOX8 and SOX9 motifs (Fig. 5b). We performed a similar analysis with the RNA-seq data and found category-specific gene sets involved in a variety of metabolic, developmental, and homeostatic processes (Extended Data Figure 8a; Supplementary Table 22). Notably, astrocyte lineage cells within tumors containing EGFR-amplifications were particularly biased towards and early gene signature (Fig. 5c).
Figure 5: Subtype-specific molecular signatures in tumor astrocyte lineage cells.

(a-c) Heatmaps of ATAC and gene signatures unique to astrocytes from tumors with various genomic diagnoses. (b) Top 5 TF motifs enriched in each categorical peak set with select TFs annotated on heatmap. (c) RNA-seq heatmap with hierarchical clustering of genetic signatures enriched in various GBM molecular backgrounds. These gene signatures can be broadly classified as pan-tumor, enriched in EGFR amplified astrocytes, or enriched in IDH1 mutant astrocytes. Pie charts indicate enrichment of maturation module genes within each of the above genetic groupings. (d) PCA of RNA-seq data from IDHwt, IDH1mt, and margin astrocyte samples. (e) Volcano plots showing overlay of maturation module genes with DEGs between IDHwt and IDH1mt (FDR<0.05 and |log2FC|>2) astrocyte lineage cells. DEGs in gray and colored based on maturation state. (f) (Top line) PC2 for RNA-seq data from immature (fetal, primary tissue) and mature (adult, primary tissue). (Bottom line) IDHwt tumor, IDH1mt tumor, and all GBM margin astrocyte lineage cells project on same PC. (g) Schematic of proposed molecular maturation spectrum across all tumor astrocyte lineage cells.
By far, the most unique category of astrocytes was the IDH1mt group, which now belong to a separate tumor classification than GBM58, 59. These tumors are slow growing, metabolically perturbed, epigenetically distinct, and associated with improved clinical outcomes compared to IDHwt cases 60–65. We observed that astrocytes from IDH1mt tumors have a distinctive transcriptomic signature, with some samples even bearing a closer resemblance to margin astrocytes than to astrocytes from IDHwt tumors (Fig. 5d; Supplementary Table 11). Transcriptomically, IDH1wt astrocytes showed a clear upregulation of “early”, “early/middle”, and “middle” maturation genes as compared to IDHmt tumor astrocytes (Fig. 5e and Extended Data Figure 8b). To confirm that the astrocytes we purified from IDH1mt tumors were not simply bystander parenchymal cells trapped within the tumor core, we also compared their expression profiles to astrocytes from margin tissue acquired from matched samples (Extended Data Figure 8c-e; Supplementary Table 12). Altogether, our transcriptomic signatures portray a clear maturation spectrum, with IDHwt tumor astrocytes falling closest to the fetal (immature) end of the spectrum, followed by IDH1mt tumor astrocytes, and finally, margin astrocytes, which exhibit a predominantly adult quiescent signature (Fig. 5f-g).
DNA methylation differences in IDHwt and IDH1mt tumors
Gliomas harboring IDH1 mutations produce D-2-hydroxyglutarate (D2HG) instead of α-ketoglutarate (KG) 66, which disrupts fundamental biological processes that rely on α-KG, including ten-eleven translocation (TET) enzyme activity 67, 68. TET enzymes help facilitate DNA demethylation by oxidizing 5-methylcytosine (5mC) to 5-hydroxymethylcytosine (5hmC) and downstream oxidation steps in active cytosine demethylation 69–71. Perturbed TET activity has been shown to contribute to the altered DNA methylation landscape in IDH1mt glioma and may be linked to the CpG island methylator phenotype, a common pathological feature of IDH1mt glioma 72, 73. Given the implications of these important epigenetic modifications on gene regulation, we mapped genome-wide 5mC and 5hmC patterns across IDH1mt and IDHwt tumors to determine whether differences in these epigenetic features could bias astrocyte maturation in IDH1mt cells.
First, we performed methylated-DNA immunoprecipitation (MeDIP) and hydroxymethylated-DNA selective chemical labeling (hMe-Seal) using flash-frozen tissue from three IDH1mt adult-type diffuse gliomas, three IDHwt GBMs, and three margin tissue samples as controls to compare genome-wide 5mC and 5hmC patterns (Fig. 6a; Supplementary Table 23). The three sample groups exhibited markedly unique global 5mC and 5hmC signatures, which is consistent with existing methylation hybridization panel-based data 59, 74, 75 (Fig. 6c and Extended Data Figure 9a). We also observed specificity within the genomic loci of differentially methylated and hydroxymethylated regions (DMRs and DhMRs) when comparing IDH1mt and IDHwt tumors. The majority of accumulated DMRs in IDH1mt appeared in promoter and exonic regions while DhMRs were in promoter and intronic regions (Fig. 6b and Extended Data Figure 9b-c). In comparison, the majority of DMRs and DhMRs depleted in IDH1mt were located in intergenic and intronic regions (Fig. 6b and Extended Data Figure 9b-c). Examples of differential 5hmC can be clearly observed in both immature (EGFR) and mature (NTRK2) astrocyte genes samples (Fig. 6d). We further validated our DhMR hits by performing 5hmC-Capture-qPCR for our top 10 hits; all of these targets confirmed our genome-wide data (Extended Data Figure 9g, Supplementary Table 24).
Figure 6: DNA hydroxymethylation and D2HG in IDH1mt tumor astrocyte lineage cells.

(a) Schematic of aberrant DNA methylation (5mC) and hydroxymethylation (5hmC) in IDH1mt cells and approach for comparing global 5mC and 5hmC levels in IDH1mt and IDHwt samples. (b) Bar plot showing the number of genes that annotate differentially hydroxymethylated regions. (c) PCA of 5hmC data. (d, e) Example plots of differential 5hmC in (d) EGFR and (e) NTRK2. Plots depict 5hmC signal across IDHwt (gray) and IDH1mt (red) samples. (f) DEGs (|log2FC|>2, FDR<0.05) between IDH1mt and IDHwt astrocyte lineage cells. DE fetal astrocyte genes are shown in yellow and postnatal astrocyte genes in purple. (g, h) NGS plots and corresponding box and whisker plots showing gene body 5hmC levels in IDH1mt and IDHwt tumors at (g) postnatal (n = 43) and (h) fetal astrocyte (n = 162) genes. Box and whisker plots reflect five variables: minimum (lower whisker), first quartile (the lower bounds of the box), median (center line), third quartile (the upper bounds of the box), and maximum (upper whisker). (i) Schematic showing experimental paradigm for exposing human fetal astrocytes to D2HG and vehicle control (DMSO). (j) Bar plot and (k) ICC images showing relative abundance of EdU+ cells in control (left) and D2HG (right) treatments (n = 3). (j) Bars represent the mean FC of EdU/DAPI levels for DMSO/no treatment and D2HG/DMSO comparisons (n = 3; two-tailed paired t-test; p = 0.002). (k) EdU+ cells are in yellow and DAPI is in magenta. (l) Volcano plot showing DEGs (p.adj < 0.05) between control and D2HG-treated astrocytes. Immature DEGs are in yellow and mature DEGs are in purple (n = 6). (m, n) Bar plots show mean expression of example genes, (m) TOP2A and (n) EZH2, across conditions (DMSO-treated n=6, D2HG-treated n=5). Bar graphs depict group means +/− SD (Wald test; p.adj TOP2A = 2.60E-20, p.adj EZH2 = 3.44E-05). (o) Hypothesized mechanism by which IDH-mutant-associated D2HG affects expression of astrocyte maturation genes.
We speculated that if 5mC or 5hmC was involved in astrocyte maturation, their genomic distributions would show biased patterns in maturation genes across IDH1mt and IDHwt tumors. We began by filtering our datasets for fetal astrocyte genes upregulated in astrocytes from IDHwt tumors and postnatal genes upregulated in IDH1mt tumor astrocytes (Fig. 6f; Supplementary Table 25). 5hmC levels showed a clear directional relationship to the expression of these maturation genes. For example, mature astrocyte genes upregulated in IDH1mt tumor cells exhibited significantly higher (p<0.001) intragenic 5hmC levels than in IDHwt samples (Fig. 6g). Conversely, fetal astrocyte genes upregulated in IDHwt tumor cells also demonstrated an accumulation of 5hmC as compared to IDHmt samples (Fig. 6h). In contrast, 5mC levels did not change with the expression of postnatal gene sets (Extended Data Figure 9d-e). Importantly, this relationship between 5hmC accumulation and gene expression was not consistent across all differentially expressed genes (Extended Data Figure 9f and h-i), suggesting that these 5hmC biases are unlikely to reflect a universal association between transcription and intragenic hydroxymethylation.
An important prediction from our model is the idea that the oncometabolite D2HG, itself, could functionally regulate astrocyte maturation. To test this possibility, we examined the consequences of D2HG exposure on primary fetal human astrocytes—an immature, but non-oncogenic population. We purified astrocytes from primary human fetal cortical tissues and cultured cells in either (1) un-supplemented astrocyte growth media (AGM), (2) AGM supplemented with DMSO, or (3) AGM supplemented with D2HG (Fig. 6i and Extended Data Figure 10a-c). After one week in culture with DMSO or D2HG, we treated fetal astrocytes with a 24-hr EdU pulse. Notably, we observed substantially fewer actively dividing astrocytes in the D2HG condition compared to the vehicle control and untreated cells (p = 0.002; Fig. 6j-k). We further validated these observations via bulk RNA-seq, which revealed hundreds of DEGs between astrocytes exposed to D2HG and DMSO. As expected, DMSO-exposed fetal astrocytes were transcriptomically indistinguishable from untreated cells (Extended Data Figure 10d); however, fetal astrocytes exposed to D2HG exhibited a striking downregulation of early astrocyte genes, including genes that are highly expressed in IDHwt GBM and other gliomas (Fig. 6l-n and Extended Data Figure 10e-f). This observation was accompanied by a more modest upregulation of mature astrocyte genes as compared to vehicle control treated cells (Fig. 6l and Extended Data Figure 10e). Together, this data supports a model where D2HG, the oncometabolite produced by IDH-mutant tumors, may suppress immature gene expression and consequently, cell proliferation, through aberrant TET-mediated chromatin hydroxymethylation patterns (Fig. 6o).
DISCUSSION
There is ample data indicating that GBM tumors reflect immature glial cell states. However, endogenous glial developmental trajectories are also far more complex than previously believed and include multi-potent progenitor states and developmental mechanisms that are repurposed across lineages 23, 35, 76. To understand how the blueprints of glial development are mimicked in neoplastic settings, we need high-resolution molecular maps of normal glial maturation. In this study, we discovered that GBM astrocyte lineage cells are not merely “immature”, but overwhelmingly reflect a specific phase of astrocyte maturation, a stage that we hypothesize to be a critical checkpoint in glial fate determination. Interestingly, D2HG, the oncometabolite produced by IDH1mt gliomas, appears to suppress this plastic proliferative signature, potentially through aberrant DNA hydroxymethylation patterns that lead to a more quiescent phenotype in IDH1mt astrocyte lineage cells.
This work raises two fundamental questions: (1) Why does astrocyte maturation require a multi-stage process, and (2) what are the consequences of the middle-stage of astrocyte maturation being so overrepresented in GBM astrocyte lineage cells? These questions are each addressed below.
Astrocytes undergo a three-step maturation transformation
Several neural cell types exhibit a multistep maturation trajectory. For example, oligodendrocytes proceed through a pre-OPC, OPC, and newly formed oligodendrocyte phase before their ultimate myelinating state 77, 78. In this scenario, the presence of intermediate developmental stages offers the opportunity to maintain an active progenitor pool, and also speaks to the considerable cellular specialization required during transformation into a myelinating phenotype. We propose that astrocyte maturation follows a similar logic. The transformation from rapidly expanding progenitors that must fully occupy the developing brain parenchyma to a highly specialized cell type in terms of both morphology and function is not immediate. This maturation process requires the presence of an intermediate step where astrocytes lose their proliferative capacity, activate glial fate-determining TFs, and begin the commitment towards specialization. This raises a further question of whether the intermediate stage represents a completely transient developmental phase, or if, like OPCs, some astrocyte lineage cells remain in this particular developmental state in perpetuity throughout adulthood. Several adult human single cell atlases do show that intermediate stage markers (EGFR, SOX9, ASCL1) are expressed in the cortex 79, 80, suggesting there may be some echo of immaturity in the mature human brain. Whether intermediate stage astrocytes could be a kindling source for glioma development, or a physiological reservoir of newborn astrocytes remains an important question to address.
Potential origins of cellular diversity in GBM
In the context of IDHwt GBM, we found a clear enrichment of the “middle” maturation signature among astrocyte lineage cells. Whether the “middle” stage is the result of a differentiation roadblock or represents an “attractor” state that endows the tumor with beneficial functional capacities remains uncertain. Regardless, this finding may explain a detrimental feature of GBM tumors—that neoplastic cells exhibit remarkable lineage plasticity and even have the capacity to transdifferentiate across progenitor states when xenografted into the mouse brain 12, 81, 82. Existing evidence suggests that outer radial-glia like stem cells contribute to significant cellular heterogeneity in GBM 11. However, it is plausible that intermediate state astrocyte lineage cells may also play a similar role. This idea is supported by the overlap between our middle astrocyte maturation state and recently defined multi-potent glial progenitors, which exhibit clear developmental capacity to enter astrocyte or oligodendrocyte and even neuronal lineages 35–38, 76. Therefore, these cells may represent yet another source of considerable cellular heterogeneity in both in vivo and in vitro studies.
Maturation differences in IDHwt and IDH1mt tumor astrocytes
In contrast to GBM, astrocyte lineage cells from IDH1mt tumors lack a strong “early” – “middle” transcriptomic signature and even express more of the “middle/late” gene set, suggesting that astrocyte-like cells in these tumors are not as immature as those found in GBM. This finding is consistent with the fact that IDH1mt tumors were recently reclassified as a separate category of diffuse glioma 58, 59 due to their distinct molecular diagnostic characteristics 65, 83, less severe pathology 60–62, 84, and prolonged patient survival rate 63–65. Additionally, recent work demonstrated that astrocyte and oligodendrocyte lineages in IDHmt tumors are differentially enriched for distinct CNVs and marked by relatively low dedifferentiation rates 85. Together, these data suggest that in IDHmt tumors, astrocyte and oligodendrocyte lineage commitment is generally more stable.
We found that the suppression of early genes appears to be, at least in part, a result of exposure to D2HG, the oncometabolite produced by IDH-mutant tumors. Interestingly, a recent study demonstrated that ONC201, a drug that improves outcomes for H3K27M-mutant diffuse midline glioma (DMG) patients, increases 2-hydroxyglutarate levels and the H3K27me3 repressive mark. These changes were accompanied by a downregulation of cell cycle regulation and neuro-glial differentiation genes 86. This raises the question—does D2HG inhibit stemness through a similar mechanism in IDH-mutant gliomas? D2HG impairs both DNA and histone demethylation in a TET-dependent manner, which could have profound effects on differentiation genes in IDH-mutant tumors. We observed a direct relationship between gene body hydroxymethylation and gene expression, suggesting a possible role in regulating maturation gene transcription. However, another possibility is that aberrant histone methylation patterns are responsible for the suppression of early gene sets in astrocyte-lineage cells.
Therapeutic potential
The heterogeneous and promiscuous nature of GBM cells makes these tumors nearly impossible to entirely irradicate. Thorough timelines of glial lineage development could greatly enhance our understanding of glioma resilience and highlight additional angles for therapeutic exploration, including harnessing intrinsic and extrinsic cues to induce quiescence. The current treatment course—generally, resection, followed by chemotherapy and radiation—cannot target all tumor cells and has even been shown to select for certain cellular subtypes or push remaining cells to acquire additional mechanisms of survival 87–89. A promising therapeutic approach could be using maps of developmental lineages, like the one laid out in this study, to coerce the maturation of GBM cells. As differentiation therapies become a more viable option, it is crucial that we integrate principles of normal neurodevelopment to better understand which molecular networks to target for the most effective impacts.
MATERIALS AND METHODS
All human tissue samples were obtained in compliance with policies outlined by the Emory School of Medicine IRB office.
hiPSC culture
One male (C3.1) and one female (C4.1) human induced pluripotent stem cell (hiPSC) line were used to form hCO cultures. These lines are not commercially available and were previously generated from unidentified healthy control individuals. hiPS cells were cultured on plates coated with vitronectin (ThermoFisher, Cat. A14700) and maintained in Essential 8 medium (Thermofisher, Cat. A1517001). The two iPSC lines were genotyped by SNP-array to confirm genomic integrity and screened regularly for Mycoplasma contamination.
Human cortical organoid formation and culturing
Human cortical organoids (hCOs) were formed using a previously published protocol. In short, once at 80–90% confluency, hiPSC colonies were detached from plates to form spheroids using the dispase method described in Sloan et al, 2018. Next, spheroids were exposed to a series of small molecules to pattern towards dorsal forebrain identity. For the first 6 days in culture, spheroids were exposed to neural induction media (DMEM/F12, KSR, NEAA, Glutamax, Pen/Strep, Beta-mercaptoethanol) supplemented with Dorsomorphin (Sigma, Cat. 142 P5499–25MG, 5 μM) and SB-431542 (Selleck Chemicals, Cat. S1067, 10 μM) for dual-SMAD pathway inhibition. During this time, media was changed daily. Next, spheroids were treated with neural media, consisting of: neurobasal A (Thermo Fisher Scientific, Cat. 10888), B-27 supplement without vitamin A (Thermo Fisher Scientific, Cat. 12587), GlutaMax (1:100, Thermo Fisher Scientific, Cat. 35050061), penicillin and streptomycin (1:100, Thermo Fisher Scientific, Cat. 15140122), supplemented with EGF (20 ng/mL, R&D Systems, Cat. 236-EG-01M) and FGF2 (20 ng/mL, R&D Systems, Cat. 233-FB01M). Neural media was changed daily through 15 days in culture, and then every other day for days 16–24. From days 25–43 in culture, spheroids were treated every other day with neural media supplemented with BDNF (20 ng/mL, PeproTech, Cat. 450–02-147 1mg) and NT-3 (20 ng/mL, R&D Systems, Cat. 267-N3–005/CF). After day 43, maturing organoids were fed with neural media only every 3–4 days until collected for experimental timepoints.
GBM tissue procurement
This study uses two types of high-grade adult-type diffuse gliomas—IDHwt GBM (grade IV) and IDH1mt gliomas (n = 4, one sample with 1p/19q co-deletion)—procured under the WHO 2016 classification guidelines (see Supplementary Table 6). Paired “tumor” and “margin” tissue samples were obtained from surgical resections performed with informed consent under a protocol approved by the Emory University Institutional Review Board. In this study, margin tissue samples, brain tissue from around the edges of the GBM resection, serve as a patient-paired quiescent control. However, we acknowledge that this tissue contains infiltering tumor cells, which we were able to distinguish from non-neoplastic cells via single nuclei sequencing (Fig. 3i and Extended Data Figure 7). Marginal brain tissue was obtained after safe and maximal surgical removal of tumor as deemed appropriate by the operating neurosurgeon, using techniques including direct vision, image-guidance, and fluorescent-guidance. The surgical margin was searched for brain that is free of surgery-induced contusion and coagulation artifact and appeared viable. These samples included white and gray matter generally taken 2–10 mm beyond the edge of what had clearly been tumor tissue. In cases where tumor is adjacent to or in brain harboring eloquent functioning, such as speech, motor and visual function sampling is not undertaken so as to preserve those functions. Thus, sampling is directed to cerebral tissue from more functionally quiescent regions. After tissue resection, tumor and margin samples were immediately deposited in 4ºC Hibernate-A medium (Thermo Fisher Scientific, Cat. A1247501) and prepared for tissue dissociation within 1 hr post-resection. Tumors were resected based exclusively to meet surgical and clinical need and that no additional or excess tissue was ever acquired for the purposes of this study.
Tissue dissociation and immunopanning
hCOs, primary GBM, and primary fetal cortical (GW 16–20) tissue samples were dissociated following a previously established protocol. In short, we enzymatically dissociated tissue using Papain (Worthington Biochemical, Cat. LS003126) at 20U/mL at 34°C for one-hour, quenched Papain with ovomucoid solution, mechanically dissociated tissue by triturating to obtain single-cell suspension, and then filtered through a 40μM strainer. Once we had a single-cell suspension, we proceeded to purify individual cell types using an immunopanning protocol outlined below.
Single-cell suspensions were added to a series of 10 (for hCO) or 15 (for primary tissue) cm Petri dishes pre-coated with cell-type specific primary antibodies (listed below) for the depletion of unwanted cell types and the final enrichment of astrocytes. Cell suspensions were incubated on plates for 5 or 15 minutes, depending on the coating antibody, and then unbound cells were transferred to the next plate in the sequence until the final positive selection plate.
hCO plate sequence: one anti-THY1 for 5 mins (BD Biosciences, Cat. 550402) to deplete neurons, followed by either an anti-CD49f (immature astrocytes; BioLegend, Cat. 313602) plate for 15 mins or an anti-HepaCAM (astrocytes; R&D Systems, Cat. MAB4108) for 15 mins. At early time points (<100 days), only CD49f+ cells are abundant with very few HepaCAM+ cells. By day 150, the ratio of CD49f+ cells to HepaCAM+ cells started to shift, such that we had roughly equivalent numbers of each and then continues to shift towards a HepaCAM+ enrichment over time. For this reason, we collected CD49f+ cells for the 80- and 100- day time points, both CD49+ and HepaCAM+ cells for the 150-day time points, and for all later time points we used HepaCAM+ cells. In our analysis, we found that CD49f+ and HepaCAM+ cells from d150 hCOs had nearly identical transcriptomic and genomic accessibility profiles, suggesting that these antibodies capture a similar population as these cells mature.
GBM tissue plate sequence: one anti-CD45 (R&D Systems, Cat. MAB1430) plate for 5 mins to deplete macrophages, two sequential anti-O4 (in-house hybridoma) plates for 5 mins each to deplete pre- and mature/myelinating oligodendrocytes, and an anti-HepaCAM (R&D Systems, Cat. MAB4108) plate for 15 mins each to positively select for astrocytes.
Fetal tissue plate sequence: cell suspension was split across three simultaneous anti-CD24 (Miltenyi Biotec, Cat. 130–108-037) plates for 5 mins to deplete neuronal lineage cells and the unbound fraction was transferred to either three simultaneous anti-CD49f (BioLegend, Cat. 313602) plates (for fetal astrocyte D2HG culture experiments) or anti-HepaCAM (R&D Systems, Cat. MAB4108) plates (for ASCL1 overexpression in fetal astrocytes experiments) for 15 mins to positively select for astrocytes.
For both hCO and GBM tissue samples, we ended plate sequences with two positive-selection astrocyte plates- one for RNA-seq libraries and the other for ATAC-seq libraries. For RNA-seq, we scraped cells using 700uL Qiazol (Qiagen, Cat. 79306) and froze at −80°C for downstream processing. For ATAC-seq library preparation, we incubated cells in a trypsin solution at 37°C for 5 mins and gently dislodged cells from the plates for further processing.
Bulk ATAC-seq library prep
Bulk ATAC-seq libraries were prepared following the previously established Omni-ATAC protocol 90 with minor modifications. Briefly, astrocytes that were trypsinized during immunopanning were counted and 10,000–50,000 cells were washed with cold ATAC-seq resuspension buffer (RSB; 10 mM Tris-HCl pH 7.4, 10 mM NaCl, and 3 mM MgCl2 in water), and permeabilized with ATAC-seq lysis buffer (RSB supplemented with 0.1% NP40, 0.1% Tween-20, and 0.01% digitonin). For the transposition step, nuclei were resuspended in 50 μl of transposition mix (25 μl 2× TD buffer, 2.5 μl transposase, 16.5 μl PBS, 0.5 μl 1% digitonin, 0.5 μl 10% Tween-20, and 5 μl water) and incubated at 37 °C for 30 min in a thermomixer with shaking. DNA was purified with the Qiagen MinElute PCR Purification kit (Qiagen, Cat. 28004) and PCR amplified for 5 cycles with Illumina Nextera adaptors using NEBNext High Fidelity 2x Master Mix (New England Biolabs, Cat. M0541S). Next, a qPCR reaction was performed using 10% of the pre-amplified PCR product. We looked for the Ct value at ¼ maximum fluorescence to determine the number of additional cycles to amplify the ATAC-seq libraries. After a second round of PCR amplification (all together, a total of 8–10 cycles), we performed a second cleanup with 1.8x Ampure XP beads (Aline biosciences, Cat. C-1003–50). Fragment size distribution and concentration were evaluated via Bioanalyzer and libraries were sequenced using 2×150-bp reads on an Illumina HiSeq 2500 instrument at a targeted depth of 50 million paired-end reads per sample.
Bulk RNA-seq library prep
For bulk RNA-seq libraries, we extracted RNA from purified astrocytes using the miRNeasy kit (QIAGEN, Cat. 217004) according to the manufacturer’s protocol. We assessed the quality of RNA via Bioanalyzer (Agilent, Eukaryotic Total RNA Pico kit, Cat. 5067–1513) and RNA samples with an RNA integrity number (RIN) less than 8 were discarded. We prepared bulk RNA-seq libraries with the NEBNext Ultra II kit (New England Biolabs, Cat. E7805S) using poly-A selection and cDNA library quality was assessed via Bioanalyzer (Agilent, High Sensitivity DNA kit, Cat. 5067–4626). Libraries were sequenced using 2×150-bp reads on an Illumina Hiseq 2500 instrument at a targeted depth of 20 million paired-end reads per sample.
Single-nucleus multiome library preparation and sequencing from from GBM tissue
Nuclei were extracted from frozen GBM tissues following a previously established protocol 90, 91. For all samples, ~20 mg of tissue was dissociated with a 2-ml Dounce homogenizer in homogenization buffer (0.26 M sucrose, 0.03 M KCl, 0.01 M MgCl2, 0.02 M Tricine-KOH pH 7.8, 0.001 M DTT, 0.5 mM Spermidine, 0.15 mM Spermine, 0.3% NP40, and cOmplete Protease inhibitor). This was followed by filtering through a 40um Flowmi cell strainer, then a 20um bucket-style cell strainer, and centrifugation for 10 min at 600 xg. After the majority of the supernatant was carefully removed, the pellet was resuspended in homogenization buffer and mixed with an equal volume of 50% iodixanol solution to make a final concentration of 25% iodixanol. Next, a 30% iodixanol solution, followed by a 40% iodixanol solution, was layered under the 25% mixture and centrifuged for 20 min at 3000 xg without the centrifuge brake. Post-centrifugation, a thin white nuclei band was carefully collected from the interface of the 30% and 40% iodixanol solutions. Nuclei underwent 1–2 wash steps to remove any additional debris by gently mixing nuclei in ATAC- RSB-Tween buffer (0.01 M Tris-HCl pH 7.5, 0.01 M NaCl, 0.003 M MgCl2, 0.1% Tween-20) and centrifuging for 10 min at 600 xg. Nuclei were then counted and a total of 16,100 nuclei were collected for library preparation with the 10x Genomics Single Cell Multiome ATAC + Gene Expression kit (10x Genomics, Cat. 1000285) following the manufacturer’s protocol for transposition, 10x capture, and library preparation. Libraries were assessed via Bioanalyzer (Agilent, High Sensitivity DNA kit, Cat. 5067–4626) and sequenced at a target depth of at least 50,000 read-pairs per nucleus using 2×150-bp reads on an Illumina Novaseq 6000 instrument through Admera Health. Libraries were processed using the 10x Genomics Cell Ranger ARC (cellranger-arc-2.0.0) pipeline with default parameters and aligned to the hg38 reference genome (refdata-cellranger-arc-GRCh38–2020-A-2.0.0). The quality control matrix containing raw and filtered read numbers is provided in Supplementary Table 14.
Fetal astrocyte D2HG culture experiments
Fresh fetal cortical tissue (16–20 GW) was dissociated as described in the “Tissue dissociation and immunopanning” section. CD49f+ cells were trypsonized, centrifuged at 300 xg for 10 mins, counted using a hemocytometer, and 50,000 cells were plated on poly-D-lysine-coated plastic coverslips in a Neurobasal-DMEM-based serum-free medium supplemented with HBEGF (R&D Systems; Cat. 259-HE).
Purified astrocytes were treated with either basal media, or media supplemented with DMSO or Octyl-D-2HG (Sigma-Aldrich; Cat. SML2200), a membrane-permeant precursor form of the oncometabolite D-2-hydroxyglutarate (D-2HG) produced by tumor cells. We first tested three different concentrations of D2HG—1.0 mM, 0.5 mM, and 0.1 mM—treating astrocytes with each concentration for 48 hrs (Extended Data Figure 10a). Based on this initial exposure, we opted to perform further experiments with 0.1 mM D2HG as this was the concentration where astrocytes were healthiest and remained viable for at least one week (Extended Data Figure 10a-b). Media was changed every day for 1 week, with fresh D2HG or DMSO. Cells used for EdU assay were treated with respective media solution supplemented with EdU approximately 24 hours prior to collection for ICC. Cells used for bulk RNA-seq were scraped in Qiazol and RNA was extracted using Qiagen’s RNeasy kit (Qiagen; Cat. 74104). Libraries were prepared using Takara Bio’s SMART-Seq HT kit (Takara Bio; Cat. R400749).
Fetal astrocyte ICC
Cells collected for ICC were fixed in 4% PFA for 15 mins at room temperature. Cells were then washed in 3% BSA and incubated for 20 mins in 0.5% Triton-X at room temperature. The EdU protocol was followed according to the manufacturer’s directions (Thermo Scientific; Cat. C10339). After incubating cells in the EdU reaction cocktail for 30 mins in the dark, cells were rinsed three times with 3% BSA, where the first wash was supplemented with DAPI (1:1000; Thermo Fisher Scientific; Cat. D3571). Coverslips with cells were mounted to slides using Fluoromount-G mounting medium. Slides were air dried overnight and then imaged on Keyence BZ-X810. DAPI and EdU+ cell counts were quantified using the hybrid cell count function in the BZ-X800 software and EdU/DAPI ratios were quantified for each treatment condition. For instances where we had multiple technical replicates (coverslips) for individual biological replicates and conditions, we took the mean EdU/DAPI ratio. A Shapiro-Wilk test indicated data was normally distributed, so a paired t-test was used to compare EdU/DAPI fold change between DMSO and D2HG groups.
hCO IHC
hCOs were fixed with 4% paraformaldehyde for 3–4 hours at 4 degrees and then incubated with 30% sucrose for 24–48 hours. Next, hCOs were washed in O.C.T. compound and immersed in cryomolds containing O.C.T. Cryomolds were stored at −80 until the blocks were sectioned on a cryostat at 16 um thickness. Cryosections were washed three times (10 mins each) in PBS containing 0.01% triton X-100 and blocked in PBS containing 10% normal donkey serum and 0.3% triton X-100 for 60 mins at room temperature. Sections were incubated overnight at 4 degrees in a PBS buffer containing 10% normal donkey serum and 0.3% triton X-100 supplemented with the following antibodies: Chk anti-GFAP (1:1000, BioLegend Cat. PCK-591P), Rb anti-RFX4 (1:50, Atlas Antibodies Cat. HPA05052), Gt anti-SOX21 (1:50, R&D Systems Cat. AF3538), Rb anti-OLIG2 (1:100, Millipore Sigma Cat. AB9610), Rb anti-NFIA (1:200, Abcam Cat. ab228897), Ms anti-NR3C2 (1:250, R&D Systems Cat. MAB4369, Clone # 385707), and Gt anti-SOX9 (1:200, R&D Systems Cat. AF3075). The next day, sections were washed three times (10 mins each) in PBS containing 0.01% triton X-100 to remove unbound primary antibodies. Sections were incubated for 1 hr at room temperature and in the dark in PBS containing 10% normal donkey serum and 0.3% triton X-100, supplemented with DAPI (1:1000) and secondary antibody (1:1000): Dk anti-Chk 647 (Jackson ImmunoResearch Cat. 703–605-155), Dk anti-Gt 488 (Abcam Cat. ab150133), Dk anti-Rb 488 (Abcam Cat. ab150061), Dk anti-Ms 488 (Abcam Cat. ab150109), and Dk anti-Rb 594 (Abcam Cat. ab150064). Slides were washed three times (10 mins each) with PBS containing 0.01% triton X-100 and coverslipped using Fluoromount-G mounting medium (Thermo Fisher Scientific; Cat. 00–4958-02). Slides were air dried overnight and then imaged on a confocal microscope (Leica Stellaris 5; Las-X) using the 40x objective.
Quantification of maturation TF (SOX21, NR3C2, and OLIG2) fluorescence was carried out using the image analysis software Fiji (doi:10.1038/nmeth.2019). First, a border was drawn around an individual hCO section to remove background. Next, we created a mask using the NFIA and SOX9 channels to restrict our measurement of maturation TF intensity to astrocyte lineage cells (NFIA+ or SOX9+ cells). We did so by setting both fluorescence intensity and size (30–60 um) thresholds for the NFIA and SOX9 channels. Lastly, we measured the mean gray value for the maturation TF channels within each NFIA+ and SOX9+ cell. TF fluorescent intensity was plotted for individual NFIA+ and SOX9+ cells. Intensity levels were compared between early and middle time points using a Wilcoxon signed-rank test.
Overexpression of maturation TF candidates in vitro
The ORF sequence for Ascl1 (NM_004316) was amplified from the human reference cDNA library (Takara 639654) and cloned into the multiple cloning sites of pCW57-GFP-2A-MCS (Addgene #71783) using AvrII and BamHI restriction sites. These transfer plasmids were then transfected into HEK298FT cells with Lipofectamine 3000 (Invitrogen - L3000–015) to produce lentivirus following manufacturer’s protocols.
The virus was first tested in HEK293FT cells (ThermoFisher Scientific; Cat. R70007). Cells were incubated for 48 hrs with the virus 1.7×10⁸ IU/mL, after which media was replaced with fresh media (DMEM, 10% FBS, penicillin and streptomycin) supplemented with 2 ug/ml doxycycline. Green cells were apparent after 5 days and RNA was extracted from test and control cells for RT-qPCR. RNA was extracted from cells using the RNeasy kit (Qiagen; Cat. 74104) according to the manufacturer’s instructions. RNA concentration was checked via NanoDrop and cDNA synthesis was performed using SuperScript™ IV Reverse Transcriptase (Invitrogen; Cat. 18090050) with a mix of random hexamers (Invitrogen; Cat. N8080127) and oligo d(T) (Invitrogen; Cat. 18418020), according to the manufacturer’s instructions. Samples were prepared for qPCR using the SYBR Green PowerUp Master Mix (Applied Biosystems; Cat. A25741), according to the manufacturer’s instructions. We ordered primers through Invitrogen’s custom DNA oligos. Primers include:
ASCL1_forward: cgcccaagcaagtcaagcg
ASCL1_reverse: tgctgcggcaggctgt
Primer pairs were validated for specificity and efficiency using qPCR with serial dilutions. Samples were run in triplicates to determine the proper cycle threshold (CT) of each gene. According to the manufacturer’s protocol, we performed 40 cycles of amplification. When determining fold changes in gene expression across samples, the CT of each gene was normalized according to the CT of the housekeeping gene in the same sample:
GAPDH_forward: catgagaagtatgacaacagcct
GAPDH_reverse: agtccttccacgataccaaagt
After validating in HEK298FT cells, ~d130 hCOs (n=3) or primary fetal astrocytes (HepaCAM+ cells; n=2) were transduced with either the TurboGFP:p2A:ASCL1 virus or with a GFP-only control virus (Addgene; Cat. 17446-LV). hCOs were incubated in 1.5 ml neurobasal media, while fetal astrocytes were cultured in AGM, and supplemented with 20 ul of virus (1.7×10⁸ IU/mL) for 48 hrs. Media was changed to neurobasal or AGM supplemented with 2 ug/ml of doxycycline. Doxycycline-supplemented media was changed every-other-day for 14 days (hCOsO and 10 days (fetal astrocytes). hCOs were dissociated following the “tissue dissociation and immunopanning” methods and fetal cells were dissociated by first rinsing cells with 1X PBS, and then incubating in Accutase (VWR; Cat. 10761–312) for 7 minutes at 37°C. GFP- positive and -negative cells were sorted with a DSB FACSAria II instrument for bulk RNA-seq (see Extended Data Figure 9 for gating strategy).
For hCO comparisons (Extended Data Figure 9), a Shapiro-Wilk test was used to check if data was normally distributed and Levene’s test was used to check for homogeneity of variances. A Kruskal-Wallis test and Dunn’s test for post-hoc analysis was used to compare fold change (GFP+/GFP- cells) expression of adult astrocyte, fetal astrocyte, and neuron gene sets. A Wilcoxon signed-rank test was used to compare the fold change (GFP+/GFP- cells) expression of the early/middle maturation gene set between fetal cells transduced with the ASCL1 and control viruses.
DNA isolation for 5mC/5hmC experiments
Margin, IDH1mt, and IDHwt tumor samples were harvested and immediately frozen on dry ice and stored at −80°C. Tissue was digested in a lysis buffer (10 mM Tris pH 8.0, 5 mM EDTA, 200 mM NaCl, 0.2% SDS) with 30 μl proteinase K (20 mg/ml) and incubated at 55°C overnight. Lysates were brought to room temperature and incubated with 5 μL of RNase A solution (20 mg/ml) for 1 hour at 37 °C. An equal volume of buffered phenol:chloroform:isoamyl alcohol (25:24:1 ratio) was added and centrifuged at 16,000 xg at room temperature for 20 mins. Supernatant was transferred to clean tubes and 5 μl of 5 M NaCl, 2 μl Glycogen, and equal volume of 100% ethanol were added. After overnight incubation at −20°C, samples were centrifuged at 10,000 xg for 10 mins at 4°C, and the DNA pellet was washed in 70% ethanol twice. After all ethanol was removed, the DNA pellet was dissolved in nuclease-free water and incubated overnight at 4°C, before being quantified by Nanodrop.
Methylated DNA Immunoprecipitation (MeDIP)
3 μg of genomic DNA was fragmented to 300–400 base pairs using a Covaris focused-ultrasonicator Me220. DNA fragments were then subjected to end repair, A-tailing, adaptor ligation, and USER digestion using the NEBNext Ultra II DNA Library Prep kit for Illumina (New England BioLabs, Cat. E7645S). Following USER digestion and purification, DNA was denatured for 10 minutes at 95°C and immunoprecipitated overnight at 4°C with 4 μL of either 5mC antibody (Active Motif, Cat. 39649) or IgG antibody (Sigma, Cat. 12–371) in IP buffer (500 mM Tris-HCl, pH 7.4, 750 mM NaCl and 0.25% TritonX). The mixture was then incubated with Protein G coated Dynabeads (ThermoFisher, Cat. 10004D) for at least 2 hours at 4°C, washed with ice cold IP buffer, and finally washed in ice cold high salt IP buffer (IP buffer plus extra 300 mM NaCl). After the final washing, the beads were treated with 200 μL of digestion buffer (1X TE Buffer, pH 7.4, 0.25% SDS, 0.25% Proteinase K (2.5 mg/mL)) and shaken at 1000 rpm for 2 hours at 55°C. The methylated DNA was recovered by phenol:chloform:isoamyl alcohol (25:24:1) extraction, followed by precipitation in 3X volume of 100% ethanol, supplemented with 3 μL glycogen (5mg/mL) and 15 μL NaAC (pH 5.2), and then incubated overnight at −20°C. The next day, DNA was pelleted and washed with 75% ethanol and dissolved in nuclease-free water. Libraries were sequenced 2×150-bp on an Illumina HiSeq 2500 platform at a targeted depth of 30 million paired-end reads per sample.
5hmC capture
5hmC capture was performed according to the methods described in Kuehner et al, 2021 92. In brief, 5 μg of genomic DNA was fragmented to 300–400 base pairs through sonication and 5hmCs were glycosylated by T4 phage ß-glucosyltransferase enzyme and UDP-6-N3-glucose. The glycosylated fragments were purified with Ampure XP beads (BeckmanCoulter; Cat. A63881), biotinylated by click reaction with disulfide biotin, and pulled down with Dynabeads MyOne Streptavidin C1 beads (ThermoFisher; Cat. 65001). The 5hmC fragments were released from the beads using dithiothreitol and purified with Ampure XP beads for a final time. DNA fragments were eluted in nuclease-free water and quantified by Qubit. Libraries were sequenced 2×150-bp on an Illumina HiSeq 2500 platform at a targeted depth of 30 million paired-end reads per sample.
qPCR validation of 5hmC–enriched regions
5hmC-captured DNA products were used as templates in triplicate 20 μL qPCR reactions, which included 1x PerfeCTa SYBR Green FastMix, low ROX (QuantaBio; Cat. 95074), 0.25 μM forward and reverse primers, and nuclease-free water. The PCR cycling was performed on QuantStudioTM 3 System using Fast mode and the conditions were as follows: 95 °C 10 minutes, 40 cycles at 95 °C for 15 seconds, 60 °C for 1 minute. Fold enrichment was calculated as 2-dCt, where dCt = Ct (5-hmC enriched in IDH1-mutant group) – Ct (5-hmC enriched in IDHwt group). Primer sequences were designed using the Primer3 online tool and are provided in Supplementary Table 24.
Bulk RNA-seq data processing (hCO, GBM, and fetal astrocyte samples)
Fastq files were trimmed using the Trimmomatic software 93, reads were mapped to the GRCh38/hg38 reference genome using STAR aligner 94, and read summarization was carried out with the featureCounts software 95.
We confirmed immunopanned cell identity by correlating the expression of cell type-specific signatures (Supplementary Table 5) between our samples and a published primary human RNA-seq dataset.
Bulk ATAC-seq data processing (hCO and GBM astrocyte samples)
ATAC-seq file processing included the following steps: (1) Nextera adapters were trimmed using TrimGalore 96, (2) reads were mapped to the hg19 reference genome using Bowtie2 97, (3) mitochondrial and non-unique alignment reads were removed using Samtools 98, (4) PCR duplicates were removed with Picard tools 99, (5) black-listed reads were removed using Bedtools 100, and (6) peaks were called using MACS2 101 with the following parameters: shift −75 –extsize 150 –nomodel –call-summits –nolambda -p 0.01 -B –SPMR
Bam files were loaded into R for further analysis. We first used the ChrAccR (v0.9.17) R package’s setConfigElement function to remove low-coverage peaks (insertion count > 3 and removed peaks on the X and Y chromosomes). A quality check report was generated using the run_atac_qc function in the ChrAccR R package. ATAC-seq libraries were evaluated for nucleosomal-read periodicity in the fragment size distribution, high signal enrichment at transcription start sites (TSSs; TSS enrichment score > 6), and high peak signal with minimal noise around biologically-relevant regions in the genome.
Principal component analyses
Principal component analysis was performed using the getDimRedPlot function in the muRtools (v0.9.5) R package, using the first and second principal components.
Differential expression and differential accessibility
Differential expression (RNA-seq) and accessibility (ATAC-seq) analyses were performed in R using the DESeq2 package, accounting for sample pairing between tumor and margin samples (~ Patient + Tissue_type) 102. Prior to finding differentially accessible peaks, consensus peak sets were generated using the getConsensusPeakSet() function in the ChrAccR R package where peaks had to be consistently present across 75% of biological replicates within a group (IDHwt tumor or margin) to be retained. Differentially accessible peaks were visualized using the ggmaplot R package. Peaks and genes that had an FDR<0.05 and absolute log2FC>2 were deemed differentially expressed or accessible, respectively.
To see if specific genes were overrepresented in our differentially expressed gene sets, we implemented the testGeneOverlap() function in the GeneOverlap R package, which applies a Fisher’s Exact Test to check for significant association between sets of genes. The primary gene sets that we looked at were the top 1000 and top 100 fetal astrocyte-enriched genes and the top 1000 and top 100 adult astrocyte-enriched genes published in Zhang et al, 2016 (Supplementary Tables 5 and 7). Additionally, we also looked for overrepresentation of maturation WGCNA module genes (Supplementary Table 2) in several analyses.
Weighted gene co-expression network analysis (WGCNA)
Prior to running a WGCNA, we first performed a variance stabilizing transformation to normalize data across astrocyte maturation time points using the DESeq2 R package. We then subsetted the data to include the top 15% most variably expressed genes and peaks to focus on genes and regions of the genome that exhibit substantial changes. We performed a WGCNA using the WGCNA R package 103, with the guidance of the following tutorial: WGCNA Gene Correlation Network Analysis - Bioinformatics Workbook. To detect modules and construct a network, we used the blockwiseModule function in the WGCNA package with the following parameter settings: power = 12, networkType = “signed”, deepSplit = 2, minModuleSize = 200, maxBlockSize = 4000, reassignThreshold = 0, and mergeCutHeight = 0.325. The power parameter was determined by plotting mean connectivity across a range of soft thresholds (1–20) and the threshold value where mean connectivity begins to plateau was used. We used the moduleEigengenes function to calculate module eigengenes (which uses PC1) and associate gene and peak modules with various stages of maturation. Top module genes (Supplementary Table 18) were determined using the adjacency function in the WGCNA package, which we used to calculate gene network adjacency values and rank genes with the highest module connectivity.
Non-negative matrix factorization (NMF)
NMF was performed using the R package NMF (version 0.26) 104. Data was first cleaned to eliminate any genes from the matrix with 0 expression across all samples. NMF setting included rank = 3, method = “lee”, and 50 runs. The resulting coefficient matrix was used to identify the relevant modules. Overlap between NMF groups and WGCNA modules was visualized via Sankey plot using the plotly R package 105.
Bulk ATAC-seq motif analyses
Motif enrichment and occurrence values for the hCO astrocyte maturation timeline were generated using WGCNA ATAC peak sets (Supplementary Table 3).
For calculating TF motif enrichment, peak count matrices were RPKM normalized, log2 transformed, and quantile normalized. ChromVAR deviation scores were calculated with the getChromVarDev() function in the ChrAccR R package, using the JASPAR TF motif database, and motif deviation z-scores were plotted using the ComplexHeatmap R package 106.
Paired Expression and Chromatin Accessibility (PECA) analysis
We first binned our maturation time point data into three groups based on the results of the ATAC- and RNA-seq PCAs- early (d80–150), middle (d200–350), and late (d400–550). We did this by generating average gene expression values (TPM) for each developmental group and used Samtools to merge ATAC .bam files into a single file for each bin.
Using PECA2, we generated matrices for early, middle, and late groups and next ran the PECA network comparison algorithm, comparing between all possible maturation group combinations (early x middle, early x late, and middle x late). For each group-specific TF-TG network matrix, we (1) filtered for TF-TG networks with a fold change > 1.5, (2) filtered again for TF-TG pairs in which the TG belonged to a WGCNA maturation module gene, and (3) for each group, compiled a list of remaining TFs that were predicted to regulate at least 5 maturation TGs. This yielded a final list of 29 TF candidates (Supplementary Table 4) that we predict to regulate astrocyte maturation genes.
Comparing hCO dataset to published fetal data
Data from nuclei isolated from micro-dissected fetal cortical plate (CP) tissue (17–41 GW) published in Ramos et al. 2022 was obtained from the GEO database under accession code GSE217511 and further data processing was completed with the R program Seurat (version 4.3.0.1). Raw CP data was first filtered for nuclei that were included in the original publication by referencing the available Seurat post-filtering metadata on the GEO database. CP data was binned by host tissue age—17–20, 20–24, 24–28, and 32–39 GW—based on groupings included in the original publication. SCT transformation was then applied to binned CP data, which was then integrated using the Seurat function IntegrateLayers() to assess trends across developmental groups. CP data was subsetted for the Ramos et al-designated “AC”, “gIPC”, “OPC”, and “TAC” clusters for further comparisons with our hCO dataset. SCT-normalized data was used in generating UMAPs.
The log-normalized RNA assay was used to make featureplots for individual genes, as well as featureplots and violin plots of module scores, which were calculated using the AddModuleScore() Seurat function. For maturation module scores, plots were placed on the same scale based on the minimum and maximum module scores across all five maturation modules (min: −0.1047000, max: 0.4553764). Featureplots and violin plots were generated using the Seurat functions FeaturePlot() and VlnPlot(), respectively.
DEGs were determined for “AC” and “gIPC” clusters using the Seurat function FindMarkers() with the Wilcoxon Rank Sum test. The top 100 genes with the greatest FC and with a p.adj < 0.01 were used as reference gene sets to determine if “AC” and “gIPC” genes are expressed in hCO astrocytes. To determine the threshold for genes that are expressed in hCO astrocytes, we assessed the distribution of normalized signal and set a threshold of 100 TPM. We quantified the overlap in these gene sets using the ggvenn (ver 0.1.10) R package.
To correlate astrocyte-lineage signatures from the Ramos et al dataset with our hCO data, we first used the Seurat function AggregateExpression() to calculate pseudo-bulk counts for “AC” and “gIPC” clusters. We then subsetted pseudo-bulk AC and gIPC count matrices to include cluster-identifying genes, defined as the top 100 genes with the greatest FC and with a p.adj < 0.01 (see above). After also subsetting our hCO matrix to include top AC and gIPC genes, respectively, we performed spearman correlations.
Initial processing and analysis of single-nucleus multiome data
We first removed reads mapping to the mitochondrial genome, chromosome Y, and common blacklisted regions. We then used ArchR (v1.0.2) 107 to process fragment data and perform quality control analyses, dimensionality reduction, and clustering. Harmony batch correction was performed prior to unsupervised dimensionality reduction and clustering 108. We filtered out nuclei that had a TSS enrichment score <5, less than 3500 unique nuclear fragments, and those without matched RNA reads. Using the ArchR doublet detection tool (default parameters), we removed 2,683 doublets, leaving a total of 27,036 nuclei for further analyses. Remaining nuclei had a median TSS enrichment score of 10.96 and a median of 19,872 fragments per nucleus.
Identifying clusters and cell type assignments
We first used ArchR to generate gene activity scores, which are correlated with gene expression and calculated based on chromatin accessibility at gene body, promoter and distal regulatory regions 107, 109. We identified marker genes for each cluster using the ArchR getMarkerFeatures() function (filtering threshold: FDR≤0.01 & log2FC≥1) and assigned cluster names based on the enrichment of well-known CNS cell type markers. After excluding clusters that had less than 100 nuclei, we identified clusters representing 9 major CNS cell types (Supplementary Tables 15 and 16).
Inference of astrocyte maturation modules onto single-nucleus multiomic clusters
Maturation module enrichment was computed using the ArchR addModuleScore() function with geneScoreMatrix using the top 50 genes in each module (Supplementary Table 18).
Classifying neoplastic and non-neoplastic nuclei from single-nucleus RNA-seq data
We considered several factors when classifying nuclei as neoplastic or non-neoplastic: (1) expression of canonical tumor marker genes (ie EGFR, PDGFRA, NES, SOX2); (2) genomic location of copy number variations (CNV); and (3) correlation of CNV signature with parent tissue. Genome-wide large-scale chromosomal CNV score was estimated using the ‘inferCNV’ R package (v1.10.1) with the following parameters: cutoff of 0.1, myeloid lineage cells were used as a reference population, and all other parameters were set to the default 110. Using the inferCNV program we visualized overall CNV signal across the genome and identified concomitant amplification on chromosome 7 and loss on chromosome 10 for most astrocyte lineage cells derived from tumor tissue, a canonical CNV feature of GBMs (Extended Data Figure 7c). To discriminate between non-neoplastic margin astrocytes and neoplastic astrocyte lineage cells that infiltrated the margin region, we correlated the CNV profile of each nucleus with the mean CNV profile of nuclei derived from each individual tissue sample (eg Tumor patient 1, Tumor patient 2, Tumor patient 3, Margin patient 1, and Margin patient 2). Nuclei from tumor samples that exhibited CNV patterns indicative of GBM pathology (chr 7/10) and correlated (correlation coefficient > 0.4) with the majority of other tumor nuclei were classified as neoplastic. Additionally, nuclei from margin samples with CNV patterns that did not correlate (correlation coefficient < 0.4) with the other margin host nuclei were classified as neoplastic. We used a correlation coefficient cutoff of 0.4 because of the bimodal distribution that we observed when plotting these correlations across all nuclei (Extended Data Figure 7d-e).
snATAC-seq peak calling and TF motif deviations analysis
ArchR was used to call peaks with default parameters. Briefly, a pseudo-bulk dataset was created for the 2 main cell types- neoplastic and non-neoplastic astrocyte lineage cells. The reproducible peak sets were analyzed using addReproduciblePeakSet() with MACS2 111 with a fixed-width peak size of 501 bp and iterative overlap peak merging. The resulting PeakMatrix, with a total of 194,115 peaks, was used for TF deviation analysis with default parameter with ArchR’s addDeviationsMatrix() function. TFs with high correlation of motif accessibility can be identified based on the correlation of the inferred gene activation score to the motif deviation, thus identifying the known TFs in driving differences among neoplastic vs non-neoplastic lineages.
Identifying unique astrocyte chromatin and gene signatures based on molecular diagnoses for tumors
The ATAC-seq data consisting of 485,908 peaks, and RNA-seq counts data was normalized using the DESeq2 package. Features of interest (peaks for ATAC-seq and genes for RNA-seq data) that are unique to each group were identified using the ‘feature binarization’ method as outlined in Corces et al. 112. The group details for the 19 samples are shown in Supplementary Table 19.
Correlation of tumor sample-specific gene expression with astrocyte module enrichment (Fig. 5c) was performed by first calculating the top 200 variable genes across all tumor samples. These genes were used for hierarchical clustering of all tumor astrocyte samples (method = “Euclidean”) and the cutree function was used to categorize the genes into 3 major groups. Genes within each group were then labeled by their module assignment (ignored if they belonged to no module) for graphical display.
Spatial transcriptomics
Using our maturation gene modules, we evaluated spatial gene expression in two IDHwt samples that were included in Ravi et al. 2022, following their analysis pipeline.
5mC/5hmC analysis
Paired-end sequencing reads of MeDIP-seq library and 5hmC-capture-seq library were first mapped to human genome (hg38) using Bowtie 2 (2.4.4) 113 with “--no-mixed --no-discordant” parameters. To identify differential 5mC and 5hmC signal between IDH1mt and IDHwt samples, the human genome sequence was binned to 500 bp bins and reads of each sample were counted in each bin. Read counts were normalized to total mapped reads and bins with averages RC>20 in either IDH1mt or IDHwt groups were used for differential analysis by DESeq2 114. Significant differential 5mC regions were defined by FDR<0.05 whereas significant differential 5mC Regions were defined by FDR<0.001 and |logFC|>4. Differential 5mC and 5hmC regions were annotated to adjacent genes using HOMER 115. To compare gene body 5hmC levels, we used the human gene body coordinates (hg38) downloaded from UCSC Table, and counted gene body 5hmC reads for differential expression analysis using DESeq2. PCA analyses were conducted using the “factoextra” R package. We used ngs.plot and igvtools to compare global and loci-specific 5hmC signals between IDH1mt and IDHwt samples, respectively 116, 117.
Statistics and Reproducibility
Statistical analyses were performed using R. All statistical tests are documented in respective computational methods sections, including tests for normality to determine if parametric or nonparametric tests were appropriate. P values less than 0.05 were considered statistically significant (n is reported in the figure legends). For IHC analyses, data is from an n=4 biological replicates with 3 images for each replicate and condition (technical replicates). Representative images were randomly selected from this. Where possible with primary tissue samples, we included technical replicates, including for the following experiments: EdU quantification in fetal astrocytes treated with D2HG (Fig. 6j) and ASCL1 overexpression in fetal astrocytes (Extended Data Figure 6). For these experiments, we had 2–3 technical replicates per condition and biological replicate. Values for technical replicates were averaged prior to calculating ratios. Experiments were randomized and blinded, where possible. Given the sporadic nature and limited availability of primary tissue (GBM and fetal), this was not always possible, and no statistical method was used to predetermine sample size. Libraries were only excluded if sample quality was poor (detailed description of criteria in respective methods sections). All code and source data are available.
Extended Data
Extended Data Figure 1. iPSC and hCO karyotyping.

(a, b) KaryoStat+ analysis results of 2 hiPSC lines (C3 and C4) across multiple developmental stages (hiPSCs through day 821 in organoid culture). (a) Cell id correlation plot of all SNP calls. Correlations >95% between samples are considered having an identical genetic background (green boxes), correlations <95% indicate different genetic backgrounds (red boxes). (b) Whole genome view of copy number state for iPSC and organoid samples. Y-axis is the smoothing of the log2 ratios which depicts the signal intensities of probes on the microarray. CN = 2 is a normal copy number state, CN = 3 represents chromosomal gain, and CN = 1 represents chromosomal loss. Colors indicate the raw signal for each individual chromosome probe, while the blue signal represents the normalized probe signal.
Extended Data Figure 2. Additional maturation gene set comparisons.

(a) Heatmap showing expression of NMF module genes (rows) across hCO astrocyte time points (columns). (b) Sankey plot demonstrating the overlap between NMF and WGCNA modules. (c) Dot plots showing top GO terms associated with each maturation module.
Extended Data Figure 3. Additional comparisons with Ramos et al 2022 dataset.
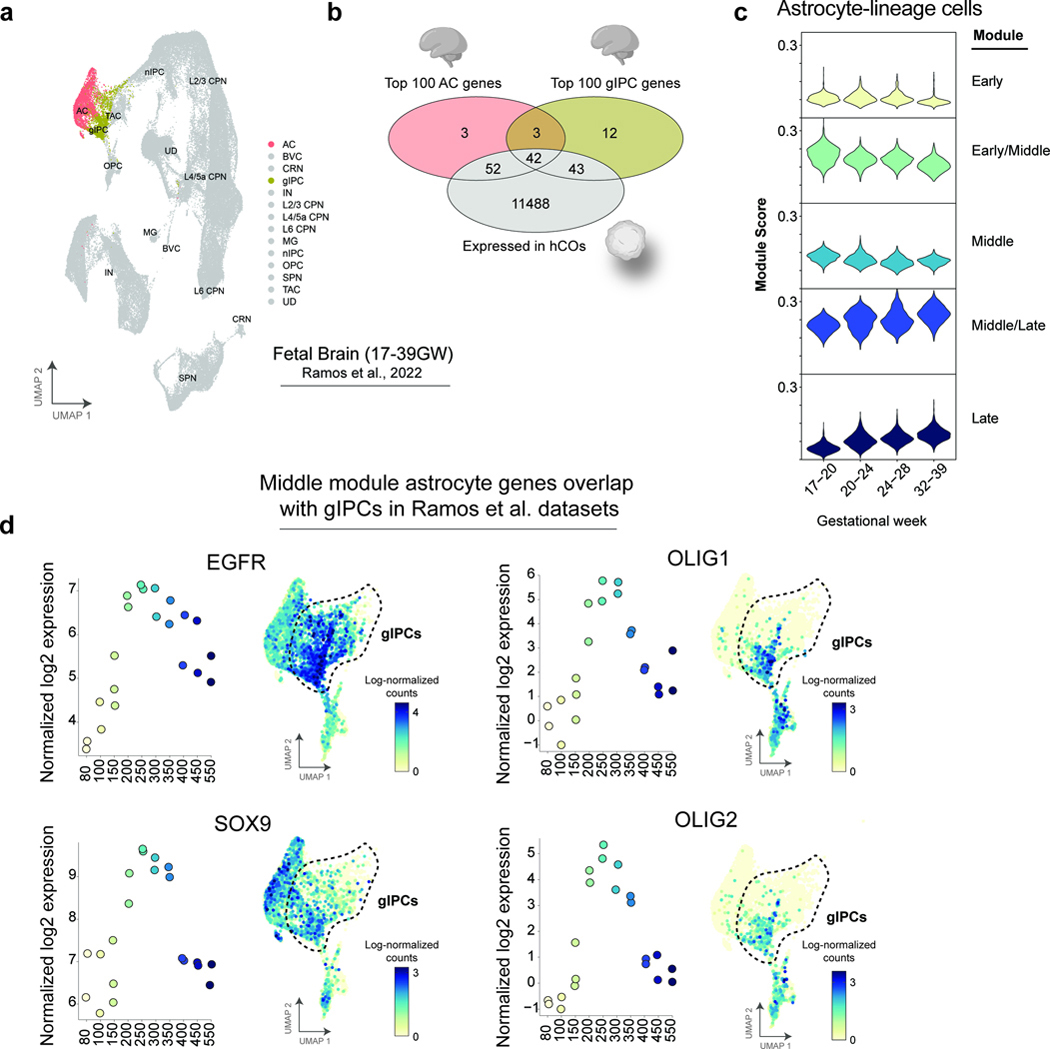
(a) UMAP of Ramos et al CP dataset with astrocyte (AC) and glial intermediate progenitor cell (gIPC) highlighted in red and yellow, respectively. (b) Venn diagram showing enrichment of AC and gIPC genes in hCO astrocytes. Expression in hCOs determined by normalized expression distribution with a cutoff of TPM > 100 (see methods). (c) Violin plots showing module scores for each maturation module in Ramos et al 2022 astrocyte lineage cells (AC + gIPC). (d) Dot plots and paired UMAPs showing expression of key gIPC genes (EGFR, OLIG1, OLIG2, SOX9) across hCO timeline (dot plots) and Ramos et al clusters (UMAPs). Dashed line on UMAP indicates border of gIPC population.
Extended Data Figure 4. Additional TF IHC.

(a-f) IHC with individual and merged channels showing expression of maturation TFs SOX21, OLIG2, and NR3C2 (cyan) with (a, b) GFAP (magenta) and (c-f) NFIA or SOX9 (yellow) in hCOs at (a, b, e, and f) d296 and (c, d) d131. Dashed white box indicates areas for zoom in (b, d). Scale bars are 50 um in (a, c, and e) and 12.5 um in (b, d, and f).
Extended Data Figure 5. Maturation TF functional relevance in hCOs.

(a) Schematic of experimental design with overexpression virus. (b) Fluorescent imaging of control (top) HEK cells and HEK cells transduced with ASCL1-inducible virus and treated with doxycycline for one week (bottom). (c) qPCR validation of ASCL1 expression in HEK cells transduced with ASCL1-inducible virus and treated with doxycycline, plus relevant controls. (d) FACS gating strategy to sort for GFP+ and GFP- hCO cells. (e) Fold change of ASCL1 expression in ASCL1/control conditions. Error bar represents standard deviation. (f) Log2 mean fold change (GFP+/GFP-) of 100 mature and fetal astrocyte genes and 100 neuronal genes with annotations for select markers. Solid black line indicates the mean. (g) Mean fold change of sample mature astrocyte genes in hCOs transduced with the ASCL1 (blue) and control (purple) viruses. **** p < 0.0001
Extended Data Figure 6. Maturation TF functional relevance in primary human fetal astrocytes.

(a) Schematic of overexpression ASCL1 overexpression paradigm in primary fetal astrocytes. (b) Fold change of ASCL1 expression in ASCL1/control conditions. Error bars represent standard deviation. (c) Mean fold change (GFP+/GFP-) of top 50 genes in each of the five maturation gene modules in fetal cells transduced with the ASCL1 (blue) and control (purple) viruses. **** p < 0.0001
Extended Data Figure 7. sn-multiome quality control and cell-type identification.
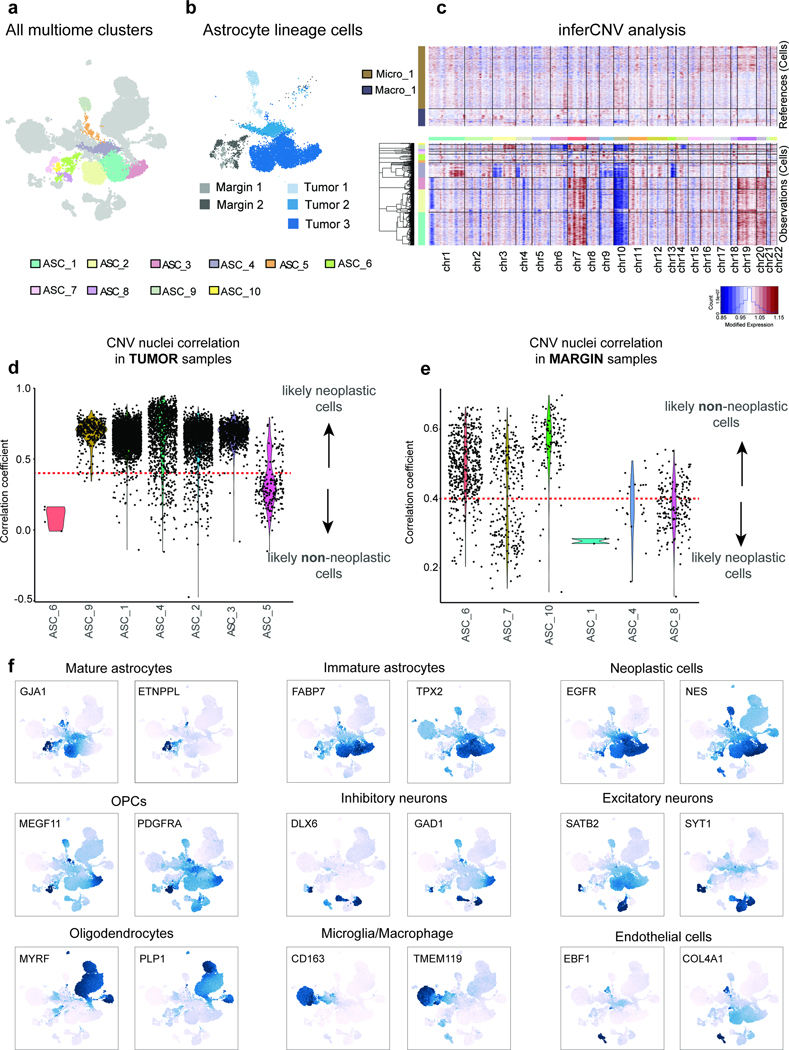
(a) UMAP of GBM single nuclei with clusters colored by cell type. (b) UMAP of astrocyte lineage clusters annotated by tissue source. Cells from margin tissue are gray and cells from tumor tissue are blue. (c) CNV analysis heatmap showing expression of genes on each chromosome (column annotation) for all astrocyte lineage cells (row annotation). (d, e) Violin plots showing distribution of nucleus vs host tissue correlation coefficients. (d) Correlations for nuclei from tumor host tissue. (e) Correlations for nuclei from margin host tissue. Red dashed line indicates correlation coefficient cutoff of 0.4 for assessing malignancy (see methods). (f) UMAPs showing gene activity score for cell type-specific markers.
Extended Data Figure 8. Gene expression comparisons across IDHwt, IDH1mt, and margin astrocyte lineage cells.

(a) RNA-seq heatmap showing gene signatures unique to astrocytes from tumors with various genomic diagnoses. Annotated with representative genes and enriched gene ontology terms. (b) Diverging bar plots of p-values for maturation module gene set enrichments in DEGs between IDHwt and IDH1mt tumor astrocytes (supplement to Fig. 5e). Bar color indicates maturation module. (c) Volcano plot showing DEGs between IDH1mt tumor (FDR<0.05; log2FC>2) and margin (FDR<0.05; log2FC<−2) astrocytes. DEGs colored in red. (d) Bar plots showing DEGs from Fig. S16c in mature (postnatal) and immature (fetal) astrocyte transcriptomic data 22. Values are mean log2CPM of the 747 margin and 146 tumor DEGs. *** P < 0.0005; ns, not significant, two-tailed student’s t-test. (e) Example mature DEGs upregulated in IDH1mt margin and downregulated in tumor astrocytes.
Extended Data Figure 9. 5mC and 5hmC quantification in IDH1mt and IDHwt tumors.
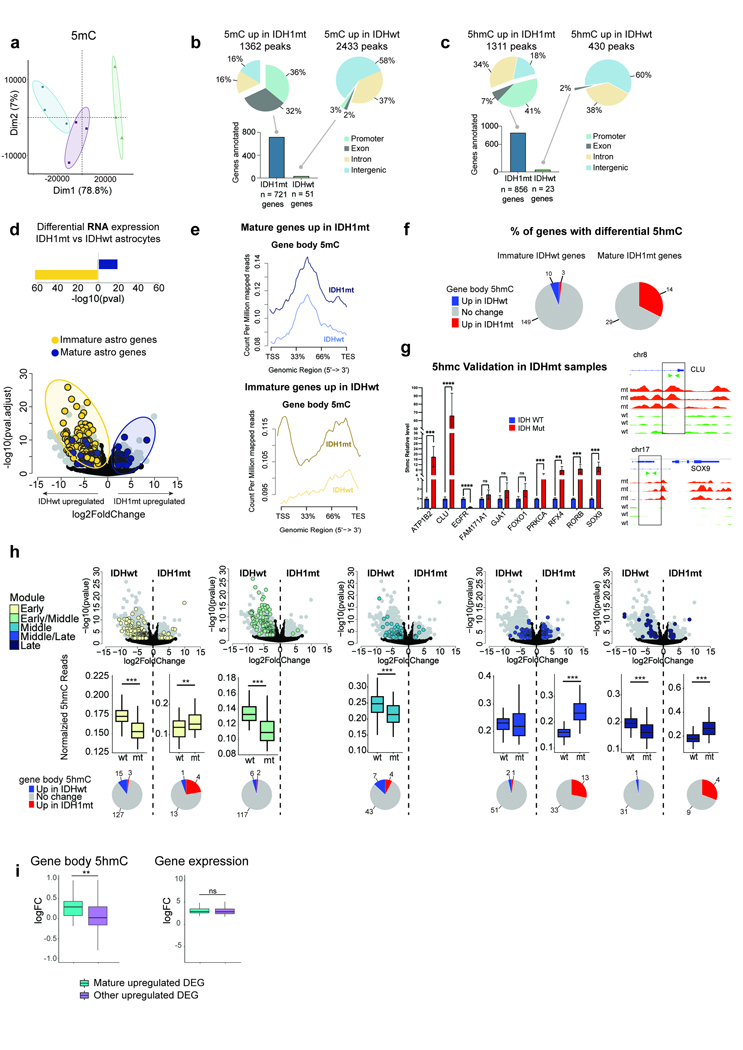
(a) PCA of 5mC data. (b, c) Pie charts of relative abundances of differentially (b) methylated regions and (c) hydroxymethylated regions across genomic features. Bar plots show number of genes that annotate to each differentially methylated/hydroxymethylated region. (d) Fig. 6f volcano with diverging bar plot quantifying representation of postnatal and fetal genes in IDHwt (fetal.pval= 4.8e-62, postnatal.pval= 0.92) and IDH1mt (fetal.pval= 0.99, postnatal.pval= 7.3e-19) DEGs. (e) NGS plots of gene body 5mC levels in IDH1mt and IDHwt for postnatal genes upregulated in IDH1mt astrocytes (left, purple) and fetal genes upregulated in IDHwt astrocytes (right, yellow). (f) Percent of genes with differential 5hmC in (left) fetal genes upregulated in IDHwt and (right) postnatal genes upregulated in IDH1mt. (g, left) 5hmC-Capture-qPCR validation for 10 developmental and oncogenic genes. Blue bars indicate relative 5hmC levels in IDHwt samples and red bars for IDH1mt samples. ns, not significant. (g, right) 5hmC levels for two representative genes included in 5hmC-Capture-qPCR, CLU (top) and SOX9 (bottom). 5hmC tracks for IDHwt samples in green and IDH1mt in red. (h, Top) Volcano plots from Fig 5e. (Middle) Box and whisker plots for each respective maturation module showing normalized gene body 5hmC for genes upregulated in IDHwt (left of dashed line) and for genes upregulated in IDH1mt (right of dashed line). No 5hmC data shown if fewer than 10 upregulated genes. (Bottom) Percent of genes with differential 5hmC. (i) Bar plots showing gene body 5hmC levels (left) and expression (right) in differentially expressed mature genes and all other DEGs. * if p.adj<0.01, ** if p.adj<0.001, *** if p.adj<0.0001
Extended Data Figure 10. Additional data on human fetal astrocyte exposure to D2HG.

(a) Brightfield images of CD49f+ cells exposed to three concentrations of D2HG (0.1, 0.5, and 1.0 mM) over a 48-hr period. (b) GFAP staining of CD49f+ cells exposed to low (0.1 mM) and high (1.0 mM) D2HG concentrations, and respective vehicle control concentrations. (c) CD49f+ cells stained for SOX21 (red) and DAPI (blue). (b, c) scale bars are 100 um. (d, e) Volcano plots showing DEGs (padj<0.05) for (d) CD49f+ cells that received normal media (no treatment) and media supplemented with 0.1% DMSO for 1 week. (e) DEGs between CD49f+ cells that received media supplemented with 0.1% DMSO and 0.1 mM D2HG for 1 week. DEGs that are upregulated in IDHwt and IDH1mt tumors (ref. Fig. 6f) are colored in red and blue, respectively. (f) Normalized expression for select genes in CD49f+ cells exposed to 0.1% DMSO and 0.1 mM D2HG for 1 week. Individual dots correspond to separate biological replicates.
Supplementary Material
ACKNOWLEDGMENTS
This study was supported by NIMH R01 MH125956 and NINDS R01 NS123562, the Sontag Foundation Distinguished Scholars Award, and a NARSAD Young Investigator Grant from the Brain & Behavior Research Foundation (SAS). Additionally, R01 ES027859 and P30ES019776 (VGC) and NIH F32 ES031827 (H-LW). VMR and KJ are supported by Deutsche Forschungsgemeinschaft (DFG) - MA 10605/1–1. We would like to thank Emilee Wehunt, Clinical Research Coordinator in Emory’s Department of Neurosurgery, for helping identify GBM surgical cases and obtain pathology results for tissue samples; Ke Yu, Tissue Procurement Lab Coordinator for Emory’s Winship Cancer Institute, for helping facilitate tissue sample procurement for the Sloan Lab; and Samantha Lanjewar and Maureen Sampson for help with fetal tissue dissociations. This research project was supported in part by the Emory University School of Medicine Flow Cytometry Core.
Footnotes
CODE AVAILABILITY
All scripts generated are available without restrictions upon request at the Sloan Lab Github (https://github.com/sloanlab-emory/sojka-et-al-2024).
COMPETING INTERESTS
The authors declare no competing interests. The funders had no role in study design, data collection and analysis, decision to publish or preparation of the manuscript.
DATA AVAILABILITY
The sequencing data that supports the findings of this study are publicly available through the Gene Expression Omnibus (GEO) under the following accession numbers: GSE276101 (ATAC-seq), GSE276102 (hMe-Seal-seq), GSE276103 (MeDIP-seq), GSE276176 (RNA-seq), and GSE276177 (sc-multiome).
REFERENCES
- 1.Aiello NM & Stanger BZ Echoes of the embryo: using the developmental biology toolkit to study cancer. Dis Model Mech 9, 105–114 (2016). [DOI] [PMC free article] [PubMed] [Google Scholar]
- 2.Garraway LA & Sellers WR Lineage dependency and lineage-survival oncogenes in human cancer. Nat Rev Cancer 6, 593–602 (2006). [DOI] [PubMed] [Google Scholar]
- 3.Filbin M & Monje M Developmental origins and emerging therapeutic opportunities for childhood cancer. Nat Med 25, 367–376 (2019). [DOI] [PMC free article] [PubMed] [Google Scholar]
- 4.Tirosh I et al. Single-cell RNA-seq supports a developmental hierarchy in human oligodendroglioma. Nature 539, 309–313 (2016). [DOI] [PMC free article] [PubMed] [Google Scholar]
- 5.Venteicher AS et al. Decoupling genetics, lineages, and microenvironment in IDH-mutant gliomas by single-cell RNA-seq. Science 355 (2017). [DOI] [PMC free article] [PubMed] [Google Scholar]
- 6.Dalerba P et al. Single-cell dissection of transcriptional heterogeneity in human colon tumors. Nat Biotechnol 29, 1120–1127 (2011). [DOI] [PMC free article] [PubMed] [Google Scholar]
- 7.Lawson DA et al. Single-cell analysis reveals a stem-cell program in human metastatic breast cancer cells. Nature 526, 131–135 (2015). [DOI] [PMC free article] [PubMed] [Google Scholar]
- 8.Ben-Porath I et al. An embryonic stem cell-like gene expression signature in poorly differentiated aggressive human tumors. Nat Genet 40, 499–507 (2008). [DOI] [PMC free article] [PubMed] [Google Scholar]
- 9.Weng Q et al. Single-Cell Transcriptomics Uncovers Glial Progenitor Diversity and Cell Fate Determinants during Development and Gliomagenesis. Cell Stem Cell 24, 707–723 e708 (2019). [DOI] [PMC free article] [PubMed] [Google Scholar]
- 10.Verhaak RG et al. Integrated genomic analysis identifies clinically relevant subtypes of glioblastoma characterized by abnormalities in PDGFRA, IDH1, EGFR, and NF1. Cancer Cell 17, 98–110 (2010). [DOI] [PMC free article] [PubMed] [Google Scholar]
- 11.Bhaduri A et al. Outer Radial Glia-like Cancer Stem Cells Contribute to Heterogeneity of Glioblastoma. Cell Stem Cell 26, 48–63 e46 (2020). [DOI] [PMC free article] [PubMed] [Google Scholar]
- 12.Neftel C et al. An Integrative Model of Cellular States, Plasticity, and Genetics for Glioblastoma. Cell 178, 835–849 e821 (2019). [DOI] [PMC free article] [PubMed] [Google Scholar]
- 13.Couturier CP et al. Single-cell RNA-seq reveals that glioblastoma recapitulates a normal neurodevelopmental hierarchy. Nat Commun 11, 3406 (2020). [DOI] [PMC free article] [PubMed] [Google Scholar]
- 14.Muller S et al. Single-cell sequencing maps gene expression to mutational phylogenies in PDGF- and EGF-driven gliomas. Mol Syst Biol 12, 889 (2016). [DOI] [PMC free article] [PubMed] [Google Scholar]
- 15.Patel AP et al. Single-cell RNA-seq highlights intratumoral heterogeneity in primary glioblastoma. Science 344, 1396–1401 (2014). [DOI] [PMC free article] [PubMed] [Google Scholar]
- 16.Venkataramani V et al. Glioblastoma hijacks neuronal mechanisms for brain invasion. Cell 185, 2899–2917 e2831 (2022). [DOI] [PubMed] [Google Scholar]
- 17.Molofsky AV et al. Astrocytes and disease: a neurodevelopmental perspective. Genes Dev 26, 891–907 (2012). [DOI] [PMC free article] [PubMed] [Google Scholar]
- 18.Akdemir ES, Huang AY & Deneen B Astrocytogenesis: where, when, and how. F1000Res 9 (2020). [DOI] [PMC free article] [PubMed] [Google Scholar]
- 19.Lattke M & Guillemot F Understanding astrocyte differentiation: Clinical relevance, technical challenges, and new opportunities in the omics era. WIREs Mech Dis 14, e1557 (2022). [DOI] [PMC free article] [PubMed] [Google Scholar]
- 20.Falcone C et al. Cortical Interlaminar Astrocytes Are Generated Prenatally, Mature Postnatally, and Express Unique Markers in Human and Nonhuman Primates. Cereb Cortex 31, 379–395 (2021). [DOI] [PMC free article] [PubMed] [Google Scholar]
- 21.Lattke M et al. Extensive transcriptional and chromatin changes underlie astrocyte maturation in vivo and in culture. Nat Commun 12, 4335 (2021). [DOI] [PMC free article] [PubMed] [Google Scholar]
- 22.Zhang Y et al. Purification and Characterization of Progenitor and Mature Human Astrocytes Reveals Transcriptional and Functional Differences with Mouse. Neuron 89, 37–53 (2016). [DOI] [PMC free article] [PubMed] [Google Scholar]
- 23.Trevino AE et al. Chromatin and gene-regulatory dynamics of the developing human cerebral cortex at single-cell resolution. Cell 184, 5053–5069 e5023 (2021). [DOI] [PubMed] [Google Scholar]
- 24.Cahoy JD et al. A transcriptome database for astrocytes, neurons, and oligodendrocytes: a new resource for understanding brain development and function. J Neurosci 28, 264–278 (2008). [DOI] [PMC free article] [PubMed] [Google Scholar]
- 25.Clavreul S, Dumas L & Loulier K Astrocyte development in the cerebral cortex: Complexity of their origin, genesis, and maturation. Front Neurosci 16, 916055 (2022). [DOI] [PMC free article] [PubMed] [Google Scholar]
- 26.Allen DE et al. Fate mapping of neural stem cell niches reveals distinct origins of human cortical astrocytes. Science 376, 1441–1446 (2022). [DOI] [PMC free article] [PubMed] [Google Scholar]
- 27.Molofsky AV & Deneen B Astrocyte development: A Guide for the Perplexed. Glia 63, 1320–1329 (2015). [DOI] [PubMed] [Google Scholar]
- 28.Bushong EA, Martone ME, Jones YZ & Ellisman MH Protoplasmic astrocytes in CA1 stratum radiatum occupy separate anatomical domains. J Neurosci 22, 183–192 (2002). [DOI] [PMC free article] [PubMed] [Google Scholar]
- 29.Yang Y, Higashimori H & Morel L Developmental maturation of astrocytes and pathogenesis of neurodevelopmental disorders. J Neurodev Disord 5, 22 (2013). [DOI] [PMC free article] [PubMed] [Google Scholar]
- 30.Stogsdill JA et al. Astrocytic neuroligins control astrocyte morphogenesis and synaptogenesis. Nature 551, 192–197 (2017). [DOI] [PMC free article] [PubMed] [Google Scholar]
- 31.Pasca AM et al. Functional cortical neurons and astrocytes from human pluripotent stem cells in 3D culture. Nat Methods 12, 671–678 (2015). [DOI] [PMC free article] [PubMed] [Google Scholar]
- 32.Camp JG et al. Human cerebral organoids recapitulate gene expression programs of fetal neocortex development. Proc Natl Acad Sci U S A 112, 15672–15677 (2015). [DOI] [PMC free article] [PubMed] [Google Scholar]
- 33.Sloan SA, Andersen J, Pasca AM, Birey F & Pasca SP Generation and assembly of human brain region-specific three-dimensional cultures. Nat Protoc 13, 2062–2085 (2018). [DOI] [PMC free article] [PubMed] [Google Scholar]
- 34.Sloan SA et al. Human Astrocyte Maturation Captured in 3D Cerebral Cortical Spheroids Derived from Pluripotent Stem Cells. Neuron 95, 779–790 e776 (2017). [DOI] [PMC free article] [PubMed] [Google Scholar]
- 35.Ramos SI et al. An atlas of late prenatal human neurodevelopment resolved by single-nucleus transcriptomics. Nat Commun 13, 7671 (2022). [DOI] [PMC free article] [PubMed] [Google Scholar]
- 36.Liu DD et al. Purification and characterization of human neural stem and progenitor cells. Cell 186, 1179–1194 e1115 (2023). [DOI] [PMC free article] [PubMed] [Google Scholar]
- 37.Wang L et al. Molecular and cellular dynamics of the developing human neocortex at single-cell resolution. bioRxiv, 2024.2001.2016.575956 (2024). [Google Scholar]
- 38.Yang L, Li Z, Liu G, Li X & Yang Z Developmental Origins of Human Cortical Oligodendrocytes and Astrocytes. Neurosci Bull 38, 47–68 (2022). [DOI] [PMC free article] [PubMed] [Google Scholar]
- 39.Trevino AE et al. Chromatin accessibility dynamics in a model of human forebrain development. Science 367 (2020). [DOI] [PMC free article] [PubMed] [Google Scholar]
- 40.Duren Z, Chen X, Jiang R, Wang Y & Wong WH Modeling gene regulation from paired expression and chromatin accessibility data. Proc Natl Acad Sci U S A 114, E4914–E4923 (2017). [DOI] [PMC free article] [PubMed] [Google Scholar]
- 41.Duren Z, Chen X, Xin J, Wang Y & Wong WH Time course regulatory analysis based on paired expression and chromatin accessibility data. Genome Res 30, 622–634 (2020). [DOI] [PMC free article] [PubMed] [Google Scholar]
- 42.Chen AF et al. NEAT-seq: simultaneous profiling of intra-nuclear proteins, chromatin accessibility and gene expression in single cells. Nat Methods 19, 547–553 (2022). [DOI] [PMC free article] [PubMed] [Google Scholar]
- 43.Lamparter D, Marbach D, Rueedi R, Bergmann S & Kutalik Z Genome-Wide Association between Transcription Factor Expression and Chromatin Accessibility Reveals Regulators of Chromatin Accessibility. PLoS Comput Biol 13, e1005311 (2017). [DOI] [PMC free article] [PubMed] [Google Scholar]
- 44.Henrik Heiland D et al. Tumor-associated reactive astrocytes aid the evolution of immunosuppressive environment in glioblastoma. Nat Commun 10, 2541 (2019). [DOI] [PMC free article] [PubMed] [Google Scholar]
- 45.Darmanis S et al. Single-Cell RNA-Seq Analysis of Infiltrating Neoplastic Cells at the Migrating Front of Human Glioblastoma. Cell Rep 21, 1399–1410 (2017). [DOI] [PMC free article] [PubMed] [Google Scholar]
- 46.Ruiz-Moreno C et al. Harmonized single-cell landscape, intercellular crosstalk and tumor architecture of glioblastoma. bioRxiv, 2022.2008.2027.505439 (2022). [Google Scholar]
- 47.Ravi VM et al. Spatially resolved multi-omics deciphers bidirectional tumor-host interdependence in glioblastoma. Cancer Cell 40, 639–655 e613 (2022). [DOI] [PubMed] [Google Scholar]
- 48.Hulleman E et al. A role for the transcription factor HEY1 in glioblastoma. J Cell Mol Med 13, 136–146 (2009). [DOI] [PMC free article] [PubMed] [Google Scholar]
- 49.Hui AB, Lo KW, Yin XL, Poon WS & Ng HK Detection of multiple gene amplifications in glioblastoma multiforme using array-based comparative genomic hybridization. Lab Invest 81, 717–723 (2001). [DOI] [PubMed] [Google Scholar]
- 50.Borgenvik A, Cancer M, Hutter S & Swartling FJ Targeting MYCN in Molecularly Defined Malignant Brain Tumors. Front Oncol 10, 626751 (2020). [DOI] [PMC free article] [PubMed] [Google Scholar]
- 51.Liu Y et al. Downregulation of Pax3 expression correlates with acquired GFAP expression during NSC differentiation towards astrocytes. FEBS Lett 585, 1014–1020 (2011). [DOI] [PubMed] [Google Scholar]
- 52.Su X et al. GFAP expression is regulated by Pax3 in brain glioma stem cells. Oncol Rep 36, 1277–1284 (2016). [DOI] [PubMed] [Google Scholar]
- 53.Xia L et al. PAX3 is overexpressed in human glioblastomas and critically regulates the tumorigenicity of glioma cells. Brain Res 1521, 68–78 (2013). [DOI] [PubMed] [Google Scholar]
- 54.Zhu H et al. Transcriptional Repression of p53 by PAX3 Contributes to Gliomagenesis and Differentiation of Glioma Stem Cells. Front Mol Neurosci 11, 187 (2018). [DOI] [PMC free article] [PubMed] [Google Scholar]
- 55.Suva ML et al. Reconstructing and reprogramming the tumor-propagating potential of glioblastoma stem-like cells. Cell 157, 580–594 (2014). [DOI] [PMC free article] [PubMed] [Google Scholar]
- 56.Azzarelli B, Miravalle L & Vidal R Immunolocalization of the oligodendrocyte transcription factor 1 (Olig1) in brain tumors. J Neuropathol Exp Neurol 63, 170–179 (2004). [DOI] [PubMed] [Google Scholar]
- 57.Ligon KL et al. The oligodendroglial lineage marker OLIG2 is universally expressed in diffuse gliomas. J Neuropathol Exp Neurol 63, 499–509 (2004). [DOI] [PubMed] [Google Scholar]
- 58.Horbinski C, Berger T, Packer RJ & Wen PY Clinical implications of the 2021 edition of the WHO classification of central nervous system tumours. Nat Rev Neurol 18, 515–529 (2022). [DOI] [PubMed] [Google Scholar]
- 59.Louis DN et al. The 2021 WHO Classification of Tumors of the Central Nervous System: a summary. Neuro Oncol 23, 1231–1251 (2021). [DOI] [PMC free article] [PubMed] [Google Scholar]
- 60.Kickingereder P et al. IDH mutation status is associated with a distinct hypoxia/angiogenesis transcriptome signature which is non-invasively predictable with rCBV imaging in human glioma. Sci Rep 5, 16238 (2015). [DOI] [PMC free article] [PubMed] [Google Scholar]
- 61.Bi J et al. Altered cellular metabolism in gliomas - an emerging landscape of actionable co-dependency targets. Nat Rev Cancer 20, 57–70 (2020). [DOI] [PubMed] [Google Scholar]
- 62.Berens ME et al. Multiscale, multimodal analysis of tumor heterogeneity in IDH1 mutant vs wild-type diffuse gliomas. PLoS One 14, e0219724 (2019). [DOI] [PMC free article] [PubMed] [Google Scholar]
- 63.Tateishi K, Wakimoto H & Cahill DP IDH1 Mutation and World Health Organization 2016 Diagnostic Criteria for Adult Diffuse Gliomas: Advances in Surgical Strategy. Neurosurgery 64, 134–138 (2017). [DOI] [PMC free article] [PubMed] [Google Scholar]
- 64.Sanson M et al. Isocitrate dehydrogenase 1 codon 132 mutation is an important prognostic biomarker in gliomas. J Clin Oncol 27, 4150–4154 (2009). [DOI] [PubMed] [Google Scholar]
- 65.Yan H et al. IDH1 and IDH2 mutations in gliomas. N Engl J Med 360, 765–773 (2009). [DOI] [PMC free article] [PubMed] [Google Scholar]
- 66.Dang L et al. Cancer-associated IDH1 mutations produce 2-hydroxyglutarate. Nature 462, 739–744 (2009). [DOI] [PMC free article] [PubMed] [Google Scholar]
- 67.Pastor WA, Aravind L & Rao A TETonic shift: biological roles of TET proteins in DNA demethylation and transcription. Nat Rev Mol Cell Biol 14, 341–356 (2013). [DOI] [PMC free article] [PubMed] [Google Scholar]
- 68.Xu W et al. Oncometabolite 2-hydroxyglutarate is a competitive inhibitor of alpha-ketoglutarate-dependent dioxygenases. Cancer Cell 19, 17–30 (2011). [DOI] [PMC free article] [PubMed] [Google Scholar]
- 69.Ito S et al. Role of Tet proteins in 5mC to 5hmC conversion, ES-cell self-renewal and inner cell mass specification. Nature 466, 1129–1133 (2010). [DOI] [PMC free article] [PubMed] [Google Scholar]
- 70.Tahiliani M et al. Conversion of 5-methylcytosine to 5-hydroxymethylcytosine in mammalian DNA by MLL partner TET1. Science 324, 930–935 (2009). [DOI] [PMC free article] [PubMed] [Google Scholar]
- 71.Kriaucionis S & Heintz N The nuclear DNA base 5-hydroxymethylcytosine is present in Purkinje neurons and the brain. Science 324, 929–930 (2009). [DOI] [PMC free article] [PubMed] [Google Scholar]
- 72.Turcan S et al. IDH1 mutation is sufficient to establish the glioma hypermethylator phenotype. Nature 483, 479–483 (2012). [DOI] [PMC free article] [PubMed] [Google Scholar]
- 73.Malta TM et al. Glioma CpG island methylator phenotype (G-CIMP): biological and clinical implications. Neuro Oncol 20, 608–620 (2018). [DOI] [PMC free article] [PubMed] [Google Scholar]
- 74.Priesterbach-Ackley LP et al. Brain tumour diagnostics using a DNA methylation-based classifier as a diagnostic support tool. Neuropathol Appl Neurobiol 46, 478–492 (2020). [DOI] [PMC free article] [PubMed] [Google Scholar]
- 75.Jaunmuktane Z et al. Methylation array profiling of adult brain tumours: diagnostic outcomes in a large, single centre. Acta Neuropathol Commun 7, 24 (2019). [DOI] [PMC free article] [PubMed] [Google Scholar]
- 76.Zhou J et al. Dual lineage origins of neocortical astrocytes. bioRxiv, 2023.2009.2012.557313 (2023). [Google Scholar]
- 77.Elbaz B & Popko B Molecular Control of Oligodendrocyte Development. Trends Neurosci 42, 263–277 (2019). [DOI] [PMC free article] [PubMed] [Google Scholar]
- 78.Kuhn S, Gritti L, Crooks D & Dombrowski Y Oligodendrocytes in Development, Myelin Generation and Beyond. Cells 8 (2019). [DOI] [PMC free article] [PubMed] [Google Scholar]
- 79.Darmanis S et al. A survey of human brain transcriptome diversity at the single cell level. Proc Natl Acad Sci U S A 112, 7285–7290 (2015). [DOI] [PMC free article] [PubMed] [Google Scholar]
- 80.Siletti K et al. Transcriptomic diversity of cell types across the adult human brain. Science 382, eadd7046 (2023). [DOI] [PubMed] [Google Scholar]
- 81.Dirkse A et al. Stem cell-associated heterogeneity in Glioblastoma results from intrinsic tumor plasticity shaped by the microenvironment. Nat Commun 10, 1787 (2019). [DOI] [PMC free article] [PubMed] [Google Scholar]
- 82.Pine AR et al. Tumor Microenvironment Is Critical for the Maintenance of Cellular States Found in Primary Glioblastomas. Cancer Discov 10, 964–979 (2020). [DOI] [PMC free article] [PubMed] [Google Scholar]
- 83.Parsons DW et al. An integrated genomic analysis of human glioblastoma multiforme. Science 321, 1807–1812 (2008). [DOI] [PMC free article] [PubMed] [Google Scholar]
- 84.Huang LE Friend or foe-IDH1 mutations in glioma 10 years on. Carcinogenesis 40, 1299–1307 (2019). [DOI] [PMC free article] [PubMed] [Google Scholar]
- 85.Chaligne R et al. Epigenetic encoding, heritability and plasticity of glioma transcriptional cell states. Nat Genet 53, 1469–1479 (2021). [DOI] [PMC free article] [PubMed] [Google Scholar]
- 86.Venneti S et al. Clinical efficacy of ONC201 in H3K27M-mutant diffuse midline gliomas is driven by disruption of integrated metabolic and epigenetic pathways. Cancer Discov (2023). [DOI] [PMC free article] [PubMed] [Google Scholar]
- 87.Sachdeva R et al. BMP signaling mediates glioma stem cell quiescence and confers treatment resistance in glioblastoma. Sci Rep 9, 14569 (2019). [DOI] [PMC free article] [PubMed] [Google Scholar]
- 88.Bhat KPL et al. Mesenchymal differentiation mediated by NF-kappaB promotes radiation resistance in glioblastoma. Cancer Cell 24, 331–346 (2013). [DOI] [PMC free article] [PubMed] [Google Scholar]
- 89.Prager BC, Bhargava S, Mahadev V, Hubert CG & Rich JN Glioblastoma Stem Cells: Driving Resilience through Chaos. Trends Cancer 6, 223–235 (2020). [DOI] [PMC free article] [PubMed] [Google Scholar]
METHODS-ONLY REFERENCES
- 90.Corces MR et al. An improved ATAC-seq protocol reduces background and enables interrogation of frozen tissues. Nat Methods 14, 959–962 (2017). [DOI] [PMC free article] [PubMed] [Google Scholar]
- 91.Ryan Corces WJG, Howard Y Chang Isolation of nuclei from frozen tissue for ATAC-seq and other epigenomic assays. (2019). [Google Scholar]
- 92.Kuehner JN et al. 5-hydroxymethylcytosine is dynamically regulated during forebrain organoid development and aberrantly altered in Alzheimer’s disease. Cell Reports 35, 109042 (2021). [DOI] [PMC free article] [PubMed] [Google Scholar]
- 93.Bolger AM, Lohse M & Usadel B Trimmomatic: a flexible trimmer for Illumina sequence data. Bioinformatics 30, 2114–2120 (2014). [DOI] [PMC free article] [PubMed] [Google Scholar]
- 94.Dobin A et al. STAR: ultrafast universal RNA-seq aligner. Bioinformatics 29, 15–21 (2013). [DOI] [PMC free article] [PubMed] [Google Scholar]
- 95.Liao Y, Smyth GK & Shi W featureCounts: an efficient general purpose program for assigning sequence reads to genomic features. Bioinformatics 30, 923–930 (2014). [DOI] [PubMed] [Google Scholar]
- 96.Felix Krueger FJ, Phil Ewels, Ebrahim Afyounian, Michael Weinstein, Benjamin Schuster-Boeckler, Gert Hulselmans, sclamons, Edn. v0.6.10 ( [Google Scholar]
- 97.Langmead B & Salzberg SL Fast gapped-read alignment with Bowtie 2. Nat Methods 9, 357–359 (2012). [DOI] [PMC free article] [PubMed] [Google Scholar]
- 98.Li H et al. The Sequence Alignment/Map format and SAMtools. Bioinformatics 25, 2078–2079 (2009). [DOI] [PMC free article] [PubMed] [Google Scholar]
- 99.Institute, B. (Broad Institute, GitHub repository. [Google Scholar]
- 100.Quinlan AR & Hall IM BEDTools: a flexible suite of utilities for comparing genomic features. Bioinformatics 26, 841–842 (2010). [DOI] [PMC free article] [PubMed] [Google Scholar]
- 101.Zhang Y et al. Model-based analysis of ChIP-Seq (MACS). Genome Biol 9, R137 (2008). [DOI] [PMC free article] [PubMed] [Google Scholar]
- 102.Love MI, Huber W & Anders S Moderated estimation of fold change and dispersion for RNA-seq data with DESeq2. Genome Biol 15, 550 (2014). [DOI] [PMC free article] [PubMed] [Google Scholar]
- 103.Langfelder P & Horvath S WGCNA: an R package for weighted correlation network analysis. BMC Bioinformatics 9, 559 (2008). [DOI] [PMC free article] [PubMed] [Google Scholar]
- 104.Gaujoux R & Seoighe C A flexible R package for nonnegative matrix factorization. BMC Bioinformatics 11, 367 (2010). [DOI] [PMC free article] [PubMed] [Google Scholar]
- 105.Sievert C Interactive Web-Based Data Visualization with R, plotly, and shiny. Chapman and Hall/CRC (2020). [Google Scholar]
- 106.Gu Z, Eils R & Schlesner M Complex heatmaps reveal patterns and correlations in multidimensional genomic data. Bioinformatics 32, 2847–2849 (2016). [DOI] [PubMed] [Google Scholar]
- 107.Granja JM et al. ArchR is a scalable software package for integrative single-cell chromatin accessibility analysis. Nat Genet 53, 403–411 (2021). [DOI] [PMC free article] [PubMed] [Google Scholar]
- 108.Korsunsky I et al. Fast, sensitive and accurate integration of single-cell data with Harmony. Nat Methods 16, 1289–1296 (2019). [DOI] [PMC free article] [PubMed] [Google Scholar]
- 109.Granja JM et al. Single-cell multiomic analysis identifies regulatory programs in mixed-phenotype acute leukemia. Nat Biotechnol 37, 1458–1465 (2019). [DOI] [PMC free article] [PubMed] [Google Scholar]
- 110.Timothy Tickle IT, Christophe Georgescu, Maxwell Brown, Brian Haas (Klarman Cell Observatory, Broad Institute of MIT and Harvard, Cambridge, MA, USA; 2019). [Google Scholar]
- 111.Liu T Use model-based Analysis of ChIP-Seq (MACS) to analyze short reads generated by sequencing protein-DNA interactions in embryonic stem cells. Methods in molecular biology (Clifton, N.J.) 1150, 81–95 (2014). [DOI] [PubMed] [Google Scholar]
- 112.Corces MR et al. Single-cell epigenomic analyses implicate candidate causal variants at inherited risk loci for Alzheimer’s and Parkinson’s diseases. Nat Genet 52, 1158–1168 (2020). [DOI] [PMC free article] [PubMed] [Google Scholar]
- 113.Langmead B & Salzberg SL Fast gapped-read alignment with Bowtie 2. Nature Methods 9, 357–359 (2012). [DOI] [PMC free article] [PubMed] [Google Scholar]
- 114.Love MI, Huber W & Anders S Moderated estimation of fold change and dispersion for RNA-seq data with DESeq2. Genome Biology 15 (2014). [DOI] [PMC free article] [PubMed] [Google Scholar]
- 115.Heinz S et al. Simple Combinations of Lineage-Determining Transcription Factors Prime cis-Regulatory Elements Required for Macrophage and B Cell Identities. Molecular Cell 38, 576–589 (2010). [DOI] [PMC free article] [PubMed] [Google Scholar]
- 116.Shen L, Shao N, Liu X & Nestler E ngs.plot: Quick mining and visualization of next-generation sequencing data by integrating genomic databases. BMC Genomics 15, 284 (2014). [DOI] [PMC free article] [PubMed] [Google Scholar]
- 117.Robinson JT et al. Integrative genomics viewer. Nature Biotechnology 29, 24–26 (2011). [DOI] [PMC free article] [PubMed] [Google Scholar]
Associated Data
This section collects any data citations, data availability statements, or supplementary materials included in this article.
Supplementary Materials
Data Availability Statement
The sequencing data that supports the findings of this study are publicly available through the Gene Expression Omnibus (GEO) under the following accession numbers: GSE276101 (ATAC-seq), GSE276102 (hMe-Seal-seq), GSE276103 (MeDIP-seq), GSE276176 (RNA-seq), and GSE276177 (sc-multiome).