

ABSTRACT
The majority of previous research on neural correlates of consciousness (NCC) have used the visual system as a model. However, to what extent reported findings generalize to other sensory modalities has not been comprehensively investigated. To fill this gap we directly compared visual and auditory NCCs by testing the same group of participants with two analogous procedures. Participants were presented with near‐threshold visual and auditory stimuli followed by a detection task and Perceptual Awareness Scale (PAS). On the behavioral level, as expected from visual awareness studies, PAS ratings were highly correlated with accuracy in the detection task. Analysis of EEG data revealed that analogous ERP components—early visual or auditory awareness negativity (VAN and AAN) were related to perceptual awareness, but regarding late positivity (LP), it was related to perceptual awareness only in the visual modality. Further, we found that VAN and visual LP exhibited shorter latencies than respective auditory components suggesting earlier access of visual stimuli to consciousness, compared to auditory ones. Finally, neither estimated perceptual thresholds nor amplitudes and latencies of the awareness‐related ERPs components were correlated between modalities, suggesting a lack of a close link between visual and auditory perceptual mechanisms. Therefore, the observed differences between visual and auditory modalities indicate the investigated NCC are rather modality‐specific, and thus that neither of the proposed measures track consciousness independently to the content‐related processing.
Keywords: auditory awareness negativity, awareness, late positivity, perception, visual awareness negativity
Impact Statement
By comparing event‐related potentials (ERPs) for consciousness in both modalities, this study broadens the scope of neural correlates of consciousness (NCCs) beyond vision, advancing, our understanding of sensory‐specific and shared processes. It reveals distinct spatial and temporal differences between visual and auditory modalities, challenging the generalizability of visual NCCs to other senses. The study underscores the importance of exploring consciousness across multiple senses, offering a more compressive perspective that could inform future consciousness research and theory development.
1. Introduction
Identifying the neural mechanisms of perceptual awareness involves investigating when and where specific brain processes transform incoming sensory information into a subjective perceptual experience (Crick and Koch 2003; Lutz and Thompson 2003). Previous electrophysiological studies aimed to uncover the mechanism of this transformation by contrasting neural responses to aware and unaware stimuli (e.g., trials when a stimulus was seen and unseen, respectively; Koivisto and Grassini 2016; Koivisto and Revonsuo 2010; Lamme 2006). Based on this line of research, two event‐related potential (ERP) components have been proposed as primary candidates for the neural correlates of consciousness (NCC; review: Förster et al. 2020). First, visual awareness negativity (VAN) which is a negative amplitude difference between aware and unaware trials observed around 150–350 ms post‐stimulus in occipito‐parietal areas (e.g., Andersen et al. 2016; Derda et al. 2019; Hurme et al. 2017; Förster et al. 2020). VAN is thought to reflect the early, recurrent processing within the ventral visual stream and constitute a mechanism of the phenomenal aspect of consciousness (Förster et al. 2020; Koivisto and Revonsuo 2010; Tagliabue et al. 2016). Thus, it is typically interpreted in the context of (and thought to provide support for) Recurrent Processing Theory (RPT; Lamme 2006). The second component is late positivity (LP), which is a positive amplitude difference in the P3b time window (which peaks around 350 ms after stimulus onset) observed with a centro‐parietal topography (Rutiku et al. 2015; Salti et al. 2012). LP is thought to reflect global recurrent processing within the fronto‐parietal network, in line with the mechanism of conscious access as assumed by the Global Neuronal Workspace Theory (GNWT; Dehaene and Changeux 2005; Dehaene et al. 2003, 2006; Dehaene and Naccache 2001). It should be noted, however, that studies supporting VAN as NCC typically also observe neural activity in the LP time window but argue it reflects certain post‐perceptual processes, such as decision‐making or reporting, rather than consciousness per se (Förster et al. 2020). In a similar manner, proponents of the late NCC interpret VAN observed in their studies as reflecting early perceptual or attentional mechanisms (i.e., prerequisites of consciousness), rather than the mechanisms of consciousness itself (Bola and Doradzińska 2021; Doradzińska and Bola 2024; Del Cul et al. 2007; Lamy et al. 2009; Salti et al. 2012).
The majority of electrophysiological studies that investigated perceptual consciousness and its mechanisms focused exclusively on the visual modality. Only more recently has the need to study other sensory modalities been recognized and discussed in the context of NCC research (Eklund et al. 2020; Eklund and Wiens 2019; Filimonov et al. 2022; Orłowski and Bola 2023; Snyder et al. 2015). Contrasting electrophysiological responses between audible and inaudible stimuli (for review see: Dykstra et al. 2017; Snyder et al. 2015) led to the identification of the Auditory Awareness Negativity as a marker of auditory perceptual awareness (AAN; Eklund et al. 2020; Eklund and Wiens 2019; Filimonov et al. 2022). Preliminary evidence indicates that AAN is observed in a similar time window as VAN (i.e., around 200 ms after stimulus onset) but with a different topography (i.e., temporal and central electrodes, thus over the auditory sensory cortex). Identifying AAN has been interpreted as evidence that conscious experience relies on mechanisms that are modality‐specific, but analogous and highly comparable among modalities (Dykstra et al. 2017; Eklund and Wiens 2019). Accordingly, the term Perceptual Awareness Negativity (PAN) has been proposed to refer to the family of early negative ERP correlates of awareness found in different modalities (Dembski et al. 2021). However, the LP component—occurring around 300–400 ms after stimulus onset with a centro‐parietal scalp topography (Eklund et al. 2020; Eklund and Wiens 2019; Filimonov et al. 2022)‐has also been observed as NCC in auditory perception studies. Thus, the fact that LP exhibits similar timing and topography in both visual and auditory modalities can be, in turn, interpreted as evidence for a modality‐independent mechanism of consciousness.
Vision is considered to play a dominant role in daily life and, accordingly, is the most well‐studied sensory modality (for review see: Hutmacher 2019). However, since sensory modalities differ in terms of anatomy, information coding, and functional roles (Hutmacher 2019; Rauschecker 2015), revealing how mechanisms of awareness operate in each modality will be crucial for a better understanding of consciousness on both perceptual and neural levels. Further, elucidating whether mechanisms of awareness are modality‐specific or rather modality‐independent will have important implications for verifying (and falsifying) existing theories of consciousness. Up till now, comparing NCC observed in different modalities has involved data collected by separate EEG studies, typically using different methods and conducted in distinct samples of participants. Thus, what seems particularly needed are direct comparisons between NCC of different modalities, identified using analogous procedures on the same group of participants. So far, such comparison for vision and audition has been conducted only by Filimonov et al. (2022) who reported that both modality‐specific VAN and AAN, and LP are correlates of conscious perception. In the case of LP, its early part was modality‐specific (i.e., the latency and scalp distribution were different between modalities) and the later part contained both modality‐general and modality‐specific features. However, the experimental procedure in this study consisted of randomly presented visual, auditory, or binomial conditions after which participants had to rate their subjective awareness using a 3‐point scale, which was later dichotomized into aware and unaware conditions. The mixed presentation may have thus resulted in greater similarity between ERP patterns evoked by both modalities. Hence, in our study, each modality was tested in a separate session with both objective and subjective measures used to assess participants' perceptual experience of stimuli. By conducting isolated sessions, our method provides a clearer and more reliable assessment of the neural correlates of perceptual experience in each sensory system.
The dichotomization of subjective scale into aware and unaware conditions taps into yet another research problem, that so far has been predominantly investigated in the visual modality, that is, the question of whether perceptual awareness is dichotomous (Del Cul et al. 2007; Sekar et al. 2013; Sergent and Dehaene 2004) or differs gradually across various levels (Overgaard et al. 2006; Pretorius et al. 2016; Ramsøy and Overgaard 2004; Seth et al. 2008). Notably, while previous experiments (e.g., Eklund et al. 2020; Eklund and Wiens 2019; Filimonov et al. 2022) contrasted ERPs observed in “aware” and “unaware” conditions, addressing the “dichotomous or graded” question requires capturing the potential intermediate awareness experiences by employing measures that introduce intermediate categories like “brief glimpse” or “almost clear experience”. Typically, a four‐point Perceptual Awareness Scale (PAS; Ramsøy and Overgaard 2004) is considered the most exhaustive measure, capturing degrees of visual awareness and demonstrating a correlation between performance and awareness (Pretorius et al. 2016; Sandberg et al. 2010). There were several previous attempts to characterize the relationship between PAS ratings and early and late ERP components' amplitudes (e.g., Derda et al. 2019; Jimenez et al. 2018) but, to the best of our knowledge, no prior study has systematically investigated this relationship in both visual and auditory modalities.
Therefore, the present study aimed to characterize the early (VAN, AAN) and late (LP) electrophysiological correlates of consciousness and compare them directly between sensory modalities. To this end, we used analogous experimental procedures in the same group of participants. The procedures were based on previous work by Eklund and Wiens (2018, 2019), but included an additional detection task and replaced a 3‐point awareness scale with a more common 4‐point PAS measure (see Section 2). Specifically, participants were presented with near‐threshold visual (Gabor patches) and auditory (simple tones) stimuli, performed a detection task, and rated their subjective awareness with PAS on a trial‐by‐trial basis. We identified early and late NCC and investigated their relation to objective and subjective awareness measures. Further, we characterized the visual and auditory NCC in terms of spatial and temporal features and compared them between modalities. Finally, we investigated whether perceptual capabilities and the observed NCC are related to sensory modalities at the intra‐individual level.
2. Materials & Methods
2.1. Participants
Data from 38 participants were analyzed (28 females; age: M = 23.42, SD = 4.16, range = [18, 39]). Data from 7 additional participants were collected but excluded due to technical problems with EEG recordings (2 participants) and due to an insufficient number of trials left after preprocessing (< 50% of the trials; 5 participants). The inclusion criteria were no history of neurological or neuropsychiatric disorders, no hearing problems, and normal or corrected‐to‐normal vision. The sample size was not predetermined but we aimed to collect a sample that was larger than in previous EEG studies on the ERP correlates of auditory and visual awareness (i.e., over 35 participants; Eklund et al. 2019, 2020, 2021; Eklund and Wiens 2019; Filimonov et al. 2022). Each participant performed two experimental procedures (visual and auditory) on two separate days. The experimental sessions were conducted one to 9 days apart (M = 3.5, SD = 2.78) and their order was counterbalanced between participants.
All experimental procedures were approved by the Ethics Committee of the Institute of Psychology, Jagiellonian University (KE/30_2021). Procedures were in accordance with the tenets of the Declaration of Helsinki (Holm 2013). All participants gave written informed consent prior to the experimental session and were compensated for their time (80 PLN = ca. 20 EUR).
2.2. Apparatus
The experimental procedures were written in PsychoPy 2020.2.10 (Peirce 2007) and presented on a 23.8‐in. HP EliteDisplay E243i monitor (60 Hz refresh rate and 1920 × 1080 mpx resolution), with the viewing distance set to 60 cm. A Cedrus Button Box (RB‐840; Cedrus Corporation, San Pedro, CA) with eight buttons was used to collect behavioral responses. Data collection took place in a room adapted for electroencephalographic studies.
2.3. Stimuli
In the visual procedure, the target stimulus was a Gabor patch, the contrast of which was determined for each participant individually (by a staircase procedure, see below). The Gabors' patch size was 128 × 128 pixels, which translated into 3.3° × 3.3° of visual angle, its spatial frequency was 1.5 cycles/degree, phase was 1, and it was presented in the centre of the screen. The Gabor patch was presented vertically (0° rotation from the vertical angle) in every trial.
In the auditory procedure, the target stimulus was a 100 ms tone (f = 1000 Hz, 5 ms fade‐in and fade‐out) presented binaurally through headphones (Audio‐Technica ATH‐M50×). The volume level at the experimental computer was controlled and was always set to the same baseline level for each participant.
Each procedure consisted of three types of stimuli presentation: critical trials, in which a Gabor patch or a tone was presented at participants' individual awareness threshold (as calculated in the staircase procedure, see below); control trials, in which a stimulus with the opacity/volume set to 50% above the calibrated threshold level was presented; and catch trials, in which no Gabor patch/tone was presented.
2.4. Experimental Procedure
Each trial started with a central presentation of a white fixation dot (4 × 4 pixels) which stayed on screen for the whole duration of the trial. In both procedures, for critical and control trials, a stimulus was presented 500 ms from the trial onset, the Gabor patch stayed on screen for 33 ms, and tone was presented for 100 ms. For the catch trials, no stimulus was presented, but the duration of the trial was the same (i.e., the fixation dot was presented alone, with no Gabor patch or tone). Participants were instructed that the stimulus may be presented or not. After the stimulus offset the fixation dot remained on‐screen for an additional 500 ms after which participants were presented with two questions, the order of which was the same in every trial. First, participants were asked to indicate whether they saw/heard the stimulus in a given trial (detection task) and answered by pressing one of two response pad keys representing the possible answers. Second, participants rated subjective visibility/audibility of the stimulus using the PAS (Ramsøy and Overgaard 2004; Sandberg et al. 2010). The question was formulated as “How clear was your experience of the stimulus?” and was answered on a four‐point scale: “No experience” (1), “Brief glimpse” (2), “Almost clear experience” (3), and “Absolutely clear experience” (4). The answer was provided by pressing one of four buttons that were marked on a Button Box as four numbers assigned to the possible ratings. A uniform gray background was maintained during each procedure. All responses were self‐paced (i.e., there was no time limit). Figure 1 shows the time course of a trial.
FIGURE 1.
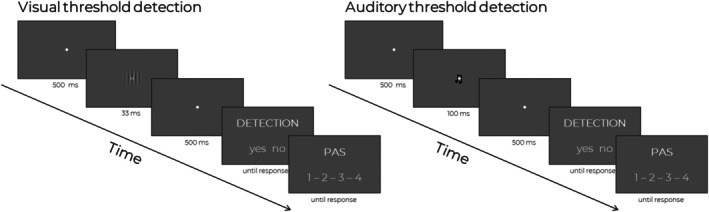
Schematic presentation of experimental trials included in visual and auditory procedures.
Each experimental session started with signing relevant documents, verbal instructions, and EEG preparation, which took around 30 min. An on‐screen instruction was presented, which emphasized that participants were to always maintain their gaze on the fixation dot when it was presented, and avoid making eye movements and blinks. Next, each participant completed a staircase (calibration) procedure (~6 min, 100 trials in the visual procedure, 70 trials in the auditory procedure), which was introduced to individually adjust the Gabor patch contrast/the tone volume to reach ~50% of correct responses in the detection task (PAS questions were not included in the staircase procedure). A “1‐up 1‐down” procedure was used, with the initial opacity of the stimulus defined as 0.05 (i.e., 5% of the maximum opacity) for each participant, and the step size defined as [0.006, 0.006, 0.005] in the visual procedure, and 0.01 starting volume (i.e., 1% of the maximum volume) and step sizes defined as [0.002, 0.001, 0.001, 0.0005, 0.0005, 0.0001, 0.0001] in the auditory part. The mean opacity/volume of the last 40 trials was used as the stimulus opacity/volume in the main procedure.
After completing the staircase procedure, participants were presented with a short training session (~3 min, 16 trials, PAS was included). After completing the training session, the main part of the study began. The trials were divided into 20 blocks of 30 trials each, with a break of unrestricted duration between blocks (participants were instructed to press a button to proceed). The procedure consisted of 400 critical trials, 100 control trials, and 100 catch trials. For each participant, the order of critical, control, and catch trials was randomized within each block. The duration of a single experimental session was approximately 1.5 h.
2.5. EEG Recording and Preprocessing
The EEG signal was recorded at 2048 Hz sampling rate with a BioSemi ActiveTwo amplifier system (BioSemi, Amsterdam, NL) with 64 active Ag/AgCl electrodes located according to the 10–20 system (Homan et al. 1987). The offset values of all electrodes were kept between −20 and 20 mV. In addition, blinks and vertical eye‐movements were monitored by four facial electrodes placed on the outer canthi and above and under the left eye.
The preprocessing and artifact rejection were executed using the custom‐made script in Python 3.9.13 with MNE‐Python version 1.0.3 (Gramfort et al. 2013). The EEG and EOG signals were down‐sampled to 512 Hz, and all EEG channels were re‐referenced to the average of the scalp channels. Next, continuous data was filtered with 0.1 Hz high‐pass and 40 Hz low‐pass settings (−6 dB cutoff) using a zero‐phase FIR filter with a Hamming window (filter() method of Raw object in MNE package; Widmann et al. 2015). Further, data were visually inspected to remove noisy channels (M = 1.04, SD = 1.33, range = [0, 5] in the auditory procedure and M = 1.09, SD = 1.66, range = [0, 6] in the visual procedure). The removed channels were interpolated using the MNE interpolate_bads() function with default parameters. Blink correction was achieved with ICA used on continuous data by correlating eye movement components with EOG channels. Components with a correlation coefficient that exceeded 3 standard deviations from the mean were removed (number of removed components in the visual procedure: M = 3.16, SD = 1.41, range = [2, 8]; in the auditory procedure: M = 3.24, SD = 1.24, range = [2, 7]). The data were segmented into stimulus‐locked epochs, from −200 ms before to 550 ms after stimulus onset. Each epoch was baseline corrected to the mean of the 200 ms interval before stimulus onset (−200–0 ms). Epochs in which the peak‐to‐peak amplitude exceeded a 150 μV threshold were removed from the data. Further analysis was performed on M = 379.11, SD = 58.86 (range = [229, 400]) epochs from the auditory procedure (out of 400 critical trials), and on M = 389.53, SD = 44.71 (range = [306, 400]) from the visual procedure (out of 400 critical trials).
Based on the results of previous work (Eklund et al. 2019; Eklund and Wiens 2018, 2019; Förster et al. 2020; Koivisto and Revonsuo 2010) we focused on three ERP components: VAN, AAN, and LP. Grand‐average ERP waveforms and topographic maps were created (i.e., by averaging over all conditions and participants—see Figure S1) to identify these components in the spatial and temporal domains. Based on the inspection of these grand‐averages, the following spatio‐temporal windows were defined: VAN was defined as activity occurring 180–350 ms after the stimulus onset at the occipito‐parietal location (PO7, PO8, O2, O1, PO3, PO4); AAN as activity occurring within 210–330 ms after stimulus onset at the centro‐parietal location (C1, C3, C5, FC3, CP3, C2, C4, C6, FC4, CP4); LP in the visual procedure as amplitude calculated for the 250–450 ms time window after stimulus presentation; LP in the auditory procedure as activity occurring 300–500 ms after the stimulus onset. LP was calculated from the fronto‐central location (Cz, FCz, C1, C2, FC1, FC2) for both modalities. Of note, VAN, AAN, and LP are typically calculated as the difference waves between conscious and unconscious trials (e.g., Eklund and Wiens 2018, 2019). Still, since we aimed to investigate the relation between early and late NCCs, and objective and subjective task performance, ERP components were calculated as the average amplitudes within the defined time‐windows (i.e., the N2 and P3 components time‐windows, which in the majority of previous studies coincided with VAN/AAN and LP defined as differential components). Such a procedure was also performed in previous studies that analyzed the relationship between PAS ratings and VAN and LP amplitudes (e.g., Derda et al. 2019; Jimenez et al. 2018; Doradzińska and Bola 2024). The get_peak() function in MNE Python was used for further ERP components' latency analysis. This function finds the strongest peak looking across all selected channels and time‐windows. For latency analysis, we calculated a difference wave—for each participant for critical trials—by subtracting unaware trials (PAS = 1) from aware trials (PAS > 1). This was done to directly compare latencies of early and late ERP components between modalities without investigating their relation with PAS ratings. Here, the same electrodes and time‐windows as for the amplitude analysis were used. For early VAN and AAN components, the get_peak() function finds the peak with a negative voltage (ignored positive voltages), and for late LPs, it finds the peak with a positive voltage (ignored negative voltages). The function was unable to estimate the latency for 1 participant (due to the inability to find local peaks); thus, this participant was excluded from the analysis.
2.6. Data Analysis
Statistical data analysis was conducted using custom‐made scripts in R Studio (version 2022.07.1; Bates et al. 2014; R Core Team 2015). Sensitivity (d’) and response bias (c) were calculated using psycho package (Makowski 2018). Accuracy was analyzed with Generalized Linear Mixed‐Effects Models (GLMMs, glmer function used), which is the appropriate model for predicting binary outcomes using standard (0/1) contrast coding. For sensitivity, response bias, PAS ratings, and ERP components Linear Mixed‐Effects Models (LMMs, lmer function) were used. LMMs and GLMMs were computed with the lme4 package (Bates et al. 2014). The lmerTest package (Kuznetsova et al. 2017) was applied to obtain p values for fixed effects in the mixed‐effects regression models. For visualization of results packages ggplot2 (Wickham 2011), ggeffects (Lüdecke 2018), and ggiraphExtra (Moon 2017) were used. Post hoc tests with pairwise comparisons of the EMMs (estimated marginal means) were performed with the emmeans (Lenth 2016) using a false discovery rate (FDR) to correct for multiple testing (Benjamini and Hochberg 1995). Effects with p < 0.05 are reported as significant.
First, two Signal Detection Theory (SDT; Stanislaw and Todorov 1999) measures—sensitivity (d’, i.e., the dependent variable) and response bias (c, i.e., the dependent variable)—were calculated for all trial types (i.e., critical, control and catch) and LMMs analysis was performed to verify whether they are different between modalities and PAS ratings (i.e., the independent variables). All further analyses (behavioral and ERP) were conducted on data from critical trials only (as previously done by Eklund et al. 2019, 2020; Eklund and Wiens 2018, 2019). We checked whether accuracy and PAS ratings (used here as the dependent variables) differ between sensory modalities (i.e., the independent variable). Because PAS rating 4 was very rare—only around 1% of critical trials in each procedure (see Table S1)—PAS ratings 3 and 4 were combined for all analyses (in all figures and tables PAS = 3 represents both PAS = 3 and 4). In LMMs analysis modality was coded as a two‐level factor, accuracy with a standard 0/1 coding, and PAS rating was defined as continuous numeric parameter. Treating PAS ratings as a continuous variable is in line with previous studies (Derda et al. 2019; Wierzchoń et al. 2014).
In the ERP components analysis, we first aimed to verify whether modality, accuracy, and PAS ratings (i.e., the variables of interest) differentiate early and late ERP components' amplitudes (i.e., the dependent variables). In the LMMs analyses, VAN and AAN components are named Perceptual Awareness Negativity (PAN), and late components from visual and auditory procedures are named late positivity (LP). We decided to create models for both types of components on data combined from the visual and auditory procedures to directly compare results between modalities. In each ERP model, the modality variable was treated as a fixed factor. ERP components' amplitudes were defined as numeric variables, accuracy as a 0/1 factor, PAS ratings were specified as ordered factors with levels from 1 to 3 (as we were interested in changes of ERP components' amplitude for different PAS ratings), and modality as a factor variable (with 2 levels). Next, we analyzed the latency of PAN and LP components. In LMMs for latency analysis, ERP components were defined as numeric variables and modality as a two‐level factor variable. All models' formulas (for both behavioral and EEG data) are presented in Supporting Information, Section 2.
As the last step, we performed a Bayesian correlation analysis between 10 variables: amplitude and latency of all ERP components (VAN, AAN, and LPs), and visual and auditory individual thresholds (i.e., opacities of Gabor patches and volumes of tones calculated in the staircase procedure‐see Section 2). Because the data were collected from the same participants, correlation analyses allowed us to investigate the relationship both within and between modalities. Bayesian correlation analysis was chosen to assess the strength of evidence for both the presence and absence of a relationship between variables. Considering that the analysis of correlations of perceptual and neural measures between modalities was conducted in an exploratory manner, the Bayesian approach was most relevant and appropriate. Bayesian correlations were calculated in the JASP software (version 0.18.1; JASP Team 2024).
3. Results
3.1. Behavioral Results
Descriptive statistics indicate that in the auditory procedure, the critical stimuli were presented around the perceptual threshold, as participants rated 47% of them as consciously perceived (Table 1). However, in the visual procedure, participants were aware of the critical Gabor patch stimuli in only 39% of trials. Further, in both procedures, participants were aware of the majority of above‐threshold stimuli in control trials, but rarely reported awareness in the stimulus‐absent catch trials, which indicates that participants were accurately using the PAS scale ratings.
TABLE 1.
Descriptive statistics of behavioral data from Aware trials are those rated as 2 or 3 on PAS, and unaware trials are those rated as 1.
| Auditory procedure | Visual procedure | |||
|---|---|---|---|---|
| M | SD | M | SD | |
| Critical aware | 48.05% | 4.90% | 36.67% | 4.70% |
| Critical unaware | 51.95% | 4.90% | 63.43% | 4.70% |
| Control hits | 99.00% | 1.00% | 99.00% | 0.90% |
| Catch false alarms (FA) | 4.00% | 2.00% | 1.00% | 1.10% |
Additionally, distributions of PAS ratings show that in both visual and auditory procedures, participants reported no experience or weak experience of the presented threshold stimuli in the majority of all trials (Figure 2A). Further, the detection task accuracy was related to PAS estimates, in a way that below chance‐level accuracy was observed in trials in which participants reported not hearing or seeing a stimulus (i.e., PAS = 1), whereas higher, above chance‐level accuracy was related to higher PAS ratings (Figure 2B). For plots presenting critical, control, and catch trials separately, see Figure S1.
FIGURE 2.
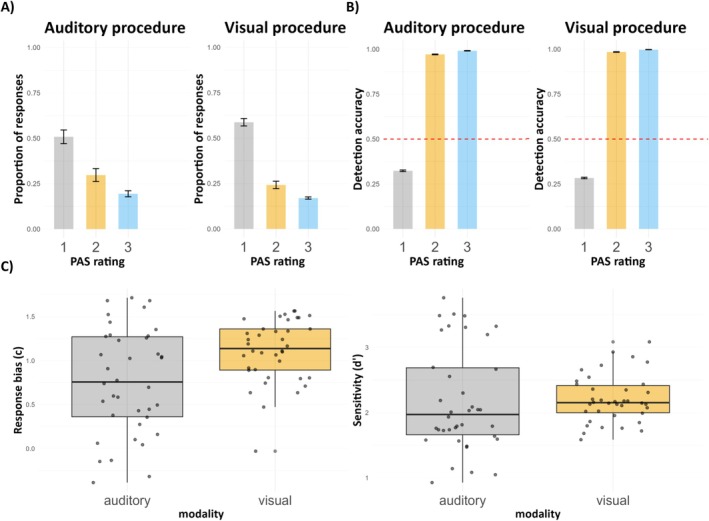
(A) Distribution of PAS ratings in the auditory and visual procedures (for critical, control and catch trials). (B) The relationship between the detection task accuracy and PAS ratings for each procedure (for critical, control and catch trials). Red dotted lines represent the 50% chance level. (C) c (response bias) and d’ (sensitivity) values obtained in the detection task. The lower and upper hinges of the boxplots correspond to the 25% and 75% quartiles; the thick horizontal line indicates the median. Whiskers extend to the lowest/largest value and the dots represent the individual values of participants.
3.2. SDT Measures: Dependence on the Sensory Modality and PAS
To explore the effects of PAS ratings and modality on c and d’ we fitted LMMs including PAS ratings (3 levels), modality (2 levels), and their interaction as fixed effects with random slope for modality and participant‐specific random intercept (Tables S2 and S3). Results for c measure showed that the intercept was significant (t(511.00) = 25.77, p < 0.001; i.e., > 0). The response bias was more negative for PAS 2 and PAS 3 (for auditory modality, t(511.00) = −30.73, p < 0.001; t(511.00) = −33.70, p < 0.001, respectively) compared to the intercept (PAS 1, auditory modality). There were no significant effects of visual modality (for PAS 1), the interactions between visual modality with PAS 2, and the interaction between visual modality with PAS 3 compared to the intercept (with p > 0.05).
Results for d’ measure indicated that the intercept was not significant (t(511.00) = −0.23, p = 0.817; i.e., not different from 0). The sensitivity was more positive for PAS 2 and PAS 3 (for auditory modality, t(511.00) = 3.76, p < 0.001; t(511.00) = 7.15, p < 0.001, respectively). However, the effects of visual modality (for PAS 1), the interactions between visual modality with PAS 2, and the interaction between visual modality with PAS 3 were not significant compared to the intercept (with p > 0.05).
Results of the post hoc contrasts for both c and d’ are depicted in Figure 3. In conclusion, there were no differences in response bias and sensitivity between visual and auditory modalities. Importantly, only for PAS 1 rating, in both auditory and visual conditions, the d’ value was not significantly different from zero. Additionally, the impact of PAS ratings on both c and d’ was consistent across modalities where the higher the PAS rating the lower the response bias and the higher the sensitivity.
FIGURE 3.
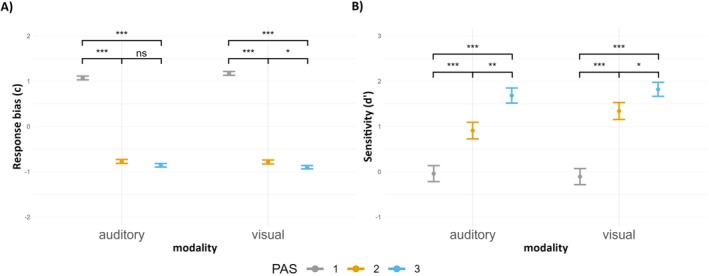
(A) Mean response bias (c) and (B) mean sensitivity (d’) depending on the PAS ratings and sensory modality. Error bars represent SEs. Significance level: ***p < 0.001, **p < 0.01, *p < 0.05.
3.3. Accuracy Between Sensory Modalities
A GLMM with modality (2 levels) as a fixed effect, random modality slope, and a participant‐specific random intercept was fitted to predict changes in accuracy (Table S4). The model showed that accuracy in the auditory (intercept) condition did not differ from the chance level (z = −0.54, p = 0.586) and that in the visual modality, the accuracy did not significantly differ compared to the intercept (z = −1.30, p = 0.219). The analysis thus did not find evidence for a difference in the objective task performance across modalities (see Figure 4A).
FIGURE 4.
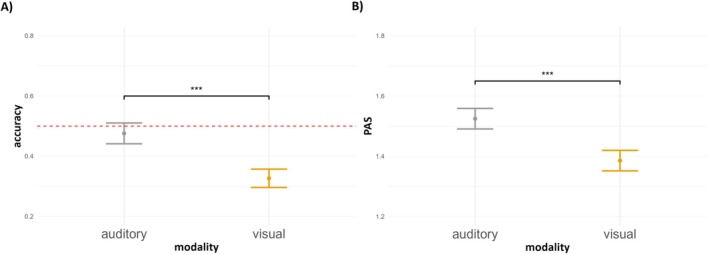
(A) Mean detection task accuracy and (B) mean PAS rating depending on the modality. Error bars represent SEs. Significance level: ns p > 0.05. Red dotted lines represent the 50% chance level in detection task accuracy.
3.4. PAS Ratings Between Sensory Modalities
To investigate PAS ratings, a LMM was fitted with modality (2 levels) as a fixed effect, random modality slope, and a random intercept for participants (Table S5). We found that the intercept was significant (auditory modality, t(38.01) = 22.45, p < 0.001). PAS ratings in the visual modality did not significantly differ from the intercept (t(37.99) = −1.64, p = 0.108). In conclusion, collected data indicate no differences in subjective perception between the sensory modalities (see Figure 4B).
3.5. EEG Results
3.5.1. Scalp Topographies and ERP Components Plots
Scalp topographies divided by PAS ratings in each modality (critical trials only) are shown in Figure 5 (for the mean activity for critical trials in each modality see Figure S2, topoplots divided by hits (i.e., critical trials where participants responded that they saw/heard the stimulus) and misses (i.e., critical trials where participants responded that they did not saw/heard the stimulus) from SDT in each modality can be found in Figure S3). ERP components from the chosen electrodes (for critical trials) are shown in Figure 6 (ERP waveforms from control and catch trials can be found in Figures S4 and S5). In both modalities negative peaks around 200 ms post‐stimulus and positive peaks around or after 300 ms were observed.
FIGURE 5.
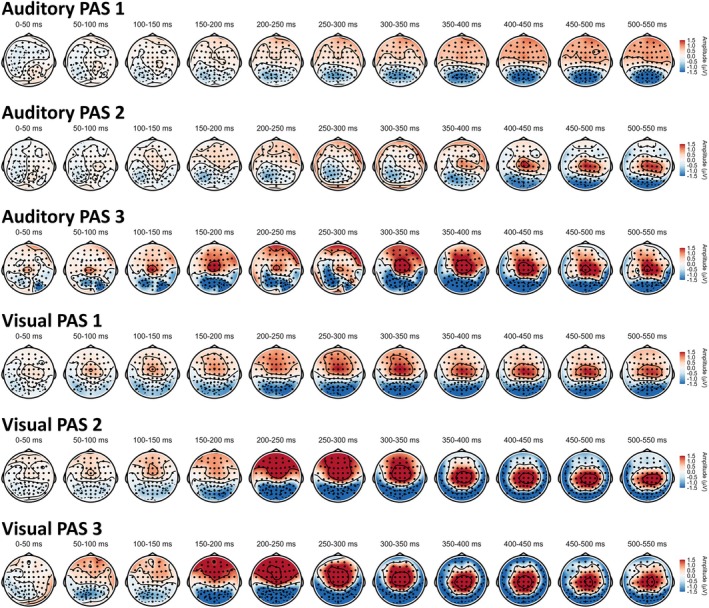
Scalp topographies from critical trials divided by procedures (i.e., modalities) and PAS ratings. Colors represent amplitudes from −1.5 to +1.5 μV.
FIGURE 6.
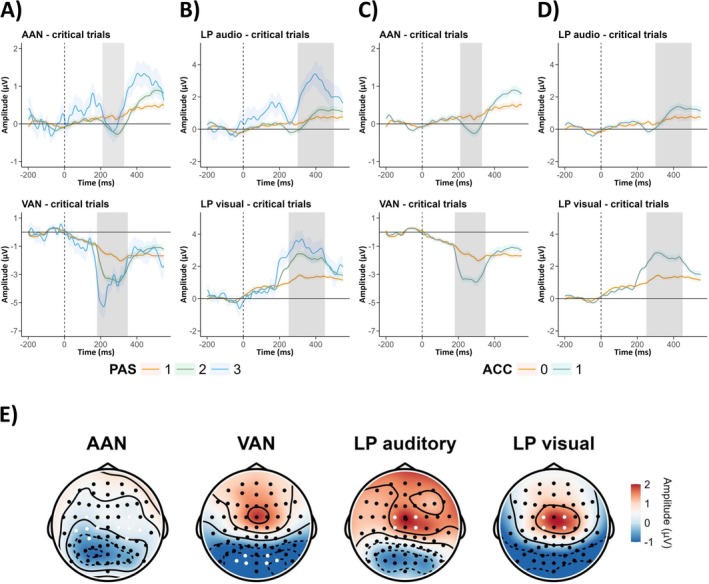
ERP waveforms from critical trials divided by PAS ratings for (A) auditory and (B) visual procedures, and divided by detection task accuracy for (C) auditory and (D) visual procedures. (E) Topoplots in selected time‐windows and electrodes chosen for statistical analyses (highlighted in white) for each component: AAN component was measured at C1, C3, C5, FC3, CP3, C2, C4, C6, FC4, CP4; VAN at PO7, PO8, O2, O1, PO3, PO4 channels; LP in auditory and in visual procedures at Cz, FCz, C1, C2, FC1, FC2 channels. Colored ribbons indicate 95% CI. The gray vertical area represents the time window selected for analysis of each component: AAN: 210–330 ms, VAN: 180–350 ms, LP audio: 300–500 ms, LP visual: 250–450 ms. Timepoint “0 ms” indicates the moment of the stimuli presentation. Topoplots' colors represent amplitudes from −1 to +2 μV.
3.5.2. Early ERP Components: Dependence on the Sensory Modality and Accuracy
In order to verify the relation between detection accuracy and early PAN components we fitted a LMM including modality (2 levels), accuracy (2 levels), and their interaction as fixed effects with random modality slope and participant‐specific random intercept (Table S6). We found that the intercept was significant (incorrect answers, auditory modality; t(49.99) = 2.18, p = 0.034). The analysis indicated that the amplitude of the early component was more negative for correct answers (in the auditory modality; t(2396.11) = −3.88, p < 0.001), in the visual modality (for incorrect answers; t(40.80) = −9.25, p < 0.001), and for the interaction between visual modality and correct answers (t(6213.87) = −12.88, p < 0.001), compared to the intercept. Contrast analysis has also indicated a significant difference in PAN amplitudes between accuracy conditions for both sensory domains (see Figure 7A). Overall, a more pronounced early negative component was observed in the visual modality than in the auditory modality. However, for both visual and auditory procedures, the amplitudes of the early components were more negative for correct than incorrect answers.
FIGURE 7.
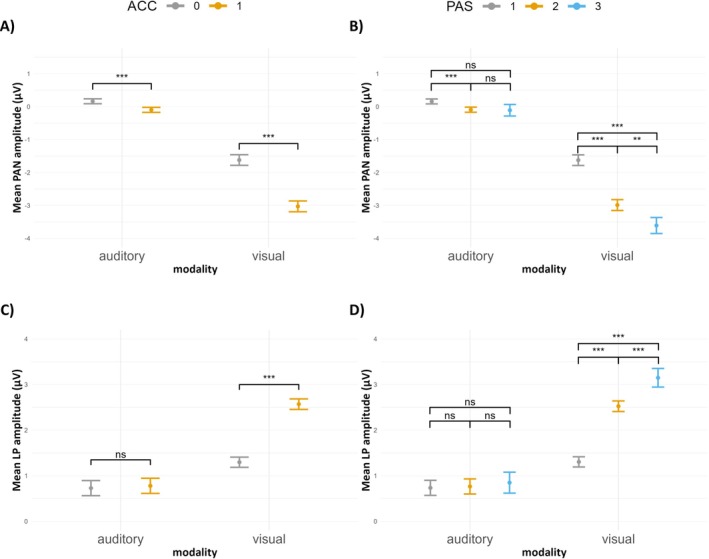
(A) Mean early components amplitudes depending on the sensory modality and accuracy in the detection task. (B) Mean early components amplitudes depending on the modality and PAS ratings. (C) Mean late components amplitudes depending on the sensory modality and accuracy in the detection task. (D) Mean late components amplitudes depending on the sensory modality and PAS ratings. Error bars represent SEs, asterisks indicate significance levels: ***p < 0.001, **p < 0.01, *p < 0.05, ns p > 0.05.
3.5.3. Early ERP Components: Dependence on the Sensory Modality and PAS
To explore the effects of PAS for each modality on early components, we fitted a LMM including modality (2 levels), PAS ratings (3 levels), and their interaction as fixed effects with a random modality slope and participant‐specific random intercept (Table S7). Results showed that the intercept was significant (PAS 1, auditory modality; t(49.66) = 2.11, p = 0.040). The average amplitude of early components was more negative for PAS 2 (in the auditory modality; t(2568.79) = −3.67, p < 0.001) compared to the intercept condition (i.e., PAS 1, auditory modality). For PAS 3 (in the auditory modality; t(1247.20) = −1.53, p = 0.127), the amplitude of the early ERP component was not significantly different from the intercept. For the visual modality (for PAS 1; t(40.81) = −9.25, p < 0.001), the amplitude of the early ERP component was significantly more pronounced compared to the auditory modality (for PAS 1, intercept condition). Additionally, the visual modality interaction with PAS 2 (t(6635.71) = −12.28, p < 0.001) and the visual modality interaction with PAS 3 (t(5118.92) = −6.68, p < 0.001) also resulted in significantly more negative early ERP component amplitudes compared to the intercept condition. Results of the post hoc contrasts between PAS ratings are depicted in Figure 7B. In conclusion, PAS ratings significantly differentiated the amplitude of the early components in both modalities, but the effect is stronger for the early component observed in the visual domain.
3.5.4. Late ERP Components: Dependence on the Sensory Modality and Accuracy
We fitted a LMM with modality (2 levels), accuracy (2 levels), and their interaction as fixed effects with random modality slope and participant‐specific intercept to predict changes in late ERP amplitudes (Table S8). Results showed that the intercept was significant (incorrect answers, auditory modality; t(40.13) = 4.41, p < 0.001). Further, we found that correct answers (in the auditory modality; t(21350.25) = 0.76, p = 0.448) did not result in a significant difference in LP amplitude. However, the visual modality (for incorrect answers; t(40.70) = 3.57, p < 0.001) and the interaction between the visual modality and correct answers (t(26447.27) = 14.17, p < 0.001) led to greater LP amplitudes compared to the intercept. Results of post hoc contrast analysis are visualized in Figure 7C. Therefore, the LP amplitude was overall greater and related to the participants' detection accuracy, with correct responses causing greater amplitudes in the visual procedure but not in the auditory one.
3.5.5. Late ERP Components: Dependence on the Sensory Modality and PAS
In order to verify the influence of modality and PAS on late components a LMM was fitted including modality (2 levels), PAS ratings (3 levels), and their interaction as fixed effects with random modality slope and participant‐specific random intercept (Table S9). We found that the intercept was significant (PAS 1, auditory modality; t(39.62) = 4.49, p < 0.001). The LP amplitude was not significantly different for PAS 2 (in the auditory modality; t(21487.96) = 0.45, p = 0.652) and PAS 3 (in the auditory modality; t(16023.71) = 0.64, p = 0.529) compared to PAS 1 (auditory modality, intercept). Further, the visual modality (for PAS 1; t(40.36) = 3.57, p < 0.001) resulted in significantly more positive LP amplitude compared to the auditory modality condition (for PAS 1, intercept). Moreover, the interaction between visual modality and PAS 2 (t(26487.98) = 13.58, p < 0.001), and the interaction between visual modality and PAS 3 (t(24340.49) = 6.92, p < 0.001) led to significantly more pronounced late ERP component amplitudes compared to the intercept condition. Post hoc contrast analysis has shown significant differences in LP amplitudes between each PAS rating for visual sensory domain but not for auditory one (see Figure 7D). Therefore, higher PAS ratings were related to the greater amplitude of the visual LP component but did not differentiate auditory LP component's amplitude.
3.5.6. Early ERP Components: Latency Analysis
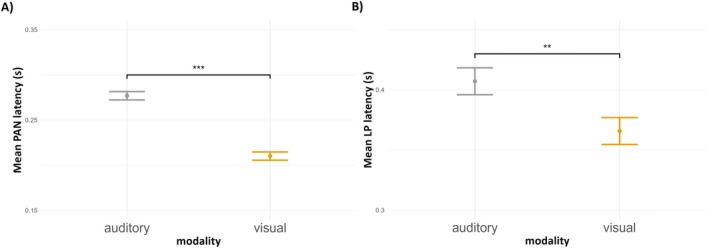
We fitted a linear mixed‐effects model with the main effect of modality (2 levels) as a fixed effect with participant‐specific random intercept to predict changes in early PAN components' latencies (Table S10). Here, we did not include the random modality slope as the model in that form did not converge. Results showed the intercept was significant (auditory modality; t(74.00) = 53.33, p < 0.001), and that the latency of the visual PAN was shorter when compared to the intercept (t(74.00) = −8.27, p < 0.001). Contrast analysis has also shown a significant difference in PAN latencies between sensory domains (see Figure 8A). Therefore, our data indicates that PAN evoked by visual stimuli had a shorter latency than PAN evoked by auditory stimuli.
FIGURE 8.
Mean latency of early (A) and late (B) components depending on the sensory modality. The latency is presented with respect to the target stimulus onset. Error bars represent SEs; asterisks indicate significance levels: ***p < 0.001, **p < 0.01, *p < 0.05, ns p > 0.05.
3.5.7. Late ERP Components: Latency Analysis
The same model was used to analyze the latency of the late LP (Table S11). We found that the intercept was significant (auditory modality; t(74.00) = 36.56, p < 0.001), and that the average LP latency was shorter in the visual modality compared to the intercept condition (t(74.00) = −2.20, p = 0.031). Post hoc contrast analysis has shown a significant difference in LP latencies between sensory domains (see Figure 8B). In conclusion, LP evoked by visual stimuli had shorter latency than LP evoked by auditory stimuli.
3.5.8. Correlation Analysis
We used Bayesian correlations to investigate the relationship between individual visual and auditory perceptual thresholds (tones' volume and Gabor patches' opacity, respectively), and amplitude and latency of all analyzed ERP components (AAN, VAN, auditory LP, and visual LP)—thus, 10 variables in total. Bayesian correlation analysis indicated evidence for a positive correlation between the auditory threshold and the amplitude of the auditory LP (r = 0.43, BF10 = 5.92), suggesting moderate evidence in favor of an association where louder stimuli corresponded to greater LP amplitude. Additionally, there was strong evidence for a negative correlation between the amplitude of the visual LP and the amplitude of the VAN (r = −0.81, BF10 > 100), indicating that greater visual LP amplitude was associated with lower VAN amplitude. For all other correlations, the Bayes factors were close to 1, suggesting that the data were inconclusive regarding the presence or absence of a relationship. The full correlation matrix is presented in Table S12.
4. Discussion
Our understanding of the neural mechanisms of perceptual consciousness is largely based on research done in the visual system (review: Dykstra et al. 2017). While data from other sensory domains, predominantly the auditory (e.g., Eklund et al. 2020; Eklund and Wiens 2019; Filimonov et al. 2022), but also somatosensory (review: Dembski et al. 2021), has been published only recently, few studies have compared mechanisms of perceptual awareness between modalities using analogous experimental procedures in the same sample of participants (Filimonov et al. 2022). Such direct comparisons will be crucial to characterize and compare mechanisms of awareness across senses, and to address whether correlates of consciousness are specific to a given sensory modality, or rather modality‐independent.
4.1. Modality Effects at the Perceptual Level
In the present study, we designed procedures in which participants were presented either with simple auditory or visual stimuli—tones or Gabor patches, respectively—at an individual perceptual threshold (estimated by a staircase). Using a staircase ensured that investigated effects indeed reflect differences in subjective awareness only (i.e., are observed for physically identical stimuli). Analysis of behavioral data from a detection task, which measured perceptual awareness in an “objective” way, revealed that participants detected stimuli at chance level or even below it (48% in the auditory procedure, 37% in the visual procedure; Table 1). This suggests that the staircase procedure was effective, but also that the task was relatively difficult for participants. Importantly, the data shows that detection task accuracy and PAS ratings did not differ between modalities (Figure 4). Moreover, analysis of the SDT parameters indicates that neither d’ nor c measures differ between modalities (Figure 3). Therefore, behavioral data suggests that participants were similarly sensitive to and aware of auditory and visual stimuli.
However, considering that detection can also occur irrespective of perceptual consciousness (Koivisto et al. 2017), in our procedures subjective awareness (i.e., vividness of perception) was measured directly using PAS. We found that the objective and subjective awareness measures were highly correlated as the detection task accuracy was very high (almost 100%) in the aware trials (PAS 2 and 3 ratings), but low (around 25%) in unaware trials (PAS 1) in both visual and auditory procedures (Figure 2B). Analyzing the relation between objective detection and subjective PAS, we found no differences in detection accuracy between aware trials (PAS > 2). Therefore, our behavioral data do not provide evidence that perceptual awareness is a gradual phenomenon (e.g., Derda et al. 2019; Jimenez et al. 2018). However, this result might stem from the limitations of our procedure, as our stimulus presentation threshold (~50% accuracy) led to an uneven distribution of PAS ratings, with very few trials with PAS > 2. Probably such graduality can be observed primarily using an identification task with a stimulus presented above threshold‐level (e.g., Wierzchoń et al. 2014). Therefore, in further analyses, we wanted to answer the question of whether such graduality can be observed in ERP measures.
4.2. Modality Effects at the Neural Level
Analysis of topographic patterns of electrophysiological activity evoked by consciously perceived visual and auditory stimuli revealed qualitative differences mainly at the early stimulus‐processing stage (up to approximately 250 ms from stimulus‐onset; Figure 5). At the later stage, both modalities exhibited similar topographic patterns, with positive voltage at fronto‐central electrodes. Further, when contrasting consciously and unconsciously perceived stimuli (as measured with the PAS scale), we observed early negativity around 200 ms (PAN) and late positivity around 300 ms (LP) after stimulus onset in both modalities (Figure 6). Therefore, our results are in line with previous work showing that contrasting aware and unaware auditory stimuli yields NCC analogous to those identified in the visual modality (Eklund et al. 2020; Eklund and Wiens 2019; Filimonov et al. 2022). Importantly, amplitudes of VAN, AAN, and visual LP components, but not the late auditory LP component, exhibited a gradual relation with PAS ratings: the higher the ratings, the greater amplitudes of early components have been observed (Figure 7). While these results might be interpreted as supporting the idea that perceptual awareness is (at least to some extent) a gradual phenomenon, they contrast with the previously discussed behavioral data, where detection performance was shown to follow an all‐or‐none pattern in relation to PAS.
The fact that the LP amplitude was not related to PAS ratings and detection accuracy in the auditory modality suggests that the neural activity observed at the late processing stage might be more closely related to perceptual awareness in vision than in audition. What might also account for the lack of a relation between awareness and LP is that a growing body of evidence indicates that the LP component reflects cognitive mechanisms such as later‐stage decision‐making or confidence‐related processes rather than perceptual awareness (for review see: Förster et al. 2020). Further, it is important to point out that the discussed effect depends on the inclusion of modality as a random slope in linear mixed models (which account for individual variability in modality effects, but also increase standard errors, leading to a loss of statistical significance for some contrasts). In additional LMM analyses performed without modality as random slopes (assuming that the staircase accounts for individual differences in perceptual thresholds) the auditory LP was in fact related to PAS and detection accuracy (Tables S13–S20, Figures S6–S13). Therefore, caution is needed when interpreting results of the auditory LP analyses, as a larger sample size might allow detecting the discussed effect even in models with random slopes included.
Interestingly, we found that not only topographies but also the timing of investigated ERP components differed between modalities. Specifically, AAN exhibited longer latencies than VAN (i.e., the VAN latency was shorter by around 65 ms, Figure 8). These timing/latency differences present further evidence (beyond the previously described topography and amplitude results) that the early ERP components are modality‐specific. In the case of late LP, the timing was also modality‐dependent—LP's latency in the visual procedure was shorter by around 45 ms than in the auditory procedure. Therefore, the latency analysis of our ERP data suggests that visual stimuli might access consciousness faster than auditory ones, but whether differences in the latency of awareness‐related components indeed reflect differences in the subjective onset of perceptual experience remains to be tested.
Moreover, the design of our study, in which visual and auditory stimuli were presented to the same group of participants, allowed us to correlate estimated perceptual and ERP measures within and between sensory modalities. Interestingly, we did not find evidence that greater perceptual sensitivity in one sensory domain translates into greater sensitivity in the other one, as collected data were inconclusive regarding the correlation between visual and auditory thresholds. Further, we found that a higher auditory threshold (i.e., presenting a louder tone in the main procedure) was related to greater auditory LP amplitude. This result is to be expected, as louder tones most likely attract attention to a greater extent. Finally, within the visual modality, greater VAN amplitude was related to lower LP amplitude, but it is not clear how this can be interpreted (particularly considering the absence of a similar relationship in the auditory domain). Crucially, we did not find that ERP components are correlated across modalities—neither amplitude nor latency of AAN and auditory LP were correlated with VAN and visual LP, respectively. While this might be taken as evidence that perceptual and neural markers of awareness are modality‐specific and do not share a common underlying mechanism (see also Orłowski and Bola 2023), it is important to consider that the sample size of our study might have been too small for investigating group‐level correlations, as suggested by inconclusive Bayes factors. Thus, future large‐scale studies comparing modality effects at perceptual and neural levels are needed to address this question.
4.3. Theoretical Implications
Regarding theoretical implications, our study may also inform work aiming at verifying Global Neuronal Workspace Theory (GNWT; Dehaene et al., 2011) and the Recurrent Processing Theory (RPT; Lamme 2006), respectively. The GNWT posits that sensory information must be broadcast into a globally distributed brain network for entry into consciousness (Dehaene and Changeux 2005). In contrast, the RPT links conscious awareness with dynamic local recurrent processes between higher and lower sensory areas, initiated as soon as the feedforward sweep reaches a higher level (Lamme 2006). Our results suggest that, at least for vision, both early and late ERPs are related to consciousness, thus it seems probable that the combination of both theories may be the most appropriate to explain NCCs. Our interpretation aligns with previous work suggesting that successive ERP markers indicate a sequence of neural events corresponding to distinct stages of conscious perceptual processing (e.g., Koivisto et al. 2017; Navajas et al. 2014; Tagliabue et al. 2016). For example, Navajas et al. (2014) proposed to differentiate perceptual awareness associated with a boost in object‐selective neural assemblies from contextual awareness which pertains to the conscious experience of information associated with stimulus‐evoked recollections (linked to the firing of concept neurons). A similar idea has been also proposed in the context of the microgenesis concept (Aru and Bachmann 2017), where the percept formation process gradually evolves from initial content that progressively “matures” and accrues additional qualities. According to Aru and Bachmann (2017) both early and late awareness‐related ERP components signify distinct stages of the same process—the former representing “perceptual microgenesis” and the latter denoting “immediate memory‐based microgenesis”. In this context, data from our study may suggest a qualitatively similar progression of the awareness‐related processes in visual and auditory modalities, but with differences in timing (Figures 5 and 6 illustrate the temporospatial dynamics of the NCC ERP markers comparatively for low‐level vision and low‐level hearing). Finally, while we did not investigate the integration between senses directly (i.e., during the same experimental session), our findings might contribute to the discussion on how uni‐sensory perceptual mechanisms form a coherent, multimodal conscious experience (Mudrik et al. 2014). Given the modality‐specific character of the PAN component, also observed in our study, proponents of early NCCs may need to consider additional, shared late mechanisms that allow for a unified perceptual experience across modalities. Our results highlight the need to explore whether and to what extent shared mechanisms underlie conscious perception across sensory modalities.
4.4. Limitations
What constitutes a novelty of our study is testing the same participants with analogous visual and auditory experimental procedures, which allowed for direct comparisons between modalities. To our knowledge, such a design has so far been used only by Filimonov et al. (2022). However, there are notable differences between ours and Filimonov et al. (2022) studies, as in the latter visual, auditory, and binomial conditions were randomly mixed and a 3‐point subjective scale was used (and later dichotomized into aware and unaware conditions). Regarding the limitations of our work, it is important to emphasize that despite using a more nuanced version of the contrastive analysis, namely comparing detected/aware with undetected/unaware stimuli using continuous PAS, we neither control prerequisites (NCC‐pre), nor consequences (NCC‐co) of conscious perception (i.e., we did not implement additional manipulations that would enable NCC‐pre and NCC‐co identification; Aru et al. 2012). Therefore, in future research more sophisticated designs should be used to compare both modalities involving, for instance, additional manipulations of expectations, attention, or levels of processing and comparing whether they have different effects in both modalities (i.e., investigating interactions between awareness and cognitive processes). Such a research program may allow for identifying NCC‐proper more precisely (for examples of such an approach in the visual modality see: Ciupińska et al. 2024; Doradzińska and Bola 2024; Derda et al. 2019).
Regarding methodological limitations, a staircase procedure we used targeted the ~50% accuracy level and thus the distribution of PAS ratings we observed was unbalanced, with a low number of PAS > 2 trials, hindering the interpretation of PAS ratings at the higher end. Further, because our procedure was based on the one work by Eklund and Wiens (2019), we did not introduce a random time interval before and after target stimuli (i.e., a jitter). While fixed time intervals generally do not cause problems in behavioral research, jitters are typically used in ERP experiments to alleviate the effect of expectation in response to an upcoming stimulus (Gu 2019). Another limitation, especially important for the ERP data analysis, is a difference in the duration of stimuli between modalities. Specifically, the presentation time of tones was longer (100 ms) than that of Gabor patches (33 ms; see Figure 1). However, this is to some extent unavoidable if a near‐threshold stimulus presentation is required, because of differences in the sensory modalities characteristics. Nevertheless, stimuli duration differences mean that their offsets happened at different time points, which might have affected the observed ERP components, especially their latencies. Future studies could draw on existing research that explores methods for balancing stimulus presentation times across modalities, potentially allowing for clearer insights into how the NCCs operate in different sensory systems.
Moreover, a key limitation of this study is the use of a single, specific type of stimulus for each modality—Gabor patches for visual and simple tones for auditory stimuli—which restricts the generalizability of our findings. Consciousness likely depends on a broader range of stimulus characteristics (Casali et al. 2013; Cetnarski et al. 2014), such as complexity, duration, and ecological validity, which we were unable to capture. This limitation is particularly important for understanding the temporal dynamics of awareness‐related ERP components like VAN, AAN, and LP, as the observed temporal differences may not generalize to more complex or dynamic stimuli, such as natural scenes or speech. To address this, future research should use a wider variety of stimuli, including more complex and naturalistic inputs. Additionally, cross‐modal designs and multi‐modal experiments, where participants are exposed to visual and auditory stimuli simultaneously, could provide valuable insights into the temporal aspects of conscious processing and help refine our understanding of the differences and commonalities between visual and auditory neural markers of consciousness.
4.5. Conclusions
Using simple visual and auditory detection tasks we found that perceptual awareness ratings were related to analogous early (VAN, AAN) ERP components in both sensory modalities. However, the late (LP) component was related to PAS ratings only in the visual modality, but not in auditory one. Further, we confirmed differences in spatial topographies for visual and auditory NCC, and provided novel evidence that the visual and auditory components differ also in terms of temporal characteristics, with visual NCC exhibiting shorter latencies. Finally, we did not find evidence that perceptual or electrophysiological measures were correlated between modalities at the inter‐individual level, which thus indicates that mechanisms of visual and auditory awareness might not be so closely related. Therefore, our study suggests a spatio‐temporal segregation of ERP markers of perceptual awareness, in line with previous reports and theoretical accounts (Aru and Bachmann 2017; Koivisto et al. 2017). It is however important to consider that our conclusions are limited by methodological factors, most importantly presentation parameters varying between auditory and visual stimuli, and a sample size which might not be sufficient for between‐subjects analyses.
Author Contributions
Kinga Ciupińska: conceptualization, formal analysis, funding acquisition, investigation, methodology, project administration, software, visualization, writing – original draft, writing – review and editing. Marcin Koculak: conceptualization, software. Michał Bola: conceptualization, supervision, writing – review and editing. Michał Wierzchoń: conceptualization, supervision, writing – review and editing.
Conflicts of Interest
The authors declare no conflicts of interest.
Supporting information
Data S1.
Ciupińska, K. , Koculak M., Bola M., and Wierzchoń M.. 2025. “Early and Late ERP Correlates of Conscivousness— A Direct Comparison Between Visual and Auditory Modalities.” Psychophysiology 62, no. 7: e70099. 10.1111/psyp.70099.
Funding: The study was funded by the National Science Centre Poland Preludium grant (Grant 2019/35/N/HS6/02150). Centre for Brain Research is supported as a flagship project by Future Society Priority Research Area and Quality of Life Priority Research Area under the Strategic Program of Excellence Initiative at the Jagiellonian University. We thank Wiktoria Orłowska and Laura Łępa for assisting with data collection.
Michał Bola and Michał Wierzchoń equal senior authorship.
Data Availability Statement
The scripts employed for EEG data preprocessing, scripts for statistical analysis, and CSV files containing behavioral and ERP data in a format that entered statistical analysis are available for download from the OSF repository (https://osf.io/8q7su/).
References
- Andersen, L. M. , Pedersen M. N., Sandberg K., and Overgaard M.. 2016. “Occipital MEG Activity in the Early Time Range (<300 ms) Predicts Graded Changes in Perceptual Consciousness.” Cerebral Cortex 26, no. 6: 2677–2688. 10.1093/cercor/bhv108. [DOI] [PubMed] [Google Scholar]
- Aru, J. , and Bachmann T.. 2017. “In and out of Consciousness: How Does Conscious Processing (D) Evolve Over Time?” Frontiers in Psychology 8: 238706. 10.3389/fpsyg.2017.00128. [DOI] [PMC free article] [PubMed] [Google Scholar]
- Aru, J. , Bachmann T., Singer W., and Melloni L.. 2012. “Distilling the Neural Correlates of Consciousness.” Neuroscience & Biobehavioral Reviews 36, no. 2: 737–746. 10.1016/j.neubiorev.2011.12.003. [DOI] [PubMed] [Google Scholar]
- Bates, D. , Mächler M., Bolker B., and Walker S.. 2014. “Fitting Linear Mixed‐Effects Models Using lme4.” arXiv Preprint arXiv:1406.5823. 10.48550/arXiv.1406.5823. [DOI]
- Benjamini, Y. , and Hochberg Y.. 1995. “Controlling the False Discovery Rate: A Practical and Powerful Approach to Multiple Testing.” Journal of the Royal Statistical Society: Series B: Methodological 57, no. 1: 289–300. 10.1111/j.2517-6161.1995.tb02031. [DOI] [Google Scholar]
- Bola, M. , and Doradzińska Ł.. 2021. “Perceptual Awareness Negativity—Does It Reflect Awareness or Attention?” Frontiers in Human Neuroscience 15: 742513. 10.3389/fnhum.2021.742513. [DOI] [PMC free article] [PubMed] [Google Scholar]
- Casali, A. G. , Gosseries O., Rosanova M., et al. 2013. “A Theoretically Based Index of Consciousness Independent of Sensory Processing and Behavior.” Science Translational Medicine 5, no. 198: 294. 10.1126/scitranslmed.3006294. [DOI] [PubMed] [Google Scholar]
- Cetnarski, R. , Betella A., Prins H., Kouider S., and Verschure P. F.. 2014. “Subliminal Response Priming in Mixed Reality: The Ecological Validity of a Classic Paradigm of Perception.” Presence Teleoperators and Virtual Environments 23, no. 1: 1–17. 10.1162/PRES_a_00171. [DOI] [Google Scholar]
- Ciupińska, K. , Orłowska W., Zębrowski A., et al. 2024. “The Influence of Spatial and Temporal Attention on Visual Awareness—A Behavioral and ERP Study.” Cerebral Cortex 34, no. 6: bhae241. 10.1093/cercor/bhae241. [DOI] [PubMed] [Google Scholar]
- Crick, F. , and Koch C.. 2003. “A Framework for Consciousness.” Nature Neuroscience 6, no. 2: 119. 10.1038/nn0203-119. [DOI] [PubMed] [Google Scholar]
- Dehaene, S. , and Changeux J.‐P.. 2005. “Ongoing Spontaneous Activity Controls Access to Consciousness: A Neuronal Model for Inattentional Blindness.” PLoS Biology 3, no. 5: e141. 10.1371/journal.pbio.0030141. [DOI] [PMC free article] [PubMed] [Google Scholar]
- Dehaene, S. , Changeux J. P., Naccache L., Sakur J., and Sergent C.. 2006. “Conscious, Preconscious, and Subliminal Processing: A Testable Taxonomy.” Trends in Cognitive Sciences 10, no. 5: 204–211. 10.1016/j.tics.2006.03.007. [DOI] [PubMed] [Google Scholar]
- Dehaene, S. , and Naccache L.. 2001. “Towards a Cognitive Neuroscience of Consciousness: Basic Evidence and Workspace Framework.” Cognition 79: 1–37. 10.1016/S0010-0277(00)00123-2. [DOI] [PubMed] [Google Scholar]
- Dehaene, S. , Sergent C., and Changeux J.‐P.. 2003. “A Neuronal Network Model Linking Subjective Reports and Objective Physiological Data During Conscious Perception.” Proceedings of the National Academy of Sciences 100, no. 14: 8520–8525. 10.1073/pnas.1332574100. [DOI] [PMC free article] [PubMed] [Google Scholar]
- Del Cul, A. , Baillet S., and Dehaene S.. 2007. “Brain Dynamics Underlying the Nonlinear Threshold for Access to Consciousness.” PLoS Biology 5, no. 10: e260. 10.1371/journal.pbio.0050260. [DOI] [PMC free article] [PubMed] [Google Scholar]
- Dembski, C. , Koch C., and Pitts M.. 2021. “Perceptual Awareness Negativity: A Physiological Correlate of Sensory Consciousness.” Trends in Cognitive Sciences 25, no. 8: 660–670. 10.1016/j.tics.2021.05.009. [DOI] [PubMed] [Google Scholar]
- Derda, M. , Koculak M., Windey B., et al. 2019. “The Role of Levels of Processing in Disentangling the ERP Signatures of Conscious Visual Processing.” Consciousness and Cognition 73: 102767. 10.1016/j.concog.2019.102767. [DOI] [PubMed] [Google Scholar]
- Doradzińska, Ł. , and Bola M.. 2024. “Early Electrophysiological Correlates of Perceptual Consciousness Are Affected by Both Exogenous and Endogenous Attention.” Journal of Cognitive Neuroscience 36: 1–28. 10.1162/jocn_a_02156. [DOI] [PubMed] [Google Scholar]
- Dykstra, A. R. , Cariani P. A., and Gutschalk A.. 2017. “A Roadmap for the Study of Conscious Audition and Its Neural Basis.” Philosophical Transactions of the Royal Society, B: Biological Sciences 372, no. 1714: 20160103. 10.1098/rstb.2016.0103. [DOI] [PMC free article] [PubMed] [Google Scholar]
- Eklund, R. , Gerdfeldter B., and Wiens S.. 2019. “Effects of a Manual Response Requirement on Early and Late Correlates of Auditory Awareness.” Frontiers in Psychology 10: 2083. 10.3389/fpsyg.2019.02083. [DOI] [PMC free article] [PubMed] [Google Scholar]
- Eklund, R. , Gerdfeldter B., and Wiens S.. 2020. “Is Auditory Awareness Negativity Confounded by Performance?” Consciousness and Cognition 83: 102954. 10.1016/j.concog.2020.102954. [DOI] [PubMed] [Google Scholar]
- Eklund, R. , Gerdfeldter B., and Wiens S.. 2021. “The Early but Not the Late Neural Correlate of Auditory Awareness Reflects Lateralized Experiences.” Neuropsychologia 158: 107910. 10.1016/j.neuropsychologia.2021.107910. [DOI] [PubMed] [Google Scholar]
- Eklund, R. , and Wiens S.. 2018. “Visual Awareness Negativity Is an Early Neural Correlate of Awareness: A Preregistered Study With Two Gabor Sizes.” Cognitive, Affective, & Behavioral Neuroscience 18: 176–188. 10.3758/s13415-018-0562-z. [DOI] [PMC free article] [PubMed] [Google Scholar]
- Eklund, R. , and Wiens S.. 2019. “Auditory Awareness Negativity Is an Electrophysiological Correlate of Awareness in an Auditory Threshold Task.” Consciousness and Cognition 71: 70–78. 10.1016/j.concog.2019.03.008. [DOI] [PubMed] [Google Scholar]
- Filimonov, D. , Railo H., Revonsuo A., and Koivisto M.. 2022. “Modality‐Specific and Modality‐General Electrophysiological Correlates of Visual and Auditory Awareness: Evidence From a Bimodal ERP Experiment.” Neuropsychologia 166: 108154. 10.1016/j.neuropsychologia.2022.108154. [DOI] [PubMed] [Google Scholar]
- Förster, J. , Koivisto M., and Revonsuo A.. 2020. “ERP and MEG Correlates of Visual Consciousness: The Second Decade.” Consciousness and Cognition 80: 102917. 10.1016/j.concog.2020.102917. [DOI] [PubMed] [Google Scholar]
- Gramfort, A. , Luessi M., Larson E., et al. 2013. “MEG and EEG Data Analysis With MNE‐Python.” Frontiers in Neuroscience 7: 267. 10.3389/fnins.2013.00267. [DOI] [PMC free article] [PubMed] [Google Scholar]
- Gu, R. 2019. “ERP Experimental Design.” In EEG Signal Processing and Feature Extraction, edited by Hu L. and Zhang Z., 1–437. Springer. 10.1007/978-981-13-9113-2_4. [DOI] [Google Scholar]
- Holm, S. 2013. “Declaration of Helsinki. International Encyclopedia of Ethics.” 1‐4. 10.1002/9781444367072.wbiee230.pub2. [DOI]
- Homan, R. W. , Herman J., and Purdy P.. 1987. “Cerebral Location of International 10–20 System Electrode Placement.” Electroencephalography and Clinical Neurophysiology 66, no. 4: 376–382. 10.1016/0013-4694(87)90206-9. [DOI] [PubMed] [Google Scholar]
- Hurme, M. , Koivisto M., Revonsuo A., and Railo H.. 2017. “Early Processing in Primary Visual Cortex Is Necessary for Conscious and Unconscious Vision While Late Processing Is Necessary Only for Conscious Vision in Neurologically Healthy Humans.” NeuroImage 150: 230–238. 10.1016/j.neuroimage.2017.02.060. [DOI] [PubMed] [Google Scholar]
- Hutmacher, F. 2019. “Why Is There So Much More Research on Vision Than on Any Other Sensory Modality?” Frontiers in Psychology 10: 2246. 10.3389/fpsyg.2019.02246. [DOI] [PMC free article] [PubMed] [Google Scholar]
- JASP Team . 2024. “JASP (Version 0.18.1) [Computer Software].” https://jasp‐stats.org/.
- Jimenez, M. , Grassini S., Montoro P. R., Luna D., and Koivisto M.. 2018. “Neural Correlates of Visual Awareness at Stimulus Low vs. High‐Levels of Processing.” Neuropsychologia 121: 144–152. 10.1016/j.neuropsychologia.2018.11.001. [DOI] [PubMed] [Google Scholar]
- Koivisto, M. , and Grassini S.. 2016. “Neural Processing Around 200 Ms After Stimulus‐Onset Correlates With Subjective Visual Awareness.” Neuropsychologia 84: 235–243. 10.1016/j.neuropsychologia.2016.02.024. [DOI] [PubMed] [Google Scholar]
- Koivisto, M. , Grassini S., Salminen‐Vaparanta N., and Revonsuo A.. 2017. “Different Electrophysiological Correlates of Visual Awareness for Detection and Identification.” Journal of Cognitive Neuroscience 29, no. 9: 1621–1631. 10.1162/jocn_a_01149. [DOI] [PubMed] [Google Scholar]
- Koivisto, M. , and Revonsuo A.. 2010. “Event‐Related Brain Potential Correlates of Visual Awareness.” Neuroscience & Biobehavioral Reviews 34, no. 6: 922–934. 10.1016/j.neubiorev.2009.12.002. [DOI] [PubMed] [Google Scholar]
- Kuznetsova, A. , Brockhoff P. B., and Christensen R. H.. 2017. “lmerTest Package: Tests in Linear Mixed Effects Models.” Journal of Statistical Software 82: 1–26. 10.18637/jss.v082.i13. [DOI] [Google Scholar]
- Lamme, V. A. 2006. “Towards a True Neural Stance on Consciousness.” Trends in Cognitive Sciences 10, no. 11: 494–501. 10.1016/j.tics.2006.09.001. [DOI] [PubMed] [Google Scholar]
- Lamy, D. , Salti M., and Bar‐Haim Y.. 2009. “Neural Correlates of Subjective Awareness and Unconscious Processing: An ERP Study.” Journal of Cognitive Neuroscience 21, no. 7: 1435–1446. 10.1162/jocn.2009.21064. [DOI] [PubMed] [Google Scholar]
- Lenth, R. V. 2016. “Least‐Squares Means: The R Package Lsmeans.” Journal of Statistical Software 69: 1–33. 10.18637/jss.v069.i01. [DOI] [Google Scholar]
- Lüdecke, D. 2018. “Ggeffects: Tidy Data Frames of Marginal Effects From Regression Models.” Journal of Open Source Software 3, no. 26: 772. 10.21105/joss.00772. [DOI] [Google Scholar]
- Lutz, A. , and Thompson E.. 2003. “Neurophenomenology Integrating Subjective Experience and Brain Dynamics in the Neuroscience of Consciousness.” Journal of Consciousness Studies 10, no. 9–10: 31–52. [Google Scholar]
- Makowski, D. 2018. “The Psycho Package: An Efficient and Publishing‐Oriented Workflow for Psychological Science.” Journal of Open Source Software 3, no. 22: 470. 10.21105/joss.00470. [DOI] [Google Scholar]
- Moon, K. W. 2017. Learn ggplot2 Using Shiny App. Springer. 10.1007/978-3-319-53019-2. [DOI] [Google Scholar]
- Mudrik, L. , Faivre N., and Koch C.. 2014. “Information Integration Without Awareness.” Trends in Cognitive Sciences 18, no. 9: 488–496. 10.1016/j.tics.2014.04.009. [DOI] [PubMed] [Google Scholar]
- Navajas, J. , Rey H. G., and Quian Quiroga R.. 2014. “Perceptual and Contextual Awareness: Methodological Considerations in the Search for the Neural Correlates of Consciousness.” Frontiers in Psychology 5: 104934. 10.3389/fpsyg.2014.00959. [DOI] [PMC free article] [PubMed] [Google Scholar]
- Orłowski, P. , and Bola M.. 2023. “Sensory Modality Defines the Relation Between EEG Lempel–Ziv Diversity and Meaningfulness of a Stimulus.” Scientific Reports 13, no. 1: 3453. 10.1038/s41598-023-30639-3. [DOI] [PMC free article] [PubMed] [Google Scholar]
- Overgaard, M. , Rote J., Mouridsen K., and Ramsøy T. Z.. 2006. “Is Conscious Perception Gradual or Dichotomous? A Comparison of Report Methodologies During a Visual Task.” Consciousness and Cognition 15, no. 4: 700–708. 10.1016/j.concog.2006.04.002. [DOI] [PubMed] [Google Scholar]
- Peirce, J. W. 2007. “PsychoPy—Psychophysics Software in Python.” Journal of Neuroscience Methods 162, no. 1–2: 8–13. 10.1016/j.jneumeth.2006.11.017. [DOI] [PMC free article] [PubMed] [Google Scholar]
- Pretorius, H. , Tredoux C., and Malcolm‐Smith S.. 2016. “Subjective Awareness Scale Length Influences the Prevalence, Not the Presence, of Graded Conscious States.” Consciousness and Cognition 45: 47–59. 10.1016/j.concog.2016.08.007. [DOI] [PubMed] [Google Scholar]
- R Core Team . 2015. “R: A Language and Environment for Statistical Computing R Foundation for Statistical Computing Vienna,” Austria.
- Ramsøy, T. Z. , and Overgaard M.. 2004. “Introspection and Subliminal Perception.” Phenomenology and the Cognitive Sciences 3, no. 1: 1–23. 10.1023/B:PHEN.0000041900.30172.e8. [DOI] [Google Scholar]
- Rauschecker, J. P. 2015. “Auditory and Visual Cortex of Primates: A Comparison of Two Sensory Systems.” European Journal of Neuroscience 41, no. 5: 579–585. 10.1111/ejn.12844. [DOI] [PMC free article] [PubMed] [Google Scholar]
- Rutiku, R. , Martin M., Bachmann T., and Aru J.. 2015. “Does the P300 Reflect Conscious Perception or Its Consequences?” Neuroscience 298: 180–189. 10.1016/j.neuroscience.2015.04.029. [DOI] [PubMed] [Google Scholar]
- Salti, M. , Bar‐Haim Y., and Lamy D.. 2012. “The P3 Component of the ERP Reflects Conscious Perception, Not Confidence.” Consciousness and Cognition 21, no. 2: 961–968. 10.1016/j.concog.2012.01.012. [DOI] [PubMed] [Google Scholar]
- Sandberg, K. , Timmermans B., Overgaard M., and Cleeremans A.. 2010. “Measuring Consciousness: Is One Measure Better Than the Other?” Consciousness and Cognition 19, no. 4: 1069–1078. 10.1016/j.concog.2009.12.013. [DOI] [PubMed] [Google Scholar]
- Sekar, K. , Findley W. M., Poeppel D., and Llinás R. R.. 2013. “Cortical Response Tracking the Conscious Experience of Threshold Duration Visual Stimuli Indicates Visual Perception Is All or None.” Proceedings of the National Academy of Sciences 110, no. 14: 5642–5647. 10.1073/pnas.1302229110. [DOI] [PMC free article] [PubMed] [Google Scholar]
- Sergent, C. , and Dehaene S.. 2004. “Is Consciousness a Gradual Phenomenon? Evidence for an All‐or‐None Bifurcation During the Attentional Blink.” Psychological Science 15, no. 11: 720–728. 10.1111/j.0956-7976.2004.00748.x. [DOI] [PubMed] [Google Scholar]
- Seth, A. K. , Dienes Z., Cleeremans A., Overgaard M., and Pessoa L.. 2008. “Measuring Consciousness: Relating Behavioural and Neurophysiological Approaches.” Trends in Cognitive Sciences 12, no. 8: 314–321. 10.1016/j.tics.2008.04.008. [DOI] [PMC free article] [PubMed] [Google Scholar]
- Snyder, J. S. , Yerkes B. D., and Pitts M. A.. 2015. “Testing Domain‐General Theories of Perceptual Awareness With Auditory Brain Responses.” Trends in Cognitive Sciences 19, no. 6: 295–297. 10.1016/j.tics.2015.04.002. [DOI] [PubMed] [Google Scholar]
- Stanislaw, H. , and Todorov N.. 1999. “Calculation of Signal Detection Theory Measures.” Behavior Research Methods, Instruments, & Computers 31, no. 1: 137–149. 10.3758/BF03207704. [DOI] [PubMed] [Google Scholar]
- Tagliabue, C. F. , Mazzi C., Bagattini C., and Savazzi S.. 2016. “Early Local Activity in Temporal Areas Reflects Graded Content of Visual Perception.” Frontiers in Psychology 7: 572. 10.3389/fpsyg.2016.00572. [DOI] [PMC free article] [PubMed] [Google Scholar]
- Wickham, H. 2011. “ggplot2.” Wiley Interdisciplinary Reviews: Computational Statistics 3, no. 2: 180–185. 10.1002/wics.147. [DOI] [Google Scholar]
- Widmann, A. , Schröger E., and Maess B.. 2015. “Digital Filter Design for Electrophysiological Data–a Practical Approach.” Journal of Neuroscience Methods 250: 34–46. 10.1016/j.jneumeth.2014.08.002. [DOI] [PubMed] [Google Scholar]
- Wierzchoń, M. , Paulewicz B., Asanowicz D., Timmermans B., and Cleeremans A.. 2014. “Different Subjective Awareness Measures Demonstrate the Influence of Visual Identification on Perceptual Awareness Ratings.” Consciousness and Cognition 27: 109–120. 10.1016/j.concog.2014.04.009. [DOI] [PubMed] [Google Scholar]
Associated Data
This section collects any data citations, data availability statements, or supplementary materials included in this article.
Supplementary Materials
Data S1.
Data Availability Statement
The scripts employed for EEG data preprocessing, scripts for statistical analysis, and CSV files containing behavioral and ERP data in a format that entered statistical analysis are available for download from the OSF repository (https://osf.io/8q7su/).