

Abstract
Accurate Lung cancer (LC) identification is a big medical problem in the AI-based healthcare systems. Various deep learning-based methods have been proposed for Lung cancer diagnosis. In this study, we proposed a Deep learning techniques-based integrated model (CNN-GRU) for Lung cancer detection. In the proposed model development Convolutional neural networks (CNNs), and gated recurrent units (GRU) models are integrated to design an intelligent model for lung cancer detection. The CNN model extracts spatial features from lung CT images through convolutional and pooling layers. The extracted features from data are embedded in the GRUs model for the final prediction of LC. The model (CNN-GRU) was validated using LC data using the holdout validation technique. Data augmentation techniques such as rotation, and brightness were used to enlarge the data set size for effective training of the model. The optimization techniques Stochastic Gradient Descent(SGD) and Adaptive Moment Estimation(ADAM) were applied during model training for model training parameters optimization. Additionally, evaluation metrics were used to test the model performance. The experimental results of the model presented that the model achieved 99.77% accuracy as compared to previous models. The (CNN-GRU) model is recommended for accurate LC detection in AI-based healthcare systems due to its improved diagnosis accuracy.
Subject terms: Biophysics, Computational biology and bioinformatics
Introduction
Cardiac and respiratory disorders are leading causes of death worldwide particularly in old age1. As the world population increases, the prevalence of various diseases rises, putting an additional burden on healthcare systems. Alternatives to early disease detection are needed to satisfy the growing healthcare needs of the elderly. When diseases are detected early, they can be treated before they become critical. Several large-scale techniques, such as the Nederlands-Leuvens Longkanker Screenings Onderzoek( NELSON) Trial2 and the National Lung Screening Trial (NLST)3, were developed to refine the diagnosis of initial LC. Annual Low-Dose CT Screening, as well as numerous clinical assessments. The NLST and NELSON studies indicate that combining low-dose CT imaging with lung cancer screening (LCS) significantly reduces lung cancer mortality rates, making it a vital method for high-risk populations4. The ability of LCS imaging to detect underdiagnosed viruses in LCS populations is a significant and as of yet unrealized advantage. Cardiovascular Disease (CVD) has similar risk features as LC. As a result, a thorough examination of LCS imaging could aid in the diagnosis of cardiovascular risk. Similarly, the detection of early respiratory diseases that affect survival should be enhanced. Various approaches are employed to identify lung cancer; however, these techniques are not suitable for detecting LC.
Artificial intelligence techniques5–7 are widely applied nowadays for the analysis of medical data in order to diagnose different chronic diseases8,9. Certain deep learning(DL) models Convolutional neural networks (CNNs), and gated recurrent units (GRU) are suitable for the analysis of medical imaging data because these models extract more deep patterns from images, and the classifier accurately classifies the images as cancerous or non-concourses. In AI-based healthcare systems for critical disease diagnosis, deep learning techniques are incorporated, due to their excellent performance. LC diagnosis from CT scan imaging data is more effective using deep learning models and different researchers have proposed different lung cancer diagnosis models. Here, we discuss the recently published research on LC diagnosis using AI techniques.
Niaki et al.10 suggested using the K-nearest-neighbor(KNN) algorithm in conjunction with a genetic algorithm(GA) as a method for LC identification. To improve the KNN classifier’s training procedure, the GA is integrated to gather suitable attributes. The model’s effectiveness is measured using evaluation measures. The 1000 instances and 23 features of the LC dataset were used. The suggested model, GA-KNN, demonstrated a high level of prediction accuracy. Ibrahim et al.11 proposed an artificial neural network(ANN) based LC diagnosis model. The model achieved 96.67% accuracy. Yang et al.6 development of an LC recognition system by the use of ANN to analyze pathological images. The proposed model achieved an accuracy of 90 percent.
Alsinglawi et al.6 proposed a method for diagnosing LC applied Machine Learning (ML) techniques. The validation method k-folds with k=10 CV are used for model validation. The suggested method’s outputs were evaluated using valuation metrics, and the Random-forest and SMOTE class-balancing models achieved good accuracy. Gao et al.12 proposed a deep learning based method using a pre-trained MobileNetV2 model for diagnosis of lung cancer. Lung cancer CT scan image data was used for the proposed model finetuning and the model obtained 99.6% accuracy.
priya et al.13 proposed a deep learning algorithms based model for lung cancer detection using SE-ResNeXt-50 architecture and Convolutional Neural Networks (CNNs) (SE-ResNeXt-50-CNN). The lung CT images data was used for model validation and the proposed model obtained 99.15% accuracy, 97.58% sensitivity, 99.80% specificity, and 98.54% score.
Table 1 gives a brief overview of other DL-based techniques for LC detection.
Table 1.
LC detection baseline models summary: Classification classes (Binary=B, for Multi =M).
| References | Year | Feature extraction | Data set | Model | Classification | Accuracy (%) |
|---|---|---|---|---|---|---|
| 14 | 2020 | CRNN, LSTM | NLST | CNN RNN RestNet | B | Average |
| 15 | 2020 | AdaBoost. | Kaggle | CNN | M | 90.85 |
| 16 | 2024 | – | COVID-QU-Ex | MaxViT | M | 97.14 |
| 17 | 2024 | RNN | CXR picture | CNN, RNN, LSTM | - | High |
| 15 | 2020 | AdaBoost algorithm | CT scan images | CNN | – | 90.85 |
| 18 | 2025 | – | Chest CT and IQ-OTH-NCCD | CNNs-ViTs | M | 99.54, 98.41 |
| 19 | 2023 | RNN, CRNN, NN | microarray LC dataset | CRNN | B | 91, 83, 71 |
| 20 | 2020 | CCSA and GLCM | Lung and colon histopathological image | CNN | M | 96.11 |
| 21 | 2023 | CNN, RNN | CT scan images | CCDC-HNN | B | 95 |
| 22 | 2024 | CNN | - | VGG-16, and VGG-19 | – | 95 |
| 23 | 2024 | CNN | – | 3D-VNet | – | 99.2 |
| 24 | 2023 | CNN | – | Ensemble 2D CNN | – | 95 |
According to the literature review as summarized in Table 1, various DL algorithms-based techniques were considered for accurate diagnosis of LC. However, further improvement is necessary in these methods to detect LC accurately. Therefore, an intelligent method is necessary to design for accurate and efficient recognition of LC in AI-based healthcare systems.
In this research study for lung cancer detection Deep learning techniques-based model is proposed (CNN-GRU). In the proposed model, the CNNs and GRUs models are integrated to design the LC detection model. In order to improve the LC detection model, the GRU captures temporal relationships between medical image sequences, such as multiple CT scans over time. To enhance the model’s capacity to identify subtle patterns and progressions, the GRU monitors changes in lung tissue and tumor growth while the Convolutional Neural Network (CNN) extracts spatial data. The model is enhanced in accuracy and efficacy by integrating CNN’s spatial analysis with GRU’s sequential learning. GRU was chosen over LSTM for integration with CNN due to its computational efficiency, faster training, and lower memory requirements, making it ideal for large-scale medical imaging. The (CNN-GRU) model was validated using LC image data. Data augmentation techniques such as rotation, and brightness were used to enlarge the data set size for effective training of the model. The hold-out validation technique is used for the training and testing of the suggested model. Moreover, evaluation metrics were applied for the evaluation of the model. The optimization algorithm SGD and ADAM are incorporated during the model’s training. The (CNN-GRU) model experimental results demonstrate the prospective to improve the correctness and effectiveness of diagnosing LC in the AI-based healthcare system. The Major contributions are as follows:
Design an integrated deep learning-based (CNN-GRU) model for LC detection.
In the model the GRU captures temporal relationships between medical image sequences. To enhance the model’s capacity to identify subtle patterns and progressions, the GRU monitors changes in lung tissue and tumor growth while the Convolutional Neural Network (CNN) extracts spatial data. The model is enhanced in accuracy and efficacy by integrating CNN’s spatial analysis with GRU’s sequential learning.
The optimization algorithms SGD and ADAM are utilized during model training to optimize the model parameters.
Hold out validation technique is used for model training and validation and tested the model by IQ-OTH/NCCD and CT-Scan images data sets and computes evaluation metrics for model performance evaluation.
The (CNN-GRU) model obtained high performance compared to baseline models using statistical t-test.
The (CNN-GRU) model demonstrates the prospective to improve the correctness and effectiveness of diagnosing LC in the AI-based healthcare system.
In the remaining paper the methodology of the proposed method is given in Sect. Methodology, the proposed model experimental results are reported in Sects. Experiments and Conclusion is the conclusion and future work.
Methodology
Datasets
The model was validated using CT-Scan images and IQ-OTH/NCCD data sets in this study. The IQ-OTH/NCCD lung cancer dataset consists of CT scan images categorized into three classes: malignant, benign, and normal. The dataset contains a total of 1097 images, with 561 malignant, 120 benign, and 416 normal images. The ratio of malignant, benign, and normal images is given in Fig. 1. These images were utilized in this study for the purpose of lung cancer detection. The IQ-OTH/NCCD-Lung Cancer Dataset classes are shown in Fig. 2. Model cross-validation was performed using the CT-Scan image data set, which has 364 images altogether, of which 238 are cancerous and 238 are non-cancerous.
Fig. 1.
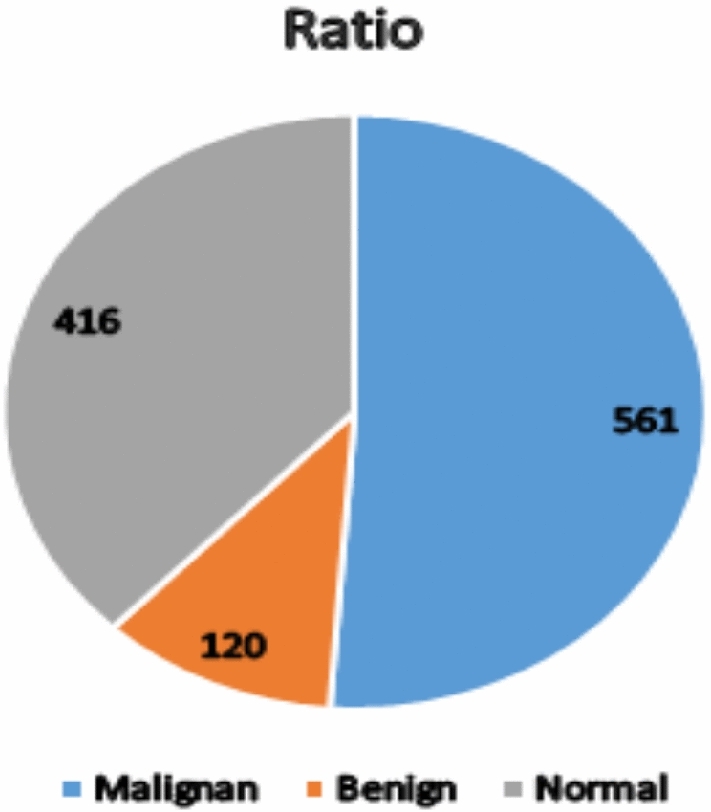
Dataset samples ratio of malignant, benign, and normal classes.
Fig. 2.

IQ-OTH/NCCD-Lung Cancer dataset description.
Method
Convolutional neural networks (CNN) based feature extraction
CNNs, or feed-forward neural networks, are widely recognized for their application in the construction of deep learning algorithms25. The CNN structure as shown in Fig. 3 included pooling, convolutional, and fully connected, which perform tasks including feature extraction, dimensionality reduction, and classification. In the LC detection process, we use CNNs because they are great at understanding images like lung scans. CNNs help us find important patterns in the images that can indicate the presence of lung cancer. They are good at learning different levels of details in the images, starting from simple features to more complex ones. The filter moves over the input during the forward pass of the convolution, calculating the activation that is shown by summing the point-wise production of each component to produce an activation at that place. Sliding filters are created using convolutions. Since this process is linear, a dot product could be an effective way to explain it.
Fig. 3.

CNN architecture.
Equation 1 illustrates how a convolution  at t time may be defined for all dimensions with x as input and w as kernel function.
| 1 |
where a in  denotes any
  .
.
Typically, the discrete parameter is t. Thus, Eq. (2) can be used to represent the process of convolution.
| 2 |
Nonetheless, researchers frequently employ 2 or 3 dimensional convolutions. Assume we have a 2-dimensional kernel N and a 2-dimensional image I as inputs.
Gated recurrent unit (GRU)
The specialized version of RNN architecture known as a Gated Recurrent Unit (GRU)26 has garnered popularity due to its capacity to overcome some of the limitations associated with conventional RNNs. It was introduced in 2014 by Cho and colleagues, and its effectiveness in modeling sequential data has made it a crucial element in various machine learning and natural language processing tasks. Whereas 2 or 3-dimensional convolutions are used by researchers. Let two-dimensional image I be taken as input and a 2-D kernel K. One of the main problems encountered with standard RNNs is the vanishing gradient issue, which impairs their capacity to identify distant relationships in sequential data. GRUs with built-in gating mechanisms were created expressly to solve this problem. These gates control the information flow inside the network, making it easier to recall or delete pertinent data at each time step. A GRU consists of four key components: an update gate  , a reset gate
  , a hidden state
  , and a candidate state. The hidden state is the network’s memory for prior information; the reset gate regulates which data from the earlier hidden state would be destroyed and the update gate governs what amount of candidate state should be included in the current hidden state. The candidate state is calculated with the current input and the reset gate. The GRU model is depicted in Fig. 4.
Fig. 4.

GRU architecture.
Data augmentation
Data augmentation techniques such as rotation, and brightness were used to increase and balance the training dataset by making several variations to the original data in this research study27.
Validation and assessment approach
For model training and validation the holdout cross-validation mechanism28 is used. In this study for all experiments, we divided the datasets of CT scan images 80% and 20% for training and testing of the model. Different assessment measures are used to evaluate the proposed model9,29. Eqs. (3) through (7) outline key assessment measures used to evaluate the proposed model.
| 3 |
| 4 |
| 5 |
| 6 |
| 7 |
Proposed lung cancer detection model (CNN-GRU)
An integrated deep learning model based on CNN and GRU is proposed for lung cancer detection in AI-based healthcare systems. In the development of the proposed model, CNN and GRU models are integrated to design a model for detecting lung cancer. CNN model is employed to extract deep patterns from the CT scan images through a series of pooling and convolutional layers. The obtained features from data are embedded in the GRUs model for the final prediction of LC. The structure of the CNN-GRU model has 3 convolution layers, 3 batch normalization layers, 3 max-pooling layers, 3 Relu activation functions, 1 flatten layer, 3 GRU layers, 2 Dropout layers, 2 dense layers, and one softmax activation function for final classification. The model (CNN-GRU) was validated using CT Scan image data. Data augmentation techniques such as rotation, and brightness were used to enlarge the data set size for effective training of the model. For the training and testing of the model, the holdout CV method was used. Furthermore, metrics for evaluating performance were applied for the model’s evaluation. The optimization algorithms SGD and ADAM were implemented to optimize the training parameters of the model. The structure of the model(CNN-GRU) is given in algorithm 1 and the flowchart is shown in Fig. 5.
Fig. 5.

Lung cancer detection model (CNN-GRU).
Algorithm 1.

Lung cancer detection model (CNN-GRU)
Experiments
Experimental setup
The model (CNN-GRU) was implemented by conducting several experiments to validate its performance. In these experiments, different data augmentation techniques such as rotation, and brightness were used for data pre-processing. The data set of LC was divided into 80% and 20% for training and testing using holdout cross-validation techniques. Moreover, evaluation metrics were computed for model performance evaluation. In the experimental setting, the hyperparameters were manually modified to improve model performance. The batch size was set to 32, 64, and 120, with 30, 50, and 60 epochs and a learning rate of 0.0001 and 0.001. In addition, a dropout rate of 0.2 was introduced to all experiments to prevent overfitting and improve generalization. These manually selected settings were determined based on empirical observations to obtain the best training stability and accuracy. All experiments were repeated with different hyperparameters until they obtained stable results and we only reported stable results. Also, various tools were employed for simulating these experimentations, such as Python with TensorFlow, and Keras. For the experiments, an Intel® Core™ i5-2400 CPU, 4 GB of RAM, and Windows 10 were used on the computer.
Results analysis
The experimental results are analyzed here.
Data pre-processing results
The original IQ-OTH/NCCD lung cancer dataset had 1097 images, with an imbalance between classes: 561 malignant, 120 benign, and 416 normal. To overcome this issue, data augmentation techniques such as rotations, and color brightness were used to boost the number of images in underrepresented categories. As a result, the enlarged dataset now has 1683 images, with each class balanced at 561 images, resulting in enhanced model performance and reduced bias towards the majority class.
CNN model results
The predictive capability of the CNN model was assessed through various experiments employing original and augmented datasets. The LC dataset has 1190 images of three classes(Malignant, Normal, and Benign). The data augmentation techniques rotations and color brightness were used. There are 1683 images included in the new dataset. The model was for 50 epochs, batch size was 120, and other hyperparameters(PR) for all experiments are listed in Table 2. Table 2 shows that the CNN architecture with the SGD optimizer at a rate of 0.0001 obtained 96.12% accuracy, 93.02% specificity, 95.24% sensitivity, 98.87% precision, and 97.73% F1 score. The CNN with the ADAM and at an LR of 0.0001 obtained accuracy (96.89%), specificity (99.78%), sensitivity (100%), precision(99.45%), and F1 score(98.78%). Results of the CNN model are graphically shown in Fig. 6.
Table 2.
CNN model results on original and augmented datasets.
| Dataset | PR | Metrics | |||||
|---|---|---|---|---|---|---|---|
| OP | Lr | Ac (%) | Sn (%) | Sp (%) | Pr (%) | FS (%) | |
| Original | sgd | 0.0001 | 96.12 | 95.24 | 93.02 | 98.87 | 97.73 |
| – | adam | – | 96.89 | 1005 | 00.78 | 99.457 | 98.78 |
| Augmented | sgd | 0.0001 | 96.78 | 98.54 | 99.78 | 99.23 | 98.03 |
| – | adam | – | 97.02 | 100.00 | 97.30 | 99.89 | 98.88 |
Fig. 6.

CNN model results on original dataset.
The results of the CNN model on the augmented data set are reported in Table 2. Table 2 shows that the CNN architecture with the SGD optimizer and at a learning rate of 0.0001 obtained 96.78% accuracy, 98.54% specificity, 99.78% sensitivity, 99.23% precision, and 98.03% F1 score. CNN architecture with the ADAM at a learning rate of 0.0001 obtained accuracy (97.02%), specificity (97.30%), sensitivity (100%), precision (99.89%), and F1 score (98.88%). Figure 7 shows graphically the results of the CNN model on the newly generated dataset.
Fig. 7.

CNN model results on the augmented dataset.
GRU model results
The results of the GRU model on the original data set are reported in Table 3. Table 3 demonstrated that the GRU model with the SGD optimizer and at a learning rate of 0.0001 obtained accuracy (97.00%), specificity(100.00%), sensitivity(97.07%), precision(99.00%), and F1 score (99.10%). The GRU with the ADAM same LR of 0.0001 obtained accuracy (98.23%), specificity(98.68%), sensitivity(100.00%), precision(97.00%), and F1 score(99.34%). Results of GRU architecture on the original dataset are shown graphically in Fig. 8.
Table 3.
GRU model results on original and augmented datasets.
| Dataset | PR | Metrics | |||||
|---|---|---|---|---|---|---|---|
| OP | Lr | Ac (%) | Sn (%) | Sp (%) | Pr (%) | FS (%) | |
| Original | sgd | 0.0001 | 97.00 | 97.07 | 100 | 99.00 | 99.10 |
| – | adam | – | 98.23 | 100.00 | 98.68 | 97.00 | 99.34 |
| Augmented | sgd | 0.0001 | 97.98 | 99.23 | 99.78 | 99.23 | 98.03 |
| – | adam | – | 98.97 | 100.00 | 99.80 | 99.96 | 98.95 |
Fig. 8.

Results of GRU model on original dataset.
The GRU model experimental results on augmented data are reported in Table 3. Table 3 presented that the GRU architecture with the SGD optimizer and at a learning rate of 0.0001 obtained accuracy(97.98%), specificity(99.78%), sensitivity(99.23%), precision(99.23%), F1 score (98.03%). GRU with the ADAM at an LR of 0.0001 obtained accuracy(98.97%), specificity(99.80%), 100.00% sensitivity, precision(99.96%), and F1-score(98.95%). Results of GRU architecture on the augmented dataset are shown graphically in Fig. 9.
Fig. 9.

Results of GRU model on augmented dataset.
Proposed (CNN-GRU) model results
The proposed model (CNN-GRU) has been evaluated experimentally using original and augmented data sets. The results of the models with SGD and ADAM optimizers are reported in Table 4. Table 4 demonstrated that the proposed architecture with the SGD optimizer obtained accuracy(98.95%), specificity(100%), sensitivity(99.87%), precision(97.04%), 98.99% F1 score. The model with the ADAM obtained accuracy(99.12%), specificity(99.89%), sensitivity(96.34%), precision(99.23%) , and F1 score(99.32%).
Table 4.
The (CNN-GRU) model results on original and augmented datasets: The number of trainable parameters in a model indicates its space complexity.
| Data set | Parameters | Model complexity | Metrics | ||||||
|---|---|---|---|---|---|---|---|---|---|
| Optimizer | Lr | TC | SC | Ac (%) | Sn (%) | Sp (%) | P r(%) | FS (%) | |
| Original | sgd | 0.0001 | 7.4h | 120M | 98.95 | 99.87 | 100.00 | 97.04 | 98.99 |
| – | adam | – | 8.20h | 128M | 99.12 | 96.34 | 99.67 | 99.23 | 99.32 |
| Augmented | sgd | 0.0001 | 9.5h | 132M | 98.99 | 98.54 | 99.78 | 99.73 | 99.33 |
| – | adam | – | 10.3h | 140M | 99.77 | 99.96 | 100.00 | 99.98 | 99.97 |
The letter M stands for a million. The space complexity (SC) increases as there are more trainable parameters. The time complexity (TC) of the models is defined as their training time (in hours).
on the other side With an augmented data set the model (CNN-GRU) results in Table 4 shows that the Proposed model with the SGD optimizer and at a learning rate of 0.0001 obtained accuracy(98.99%), specificity(98.78%), sensitivity(98.54%), precision(99.73%), F1 score(99.33%). The model with the ADAM at a learning rate of 0.0001 obtained accuracy(99.77%), specificity (100%), sensitivity(99.%), precision(99.98% ), and F1 score(99.97%). Results of the proposed model (CNN-GRU) on original and augmented datasets are shown graphically in Figs. 10 and 11.
Fig. 10.

Model (CNN-GRU) model results on original dataset.
Fig. 11.

Model (CNN-GRU) model results on augmented dataset.
The CNN-GRU mosel performance is validated with an independent CT-Scan images data set and the model is trained with an augmented IQ-OTH/NCCD data set under the parameters( Eposes=50, Batch size=120, LR=0.0001). The cross-validation results are reported in Table 5. The Model CNN-GRU with SGD optimizer achieved 98.97% accuracy, 97.40% specificity, 99.20% sensitivity, 96.64% precision, and 99.76% f1-score. While ADAM optimizer 99.68% accuracy, 99.78% specificity, 99.86 % sensitivity, 99.90% precision and 99.94% f1-score. The performance of the model with an independent CT-Scan images dataset is a little low as compared to the IQ-OTH/NCCD test data set as reported in Tables 4 and 5. These results show that the proposed model has the capability for generalization.
Table 5.
Model (CNN-GRU) cross-validation with CT-Scan images data set.
| Parameters | Metrics(%) | |||||
|---|---|---|---|---|---|---|
| Optimizer | Lr | Ac | Sp | Sn | Pr | FS |
| SGD | 0.0001 | 98.97 | 97.40 | 99.20 | 96.64 | 99.76 |
| ADAM | – | 99.68 | 99.78 | 99.86 | 99.90 | 99.94 |
From the above experimental results analysis we concluded that the model (CNN-GRU) with ADAM on augmented data achieved 99.77% accuracy. The high accuracy of the proposed model is due to the integration of the CNN and GRU models and the data augmentation approach.
Comparison of proposed model with baseline models using T-Test
The accuracy of the model compared with the baseline models in Table 6 and Fig. 12. The model achieved 99.77% accuracy as compared to baseline models. To statistically validate the proposed model(CNN-GRU) performance compared to a baseline, we incorporate hypothesis testing using T-tests (for two groups)30. The T-test determines whether the means of two independent models differ significantly from one another. The null hypothesis  states that the two groups’ means are equal. The alternative hypothesis
  states that the two groups’ means differ. If
  the proposed model significantly outperforms the baseline models and If
 , there is no significant difference between the proposed model and baseline models.
Table 6.
Accuracy comparison with baseline models.
Fig. 12.

Accuracy comparison with baseline models.
According to the T-Test, the P-value is equal to 0.000 which means that  and it demonstrates that the proposed model outperformance than baseline models. Due to high accuracy, we recommend the model for LC detection in AI-based healthcare systems.
Model complexity computation
The space and Time complexity of model CNN-GRU with optimizer SGD and ADAM with original and augmented data are reported in Table 4 for the detection of Lung cancer. The space complexity is analyzed by taking into account of model trainable parameters because the proposed model uses deep learning techniques. To compute the time complexity, we use the training time of the model. Table 4 presented that CNN-GRU has the worst space complexity since its trainable parameter is 140 million with ADAM optimizer on augmented data, while CNN-GRU has 7.4 hours the best space-time complexity with SDG on original data. Additionally, for the time complexity, the CNN-GRU model has the worst time complexity because its training time is 10.3h hours. Thus the proposed CNN-GRU model predictive accuracy is high but it is computationally more complex due to the complex structure, more training parameters, and huge training data. However, the complexity problem can be handled by using more high-performance technology such as GPU.
Discussion
Lung cancer is a critical clinical issue and around the world, many people are affected by it. The accurate and on-time diagnosis of lung cancer is a critical challenge for medical professionals and researchers. Lung cancer diagnosis on conventional methods is not effective for accurate and on-time diagnosis for reliable treatment and recovery. To tackle these issues researchers nowadays incorporate artificial intelligence mechanisms for initial stage diagnosis of lung cancer using medical big data such as patient medical history, MRI, and CT Scan image data. Deep learning, a major AI technology, requires big data to exhibit the self-learning procedure to multiple computations of data patterns that classify tumors into their related classes. However deep learning-based lung cancer diagnosis requires big and properly balanced label data for effective training and testing of the model. The deep learning model especially the convolutional neural network is a more suitable model for medical image analysis31. The CNN algorithm can extract more deep patterns from images for accurate image classification32. The gated recurrent units (GRU) model is also a suitable model for the analysis of medical imaging data as compared to LSTM for its computational efficiency, faster training, and lower memory requirements, making it ideal for large-scale medical imaging. With a simpler gating mechanism, GRU effectively captures long-term dependencies while requiring less computational power. Additional techniques of deep learning such as attention techniques and data augmentation techniques can also improve the predictive capability of the CNN model for precise diagnosis of Lung cancer in AI-based healthcare systems33.
In this study, we proposed a deep learning techniques-based integrated model(CNN-GRU) for lung cancer detection. In the designing of the model, the CNNs and GRUs models are integrated. The GRU captures temporal relationships between medical image sequences, such as multiple CT scans over time. To enhance the model’s capacity to identify subtle patterns and progressions, the GRU monitors changes in lung tissue and tumor growth while the Convolutional Neural Network (CNN) extracts spatial data. The model is enhanced in accuracy and efficacy by integrating CNN’s spatial analysis with GRU’s sequential learning. The (CNN-GRU) model was validated using LC image data. The hold-out validation technique was used for the training and testing of the model. Moreover, evaluation metrics were applied for the evaluation of the model. The optimization algorithm SGD and ADAM are incorporated during the model’s training. According to the experimental results in Tables 4 and 5. The CNN-GRU model with SGD optimizer obtained accuracy(98.95%), specificity(100%), sensitivity(99.87%), precision(97.04%), 98.99% F1 score. The model with the ADAM obtained accuracy(98.12%), specificity(99.89%), sensitivity(96.34%), precision(99.23%), and F1 score(99.32%) results on original data as reported in Table 4.
On the other side with an augmented data set the model (CNN-GRU) results in Table 4 shows that the model with the SGD optimizer and at a learning rate of 0.0001 obtained accuracy(98.99%), specificity(98.78%), sensitivity(98.54%), precision(99.73%), F1 score(99.33%). The model with the ADAM at a learning rate of 0.0001 obtained accuracy(99.77%), specificity (100%), sensitivity(99.%), precision(99.98% ), and F1 score(99.97%).
The integrated model with augmented data increased accuracy from 99.12% to 99.77% with Adam optimizer. The improved accuracy of the proposed model demonstrated that the structure of the model is well suited for deep pattern recognition and classification of images. From the results analysis, we concluded that the proposed model is more suitable for accurate diagnosis of Lung cancer in AI-based health care systems.
However, the prospered model obtained greater accuracy, but it had significant technological limitations. It requires huge well-structured data and is computationally intensive, restricting its application in resource-constrained situations. Differences in images have an impact on generalization, and overfitting persists. Furthermore, this work did not investigate sophisticated data augmentation such as elastic deformations, random cropping, and adversarial training, and deep learning methods such as transfer learning and federated learning, which could improve model resilience and flexibility. The proposed CNN-GRU model predictive accuracy is high as compared to the baseline model but it is computationally more complex due to the complex structure, more training parameters, and huge training data. However, the complexity problem can be handled by using more high-performance technologies.
Furthermore, deploying AI in healthcare faces challenges such as integration with existing workflows, data privacy compliance, and regulatory approvals. Issues like model bias, interpretability, and clinician trust must also be addressed for successful adoption.
To overcome these limitations, future research should explore the integration of advanced techniques, such as multi-modal data fusion, transfer learning, and more sophisticated model architectures. Additionally, efforts should be made to enhance the model’s generalization capabilities and interpretability, ensuring that it can be applied effectively across diverse patient populations. By addressing these challenges, a more reliable, accurate, and scalable model for lung cancer diagnosis can be developed, ultimately advancing healthcare systems and improving patient outcomes.
Conclusion
To the best of our knowledge, lung cancer (LC) is a critical disease, and early detection is crucial for effective treatment. So an accurate LC diagnosis is a big medical problem in the AI-based healthcare systems. Researchers have proposed various deep learning-based models to tackle the problem of accurate diagnosis of LC. However, these models still need further improvement to accurately diagnose LC. To tackle this problem of accurately detecting lung cancer, we proposed a deep learning techniques-based integrated model (CNN-GRU). The proposed model development combines the (CNNs) and (GRUs) models to create an intelligent model (CNN-GRU) for LC diagnosis. The CNN model is employed to get spatial features of the images through several convolutional and pooling operations. The extracted features from data are embedded in the GRUs model for the final prediction of LC. The proposed (CNN-GRU) model was validated using LC data using the holdout validation technique. The SGD and ADAM optimization algorithms were incorporated during model training to optimize model training parameters. The experimental results of the model presented that the model reached 99.77% accuracy as compared to baseline models. Due to higher diagnosis accuracy, we recommend the (CNN-GRU) model for accurate detection of Lung cancer in AI-based healthcare systems. Transfer learning and federated learning approaches and more advanced data augmentation techniques including elastic deformations, random cropping, and adversarial training will be employed in the future to develop a more reliable model for LC diagnosis in AI-based healthcare systems.
Acknowledgements
The authors extend their appreciation to the Deanship of Scientific Research at Northern Border University, Arar, KSA for funding this research work through the project number ‘‘NBU-FFR-2025-1850-05, and Princess Nourah bint Abdulrahman University Researchers Supporting Project number (PNURSP2025R303), Princess Nourah bint Abdulrahman University, Riyadh, Saudi Arabia.
Author contributions
Conceptualization, Wang Jian (W.J), Amin ul Haq (A.U.H.), Noman Afzal (N.A), and Shakir Khan (S.K), Hadeel Alsolai (H.A) software, A.U.H.; validation, A.U.H., Sultan M. Alanazi(S.M.A), N.A, Abu Taha Zamani(A.T.Z), W.J, data curation, A.U.H., S.K., H.A, W.J, writing-original draft preparation, A.U.H.; writing-review and editing, W.J, A.U.H., N.A, A.H, S.M.A, A.T.Z, S.K.; visualization, W.J, A.U.H, N.A, A.T.Z, S.M.A, S.K.; supervision, W.j; project administration, A.U.H.; funding acquisition, W.J. All authors have read and agreed to the published this manuscript.
Data availability
The data sets used in this work are available at the Kaggle repository: IQ-OTH/NCCD (https://www.kaggle.com/datasets/adityamahimkar/iqothnccd-lung-cancer-dataset) and CT-Scan images (https://data.mendeley.com/datasets/p2r42nm2ty/2)
Declarations
Competing interest
The authors declare no competing interests.
Footnotes
Publisher’s note
Springer Nature remains neutral with regard to jurisdictional claims in published maps and institutional affiliations.
References
- 1.Vos, T. et al. Global burden of 369 diseases and injuries in 204 countries and territories, 1990–2019: a systematic analysis for the global burden of disease study 2019. The Lancet396, 1204–1222 (2020). [DOI] [PMC free article] [PubMed] [Google Scholar]
- 2.De Koning, H., Van Der Aalst, C., Ten Haaf, K. & Oudkerk, M. Pl02. 05 effects of volume ct lung cancer screening: mortality results of the nelson randomised-controlled population based trial. J. Thorac. Oncol.13, S185 (2018). [Google Scholar]
- 3.Kramer, B. S., Berg, C. D., Aberle, D. R. & Prorok, P. C. Lung cancer screening with low-dose helical ct: results from the national lung screening trial (nlst) (2011). [DOI] [PMC free article] [PubMed]
- 4.Snoeckx, A. et al. The radiologist’s role in lung cancer screening. Trans. Lung Cancer Res.10, 2356 (2021). [DOI] [PMC free article] [PubMed] [Google Scholar]
- 5.Ozdemir, B. & Pacal, I. An innovative deep learning framework for skin cancer detection employing convnextv2 and focal self-attention mechanisms. Res. Eng.25, 103692 (2025). [Google Scholar]
- 6.Wang, S. et al. Artificial intelligence in lung cancer pathology image analysis. Cancers11, 1673 (2019). [DOI] [PMC free article] [PubMed] [Google Scholar]
- 7.Bayram, B., Kunduracioglu, I., Ince, S. & Pacal, I. A systematic review of deep learning in mri-based cerebral vascular occlusion-based brain diseases. Neuroscience (2025). [DOI] [PubMed]
- 8.Pacal, I. Investigating deep learning approaches for cervical cancer diagnosis: a focus on modern image-based models. European Journal of Gynaecological Oncology 46 (2025).
- 9.Pacal, I., Ozdemir, B., Zeynalov, J., Gasimov, H. & Pacal, N. A novel cnn-vit-based deep learning model for early skin cancer diagnosis. Biomed. Signal Process. Control104, 107627 (2025). [Google Scholar]
- 10.Maleki, N., Zeinali, Y. & Niaki, S. T. A. A k-nn method for lung cancer prognosis with the use of a genetic algorithm for feature selection. Expert Syst. Appl.164, 113981 (2021). [Google Scholar]
- 11.Nasser, I. M. & Abu-Naser, S. S. Lung cancer detection using artificial neural network. Int. J. Eng. Inform. Syst. (IJEAIS)3, 17–23 (2019). [Google Scholar]
- 12.Gao, Z., Tian, Y., Lin, S.-C. & Lin, J. A ct image classification network framework for lung tumors based on pre-trained mobilenetv2 model and transfer learning, and its application and market analysis in the medical field. arXiv preprint arXiv:2501.04996 (2025).
- 13.Priya, A. & Bharathi, P. S. Se-resnext-50-cnn: A deep learning model for lung cancer classification. Applied Soft Computing 112696 (2025).
- 14.Moitra, D. & Mandal, R. K. Classification of non-small cell lung cancer using one-dimensional convolutional neural network. Expert Syst. Appl.159, 113564 (2020). [Google Scholar]
- 15.Asuntha, A. & Srinivasan, A. Deep learning for lung cancer detection and classification. Multimedia Tools Appl.79, 7731–7762 (2020). [Google Scholar]
- 16.Pacal, I. Improved vision transformer with lion optimizer for lung diseases detection. Int. J. Eng. Res. Dev.16, 760–776 (2024). [Google Scholar]
- 17.Kavitha, M., Vidhya, K., Sreeja, S., Roopashri, G. & Muhil, P. Automated lung disease detection, classification and prediction using rnn framework. In E3S Web of Conferences, vol. 491, 03015 (EDP Sciences, 2024).
- 18.Ozdemir, B., Aslan, E. & Pacal, I. Attention enhanced inceptionnext-based hybrid deep learning model for lung cancer detection. IEEE Access13, 27050–27069. 10.1109/ACCESS.2025.3539122 (2025). [Google Scholar]
- 19.Khoirunnisa, A. et al. Implementation of crnn method for lung cancer detection based on microarray data. JOIV Int. J. Informatics Visual.7, 600–605 (2023). [Google Scholar]
- 20.Hatuwal, B. K. & Thapa, H. C. Lung cancer detection using convolutional neural network on histopathological images. Int. J. Comput. Trends Technol68, 21–24 (2020). [Google Scholar]
- 21.Wankhade, S. & Vigneshwari, S. A novel hybrid deep learning method for early detection of lung cancer using neural networks. Healthcare Analy.3, 100195 (2023). [Google Scholar]
- 22.Vemula, S. T. et al. Deep learning techniques for lung cancer recognition. Eng. Technol. Appl. Sci. Res.14, 14916–14922 (2024). [Google Scholar]
- 23.Crasta, Lavina Jean & Rupal Neema, A. .R. . P. A novel deep learning architecture for lc detection and diagnosis from computed tomography image analysis. Healthcare Analy.5, 100316 (2024). [Google Scholar]
- 24.Shah, A. A., Malik, H. A. M., Muhammad, A., Alourani, A. & Butt, Z. A. Deep learning ensemble 2d cnn approach towards the detection of lung cancer. Sci. Rep.13, 2987 (2023). [DOI] [PMC free article] [PubMed] [Google Scholar]
- 25.HASAN, M. A., Bhargav, T., SANDEEP, V., REDDY, V. S. & AJAY, R. Image classification using convolutional neural networks. Int. J. Mechan. Eng. Res. Technol.16, 173–181 (2024). [Google Scholar]
- 26.Dey, R. & Salem, F. M. Gate-variants of gated recurrent unit (gru) neural networks. In 2017 IEEE 60th international midwest symposium on circuits and systems (MWSCAS), 1597–1600 (IEEE, 2017).
- 27.Aboor, A. et al. Ddfc: deep learning approach for deep feature extraction and classification of brain tumors using magnetic resonance imaging in e-healthcare system. Sci. Rep.14, 6425 (2024). [DOI] [PMC free article] [PubMed] [Google Scholar]
- 28.Haq, A. et al. A survey of deep learning techniques based parkinson’s disease recognition methods employing clinical data. Expert Syst. Appl.208, 118045 (2022). [Google Scholar]
- 29.Haq, A. U. et al. Mcnn: a multi-level cnn model for the classification of brain tumors in iot-healthcare system. J. Ambient. Intell. Humaniz. Comput.14, 4695–4706 (2023). [DOI] [PMC free article] [PubMed] [Google Scholar]
- 30.Aminulhaq, Li, J., Memon, M. H., Khan, J. & Ud Din, S. A novel integrated diagnosis method for breast cancer detection. J. Intell. Fuzzy Syst.38, 2383–2398 (2020). [Google Scholar]
- 31.Sultan, H. H., Salem, N. M. & Al-Atabany, W. Multi-classification of brain tumor images using deep neural network. IEEE Access7, 69215–69225 (2019). [Google Scholar]
- 32.AminulHaq,. Iimfcbm: Intelligent integrated model for feature extraction and classification of brain tumors using mri clinical imaging data in iot-healthcare. IEEE J. Biomed. Health Inform.26, 5004–5012 (2022). [DOI] [PubMed] [Google Scholar]
- 33.Haq, A. U. et al. Stacking approach for accurate invasive ductal carcinoma classification. Comput. Electr. Eng.100, 107937 (2022). [Google Scholar]
Associated Data
This section collects any data citations, data availability statements, or supplementary materials included in this article.
Data Availability Statement
The data sets used in this work are available at the Kaggle repository: IQ-OTH/NCCD (https://www.kaggle.com/datasets/adityamahimkar/iqothnccd-lung-cancer-dataset) and CT-Scan images (https://data.mendeley.com/datasets/p2r42nm2ty/2)