

Abstract
The development and testing of cancer therapies, such as oncolytic viro-immunotherapy, starts with 2-dimensional cell culture models, such as monolayers from lab-adapted cell lines. Although 2D models have been valuable, 3-dimensional models such as spheroids and patient-derived organoids (PDOs) better recapitulate tumor characteristics and may have higher predictive value for oncolytic viro-immunotherapy. Evaluating monolayers, spheroids, and PDOs for their response to oncolytic viro-immunotherapy using Newcastle Disease Virus (NDV) as an example may improve understanding of how model choice impacts outcomes. Monolayers, spheroids, and PDOs of Pancreatic Ductal Adenocarcinoma (PDAC) origin were evaluated for their response to NDV by assessing infection, replication, and virus-induced cell death. In spheroids and dense PDOs, NDV mainly infected the outer cell layer and did not spread to the inner layers. Cystic PDOs vary in susceptibility to NDV infection, replication, and virus-induced cell death, likely due to differences in genetic makeup. Evaluation of PDAC monolayers, spheroids, and PDOs revealed differences in NDV-induced cell death. Spheroids and dense PDOs may be more suitable than monolayers for evaluating virus infection. PDOs, regardless of morphology, reflect patient tumor genetics and might be a better model to identify markers to OV-induced cell death, advancing personalized oncolytic viro-immunotherapy approaches.
Subject terms: Cancer, Cancer models, Preclinical research
Introduction
One potential treatment option for cancer is oncolytic viro-immunotherapy. This treatment modality is based on viruses that induce tumor-selective cell death and an antitumor immune response as a result of tumor cell lysis, frequently referred to as oncolytic viruses (OVs)1. The dual anti-cancer activity of viro-immunotherapy makes this an interesting treatment modality with potential advantages over immunotherapy alone. Most in vitro investigations of the cell-death capacity of OVs have so far been performed using 2-dimensional (2D) cell cultures, often consisting of monolayers generated from lab-adapted cell lines. Although the importance of these studies should not be underestimated, recent literature shows that 3-dimensional (3D) models contain more patient tumor-representative characteristics2,3. An example of an extensively studied 3D model are spheroids. Spheroids can be defined as cell line-derived cells grown under culture conditions that allow the formation of 3D cell aggregates and thus represent more tumor-like structures compared to cell lines. The outer layer of a spheroid is exposed to adequate oxygen and nutrition levels, resulting in cell proliferation, whereas cells in the core layers are quiescent as metabolic activity is reduced when the distance to the periphery of the spheroid increases4,5. For large spheroids (> 400 μm diameter), cells in the core become necrotic as a result of limited oxygen supply and access to nutrients. This spheroid-typical cell-layer gradient and its consequential changes in signal pathway activity and gene expression have also been observed in patients with solid avascular tumors5. These similarities to solid avascular tumors make spheroids a relevant 3D model for screening oncolytic virus efficacy. Another well-known 3D model is patient-derived organoids (PDOs). Tumor PDOs consist of patient-derived cancer cells present in an extracellular matrix protein-rich hydrogel that allows the self-organization of cells into 3D structures6,7. Tumor PDOs have been shown to preserve the characteristics of the source cancer tissue, such as genomic and transcriptomic profiles and cell morphology, even after long-term culturing8. Due to the close resemblance of the original patient tissue, tumor PDOs are often used as a predictive model for sensitivity to oncolytic viro-immunotherapies9,10.
Here, we compared the susceptibility of monolayer (2D), spheroid (3D), and PDOs (3D) Pancreatic Ductal Adenocarcinoma (PDAC) origin to infection, replication, and cell death capacity of Newcastle Disease Virus (NDV). This study provides more insight into the application of 2D and 3D models in OV research.
Results
Establishing and characterizing HPAC monolayer and spheroid cultures
Spheroids were generated from HPAC cell lines HPAF-II, BxPX-3, and Panc-1, according to previously established protocols with some optimization11. These cell lines were selected based on their distinct sensitivity to NDV in monolayer cultures, as demonstrated in a previous study12. The cell line culture medium for these pancreatic cancer cell lines is often RPMI, which was exchanged for DMEM, as this is known to enhance cell adherence and thus spheroid formation13–15. To further improve the formation of single spheroids per well, plates were placed on an orbital shaker for two days directly after seeding cells, followed by another 2 days of incubation. These methods ensured efficient formation of spheroids within four days after seeding (Fig. 1A).
Fig. 1.
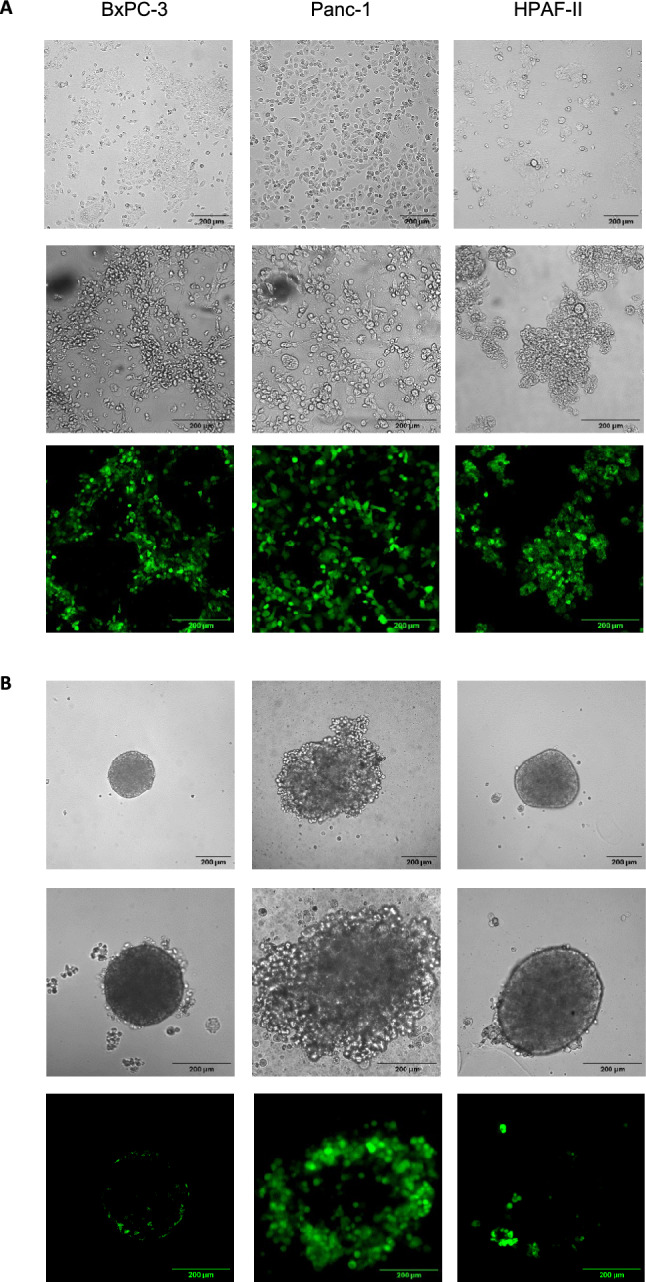
Infection of HPAC monolayers and spheroids upon inoculation with rNDV F0-GFP. HPAC cell lines HPAF-II, Panc-1 and BxPC-3 were used to generate A) monolayers or B) spheroids. For both monolayers and spheroids, representative brightfield pictures were taken at 10 × magnification (top row; scale bar = 200 μm). Afterwards, monolayers and spheroids were inoculated with NDV-F0-GFP at an MOI of 100. One day post inoculation representative brightfield pictures (middle row) and their corresponding Z-stacks of GFP signal displayed as z-axis projections (bottom row) were taken. All brightfield pictures and Z-stacks were taken at 20 × magnification (scale bar = 200 μm). Z-axis projections were created of the average GFP signal intensity of each slice in Z-stacks.
For monolayers, differences in morphology were observed among the three cell lines. For example, the HPAF-II and BxPC-3 monolayers tended to aggregate more than the Panc-1 monolayer. For the spheroids, HPAF-II and BxPC-3 had smaller diameters than Panc-1 spheroids, although the same number of cells were seeded, further displaying their tendency to aggregate. HPAF-II and BxPC-3 spheroids had similar morphologies, both containing a smooth outer layer, while the Panc-1 spheroids had an uneven outer layer (Fig. 1A).
Evaluating the sensitivity of HPAC monolayers and spheroids to NDV-induced oncolytic effects
To compare the permissiveness to NDV infection, monolayers and spheroids of the three cell lines were inoculated with rNDV-F0-GFP at an MOI of 100, and GFP expression was visualized 24 h post inoculation. High GFP signals were observed in all three inoculated monolayers (Fig. 1A).
GFP signals were not observed in the inner layers of any of the spheroids. In HPAF-II spheroids, no signal was observed in the outer layer of these spheroids, except for some cells that grew out of the outer layer (Fig. 1B). In Panc-1 and BxPC-3 spheroids, GFP signals were observed in the outer layer, whereby more GFP signals were detected in the outer layer of the Panc-1 spheroid than in the outer layers of BxPC-3 (Fig. 1B and Figure S1). These results indicate that upon inoculation with NDV, fewer cells were infected in spheroids than in monolayers at 24 h post inoculation. At this MOI, most cells in the monolayer were successfully infected, whereas only the outer layer showed infection in spheroids. Notably, GFP signals were limited at later time points in spheroids.
Next, the replication kinetics of rNDV F0-GFP was assessed in both spheroids and monolayers, with Vero cells serving as a positive control because of their known permissiveness for NDV. Monolayers were inoculated with rNDV F0-GFP at an MOI of 0.1, whereas the spheroids were inoculated at an MOI of 1. A lower MOI was selected for monolayers because they are more sensitive to infection than spheroids. In the monolayers, as well as in the Vero cells, rNDV F0-GFP replicated to high titers, whereas in the supernatant of inoculated spheroids derived from the same cell lines, a decrease in viral titers was observed over time. Specifically, viral titers in the supernatants of inoculated HPAF-II and BxPC-3 spheroids were no longer detectable after 72 h. Viral titers in supernatants of inoculated Panc-1 spheroids did not increase over time but remained stable and declined slightly (Fig. 2A). This increase in viral titers over time following low-MOI inoculation in monolayers indicates that NDV was not only able to infect but also to replicate and spread to neighboring cells in this model. This efficient spread contrasts with spheroids, where no increase in titer was observed, likely due to physical barriers limiting viral dissemination.
Fig. 2.

Sensitivity of HPAC monolayers and spheroids to rNDV F0-GFP replication and induced cell death. A) Replication kinetics of rNDV F0-GFP in Panc-1, BxPC-3 and HPAF-II monolayers and spheroids. Monolayers were inoculated at an MOI of 0.1, while spheroids were inoculated at an MOI of 1. Virus titers in supernatants collected at the indicated time points were determined in Vero cells. B) Cell viability upon inoculation with rNDV F0-GFP. Monolayers and spheroids were either mock-inoculated (control) or inoculated with rNDV F0-GFP at various MOIs. Cell viability was assessed five days post inoculation using the CellTiter-Glo 3D Cell Viability assay and is presented as a fraction of the mock control. The dotted line displays 50% cell viability, representing the EC50 value threshold. C) Cell viability upon repeated inoculation with rNDV F0-GFP. Spheroids were inoculated with rNDV F0-GFP at an MOI of 100 or 300, or mock-inoculated (control), for three consecutive rounds. Cell viability was measured 72 h after each inoculation using the CellTiter-Glo 3D Cell Viability assay and is displayed as a fraction of the mock control. Experiments were conducted in triplicate, with mean values and standard deviations depicted.
To assess NDV-induced cell death in these models, both monolayers and spheroids were inoculated with rNDV F0-GFP at a range of MOIs. Cell viability was measured 120 h post inoculation, followed by calculation of the half-maximal effective concentration (EC50) value, serving as an indirect measurement of NDV-induced cell death. In the three monolayers, an EC50 value lower than an MOI of 10 was obtained, with Panc-1 showing an EC50 value as low as 1. However, in all spheroids, although virus-induced cell death was observed over time in a dose-dependent manner, 50% cell death was not observed, even after inoculation at an MOI of 100 (Fig. 2B). Overall, these data showed that NDV-induced cell death was more effective in the monolayers than in the spheroids, potentially due to a lack of virus spread towards the core layers of the spheroids.
In the clinical setting, patients often undergo a treatment regimen consisting of multiple repeated applications of oncolytic viro-immunotherapy. To mimic this clinical treatment regimen and to assess the potential increases in cell death, spheroids were inoculated three times with NDV at an MOI of 100, and viability was measured 72 h after each subsequent inoculation. This interval was based on various other studies that used this timeframe for repeated immunotherapy treatments in in vivo cancer models16,17. As single inoculations at an MOI of 100 resulted in the greatest cell death compared to lower MOIs, this dosage was used to assess the effects of repeated inoculations on spheroid viability. In all three spheroids, the cell viability decreased after each subsequent inoculation (Fig. 2C). To potentially increase NDV-induced cell death after repeated inoculations, spheroids were also inoculated repeatedly at an MOI of 300. However, this did not result in lower cell viability compared with an MOI of 100. Altogether, these data show that repeated inoculation with NDV reduced the viability of these spheroids.
Establishing and characterizing PDAC PDO cultures
Seven PDOs were generated from patients with resectable PDAC who were treatment-naïve or received neoadjuvant FOLFIRINOX chemotherapy at the time of resection. Analysis of the resected tumor material by the pathologist confirmed its cancerous origin. Primary tumors of PDO-1, −2, and −7 received neoadjuvant FOLFIRINOX treatment, whereas the remaining primary tumors were treatment-naïve. PDO-1, −2, −3, −5, and −6 had a cystic morphology, characterized by a liquid-filled lumen structure, where the outer layer of the cystic 3D structures differed in thickness between these PDOs. Notably, PDO-1 and PDO-6 contain several cells within the lumen, although the exact cause of this phenomenon remains unclear. PDO-4 and −7 had dense morphologies, characterized by cellular aggregates without a lumen (Fig. 3 top row). In general, dense PDOs have smaller diameters than cystic PDOs. All PDOs were cultured in organoid growth media containing key growth factors, as previously established18 however, adjustments were made. Recombinant RSPONDIN, NOGGIN, and WNT were used instead of conditioned media to prevent the addition of serum to the organoid media. The inclusion of these proteins led to the formation of serum-free organoid growth medium.
Fig. 3.

Infection of PDOs with rNDV F0-GFP. Top rows: Representative bright-field images of patient-derived organoids (PDOs). PDO-1, 2, 3, 5 and 6 displayed a cystic morphology, while PDO-4 and 7 had a dense morphology. Brightfield images were taken at 10 × magnification when the organoids were confluent enough for passaging (top row; scale bar = 200 µm). Middle and bottom rows: PDOs were inoculated with rNDV F0-GFP at an MOI of 0.1. Two-days post inoculation, both representative brightfield pictures (middle row) and Z-stacks of GFP signal, displayed as z-axis projections (bottom row), were taken at 20 × magnification (scale bar = 200 μm). Z-axis projections were created of the average GFP signal intensity of each slice in Z-stacks.
PDAC PDO morphology and their sensitivity to NDV-induced direct oncolytic effects
To assess the permissiveness of PDOs to rNDV F0-GFP infection, PDOs were inoculated at an MOI of 0.1 and imaged 48 h post inoculation. This low MOI was chosen as a pilot study, which revealed that our panel of PDOs was more sensitive to NDV-induced cell death than spheroids. The lower MOI ensured sufficient viable cells upon imaging 48 h post inoculation, a timeframe often used to assess several parameters of the virus replication cycles, including virus infection19. In PDO-1, −4, −5, and −7, low GFP signals were detected relative to the number of 3D structures present in the brightfield images (Fig. 3 bottom and middle row, respectively; and Figure S2). In contrast, strong GFP signals were detected in PDO-2, −3, and −6 relative to the number of 3D structures present in the brightfield images. Comparison between the top and middle row of each PDO in Fig. 3 revealed the cytopathic effects induced by NDV. These effects, which often include cell rounding, aggregation, and structural collapse, were most prominent in PDO-3. In PDO-1, −4, −5, and −7, low GFP signals were detected relative to the number of 3D structures present in the bright field images. In contrast, strong GFP signals were detected in PDO-2, −3, and −6 relative to the number of 3D structures present in the brightfield images (bottom row of each PDO in Fig. 3, Figure S2). All data regarding the neoadjuvant treatment status and morphology of PDOs and their permissiveness to NDV infection, replication, and sensitivity to NDV-induced cell death are summarized in Table 1.
Table 1.
Overview of neoadjuvant treatment status, morphological characteristics, infection, replication, and induced cell death of NDV in various PDOs. The neoadjuvant treatment status of the primary tumor from which the PDOs were derived was categorized as either treatment-naïve or FOLFIRINOX. The morphology of PDOs was categorized as either cystic or dense based on their phenotypical characteristics. Infection efficiency was determined to be low or high based on GFP signals at 48 h after inoculation. Viral replication was noted as low (+), moderate (+ +) or high (+ + +). Virus-induced cell death was quantified based on the calculated EC50 value.
| PDO | Neoadjuvant | Morphology | Infection | Replication | EC50 |
|---|---|---|---|---|---|
| 1 | FOLFIRINOX | Cystic | Low | + + | 166.50 |
| 5 | Naïve | Cystic | Low | + + | 9.61 |
| 4 | Naïve | Dense | Low | + | 1.99 |
| 2 | FOLFIRINOX | Cystic | High | + + + | 1.14 |
| 7 | FOLFIRINOX | Dense | Low | + | 0.8 |
| 6 | Naïve | Cystic | high | + + + | 0.02 |
| 3 | Naïve | Cystic | High | + + + | 0.01 |
As 80% BME hydrogel forms a barrier that restricts the release of virus particles from PDOs into the supernatant, the concentration of BME hydrogel needs to be optimized to balance the viability of the PDOs with efficient virus release into the supernatant. To this end, PDO-2 was cultured in various BME hydrogel concentrations, ranging from 20 to 80%, after inoculation with NDV at an MOI of 3, which was selected to ensure sufficient virus infection of the PDO. Supernatants were collected from the inoculated PDOs 48 h post inoculation. Titration of these samples revealed the highest virus titers in PDOs cultured in the 40% BME hydrogel compared to the virus titers obtained when culturing the PDOs in the other BME hydrogel concentrations (Fig. 4A). PDOs cultured in 40% BME hydrogel without inoculation remained viable and proliferating, as confirmed by bright-field microscopy. Analysis of viral replication kinetics in PDO-1 and PDO-2 cultured in either 40% or 80% BME showed similar replication kinetics, but viral titers in the supernatant were higher in PDOs cultured in 40% BME (Fig. 4B).
Fig. 4.

rNDV F0-GFP-induced cell death of PDOs. A) Virus release in the supernatant upon inoculation of PDO-2 at an MOI of 3 and cultured in different concentrations of BME hydrogel. Supernatants were collected at 48 h post inoculation an virus titers were determined in Vero cells. B) Replication kinetics of rNDV F0-GFP in PDO-1 and −2 using 40% or 80% BME hydrogel. PDOs were inoculated at an MOI of 3 and virus titers in supernatant collected at the indicated time points were determined in Vero cells. C) Replication kinetics of rNDV F0-GFP in PDOs upon inoculation at an MOI of 0.1. Samples were collected at indicated time points and titrated in Vero cells. D) PDO-2 was mock-inoculated (control) or inoculated with rNDV F0-GFP at MOI 1 and cultured in 40% and 80% BME hydrogel. Cell viability was measured 120 h post inoculation, using the CellTiter-Glo 3D Cell Viability assay. E) All PDOs were mock-inoculated (control) or inoculated with rNDV F0-GFP at indicated MOIs. Cell viability was measured 120 h post inoculation. A dotted line was added at 50% viability, representing the EC50 value threshold. Data are presented as the percentage of surviving cells compared to mock-treated cells that were considered 100% viable. Experiments were conducted in triplicate and mean and standard deviation are depicted.
Next, the replication kinetics of NDV were evaluated in all PDOs cultured in 40% BME hydrogel at an MOI of 0.1. In PDO-4 replication was observed up to 24 h, and in PDO-7 only limited replication was observed at 12 h, with declining titers in both PDOs after that. In PDO-1, −2, −3, −5, and −6, an increase in viral titers up to 72 h post inoculation was observed, although replication in PDO-1 was less efficient than in the other PDOs (Fig. 4C). The lower MOI used in this experiment, in contrast to the higher MOI in Fig. 4B, allowed more sensitive detection of differences in replication between PDOs, which may explain the more pronounced discrepancy in replication kinetics observed between PDO-1 and PDO-2. The replication kinetics of NDV correlated with the GFP signals detected in Fig. 3. For example, in PDO-2 and −3, which supported efficient NDV replication, more GFP signal was detected relative to the number of 3D structures than in PDO-4 and −7, which did not support efficient replication. PDO-1 and −5, displaying low GFP signals upon inoculation, did support replication, but to a lesser extent than those that displayed high GFP signals upon inoculation. In conclusion, variability in replication kinetics was observed and the most efficient replication was measured in PDO-2, −3, and −6.
To correlate virus-induced cell death with viral replication, cell viability upon virus inoculation was first compared in PDOs cultured in 40% and 80% BME hydrogels. To this end, PDO-2 was inoculated with NDV at an MOI of 1 and cultured in 40% and 80% BME hydrogels. This MOI was selected to achieve sufficient viral infection without causing excessive cytotoxicity, allowing a robust comparison of the impact of BME hydrogel concentrations on virus-induced cell death. No differences in viability were detected between cultures in 40% and 80% BME hydrogels (Fig. 4D), indicating that virus-induced cell death was similar for PDOs cultured in 40% and 80% BME hydrogels. Therefore, NDV-induced cell death was assessed in PDOs cultured in 80% BME hydrogel to ensure an optimal environment for the PDOs.
To assess NDV-induced cell death for all PDOs, they were inoculated with rNDV F0-GFP at a range of MOIs. Cell viability was measured 120 h post inoculation, followed by calculation of the EC50 value. For the PDOs in which the highest virus replication was observed (PDO-3 and −6), the measured EC50 values were lower than the lowest tested MOI of 0.1 (Fig. 4E). For PDO-2, which supported replication slightly less efficiently than PDO-3 and −6, the EC50 value was slightly lower than that of an MOI of 1. Surprisingly, PDO-4 and −7, which did not support efficient replication, showed sensitivity to NDV-induced cell death with EC50 values between MOI 1 and 10. For the PDOs that were less supportive of NDV replication (PDO-1 and −5), the measured EC50 values were above an MOI of 100 and 10, respectively. Overall, the data revealed that in cystic PDOs, permissiveness of replication kinetics was correlated with their sensitivity to induced cell death. However, this correlation was not observed in PDOs with dense morphology. Although PDO’s were more sensitive to rNDV F0-GFP-induced cell death than spheroids, PDOs varied in permissiveness to NDV infection, replication, and induced cell death.
Discussion
The ability of OVs to induce cell death has been shown in various monolayer cancer cell lines12,13,20,21. However, cell lines are often adapted to laboratory conditions, and thus might not accurately recapitulate the original patient material22. Results obtained in in vitro models often poorly translate to the in vivo setting, leading to low translational efficiency. Therefore, near-patient models are needed to increase translational efficiency. Several studies have reported the use of different near-patient models for the evaluation of the cell-death capacity of adenovirus and reovirus, including spheroids for glioblastoma and prostate cancer, PDOs of pancreatic, breast, and renal cancer patients, and ex-vivo tumor slices from prostate cancer19,23–27. However, the sensitivity of various pancreatic cancer near-patient-models to NDV has not been compared before. Therefore, we aimed to compare the sensitivity of pancreatic cancer monolayers, spheroids, and PDOs to the direct cell-death effects of NDV. This comparison revealed variability in NDV-induced oncolytic effects among the three models and demonstrated that the morphology of the model affects its sensitivity to these effects.
Exploring multiple in vitro models requires careful selection of culture conditions, MOIs, and imaging time points in order to accurately assess viral infection and replication. The choice of MOIs and imaging time points play an important role in balancing viral infection, replication, and induced cell death. For spheroids, higher MOIs were often used to assess virus infection and replication compared to PDOs, as our pilot studies revealed that spheroids were less permissive to NDV infection and replication and less sensitive to NDV-induced cell death, necessitating the addition of more virus to the spheroids to observe an effect. Furthermore, earlier imaging times were selected for spheroids than for PDOs, as pilot experiments revealed limited virus replication and spread into the core of the spheroids, leading to minimal signs of infection and replication at later time points. In contrast, PDOs were more permissive to viral replication and widespread distribution of the virus throughout the 3D structure, allowing assessment of both infection and replication at a later time point. Similar MOIs and imaging time points have been used in other studies evaluating virus infection and replication kinetics in spheroids and PDOs of cancer origin, including investigations of oncolytic viruses, such as Myxoma, Measles, Vaccinia, and Vesicular Stomatitis viruse19,28,29.
The BME hydrogel might form a barrier for the spread of some OVs, as has been observed with Herpes Simplex Virus in hydrogel-based 3D cultures of breast and prostate cancer cells9,30 We observed a limited release of virus particles in the supernatant of PDOs cultured in the 80% BME hydrogel. Therefore, we optimized the BME hydrogel concentration to enhance PDO viability and maximize NDV release into the supernatant. This resulted in the use of the 40% BME hydrogel as the optimal concentration for detecting virus particles in the supernatant with optimal viability of the PDO. However, there was no difference in virus-induced cell death in either 40 or 80% BME hydrogel, indicating that the hydrogel layer only restricted passage of the virus through the hydrogel, but not virus-induced cell death.
Monolayers generated from HPAC cell lines HPAF-II, Panc-1 and BxPC-3, were susceptible to NDV infection, replication, and virus-induced death. However, in spheroids generated from the same cell lines, infection and cell death occurred only in the outer layers but not in the inner layers, while limited virus replication was detected. This can be explained by the dense morphology of the spheroids, which is characterized by the quiescent state of the inner cell layers consisting of cells in a low-proliferative and metabolic cell state, which is a well-known and key attribute of spheroids31,32. A similar phenomenon was observed in prostate cancer spheroids treated with reovirus and in lung cancer spheroids inoculated with a virulent NDV strain23,33.
Repeated inoculations with NDV, Reovirus, and Seneca Valley Virus have been applied in clinical trials for treating various solid cancers. These treatments have led to several cases of stable disease as well as partial and complete responses34–36. We observed more virus-induced cell death in spheroids upon repeated inoculation than after a single inoculation. The similar degree of virus-induced cell death with repeated inoculations at MOI of 100 and 300 implies that even at higher MOIs, only the outer layers of the spheroids were affected. However, in an in vivo setting, infection of the outer layers of 3D structures may be sufficient to induce an antitumor immune response, as the release of immunogenic cell death markers from OV-induced cell death was shown to activate the immune system and enhance tumor clearance37. Overall, these data suggest that the morphological differences between monolayers and spheroids affect NDV’s capacity to infect, replicate, and induce cell death.
Several reports have used PDOs to identify predictive markers for response to various therapies, including OV therapy; however, the effectiveness of OVs might be influenced by the morphology of PDOs7,18,38. The seven tested PDOs in our study varied in this regard, with most of them having a cystic morphology and two of them (PDO-4 and −7) having a dense morphology. The latter two PDOs were less sensitive to NDV infection, replication, and induced cell death compared to cystic PDO-3 and PDO-6, suggesting that dense morphology plays a role in reducing the sensitivity of PDOs to NDV. The impact of PDO morphology on virus-induced cell death was similarly observed in a study with PDAC PDOs harboring a dense-like morphology, where they were less sensitive to treatment with adenovirus26. However, the lower permissiveness of PDO-4 and −7 to NDV infection and replication and lower sensitivity to induced cell death cannot only be explained by the dense morphology alone, as cystic PDO-1 and 5 were also less sensitive to NDV-induced cell death than cystic PDO-2, −3, and −6. This was consistent with other studies where differences in sensitivity between PDOs with similar morphologies were observed using OVs, chemotherapies, or small-molecule inhibitors19,39,40. Other parameters may also contribute to differences in NDV sensitivity between PDOs. One such factor is the proliferation rate, as faster-dividing cells may be more permissive to virus infection and replication. While we did not directly quantify proliferation rates, we used culture time as an indirect proxy and did not observe notable differences between PDOs in this regard. Therefore, proliferation rate is unlikely to be a dominant determinant of NDV sensitivity in these PDOs.
Overall, cystic PDOs were permissive to NDV infection, which correlated with permissiveness to NDV replication and sensitivity to NDV-induced cell death. For cystic PDOs, a similar correlation between permissiveness to viral infection and sensitivity to induced cell death was observed in cystic PDAC PDOs treated with adenovirus26. However, in dense PDOs, permissiveness to NDV infection is primarily associated with virus replication but is not directly correlated with cell death. Interestingly, high levels of cell death were observed despite the relatively low levels of infection and replication cell death. This suggests that extensive viral infection and replication are not essential for inducing profound levels of cell death in this model. Although both spheroids and dense PDOs have similar 3D structures, dense PDOs consist of numerous smaller dense structures, unlike the single larger dense structure of a spheroid. This difference creates a larger surface area for NDV to infect dense PDOs, which might contribute to the increased NDV-induced cell death observed compared to spheroids. Culturing cells from dense PDOs as monolayers could provide additional insights into their permissiveness to NDV infection, replication, and sensitivity to induced cell death, free from the morphological limitations of the 3D model. Altogether, these findings indicate that PDO morphology may be one of several factors influencing the permissiveness of NDV infection and replication, as well as sensitivity to NDV-induced cell death.
Studies suggest that although neoadjuvant chemotherapy may improve surgical outcomes, it can result in the selection of therapy-resistant cancer cells, often leading to resistance to subsequent treatments18,41. In our study, three out of seven PDOs were derived from the primary tumors of patients treated with neoadjuvant FOLFIRINOX. Although only seven PDOs were evaluated, our data implied that neoadjuvant treatment did not affect viral infection, replication, or induced cell death. These findings suggest that therapy resistance induced by neoadjuvant treatment likely involves pathways unrelated to the oncolytic activity of NDV.
In vivo PDAC tumors are more complex than in vitro models, as they contain additional components of the tumor microenvironment, such as cancer-associated fibroblasts (CAFs), blood vessels, and peripheral blood mononuclear cells (PBMCs), all of which influence the efficacy of virus-induced cell death42. For example, a co-culture incorporating PDAC PDOs, CAFs and PBMCs has already been established6. Despite limitations, such as incompatibility between media used to culture PDOs, CAFs and immune cells, this co-culture model allows for the evaluation of OV-induced antitumor immune modulation in a more clinically relevant environment. Such evaluations can include measuring cytokine secretion profiles, tumor-infiltrating lymphocytes activity and immune cell activation. Altogether, incorporating components such as PBMCs and CAFs into 3D cell culture models such as PDOs greatly enhances their translational potential.
Overall, this study highlights the impact of model choice on the outcomes of assessing NDV-induced direct oncolytic effects, including NDV infection, replication, and cell death. The morphology of the model is crucial for these processes. For spheroids and dense PDOs, morphology seems to play a major role in sensitivity to NDV-induced oncolytic effects. As PDOs with dense morphology and spheroids share many morphological characteristics with the original patient tumors, these models might be preferred for studying virus infection and spread. However, PDOs are generally more suitable for identifying (genetic) markers associated with sensitivity to oncolytic virus therapy. To achieve this, a larger number of PDOs is required. These markers can then be used to screen patients with PDAC and establish a personalized medicine approach.
Methods
Cell lines
Vero cells were obtained from the American Type Culture Collection and cultured in Dulbecco’s Modified Eagle’s medium (DMEM) supplemented with 100 U/ml penicillin, 100 U/ml streptomycin, 2 mM L-glutamine (PSG), and 10% Hyclone Characterized Fetal Bovine Serum (FBS). Human pancreatic adenocarcinoma cell lines (HPACs) HPAF-II (ATCC® CRL-1997™), BxPC-3 (ATCC® CRL-1687™), and Panc-1 (ATCC® CRL-1469™) were cultured in the same media as Vero cells until passage 30, as described previously12. BSR-T7 cells (kind gift of K. Conzelmann) a derivative of baby hamster kidney (BHK-21) cells stably transfected to express T7 RNA polymerase43, were cultured in DMEM supplemented with PSG, 10% FBS, 1% non-essential amino acids, and 1% sodium pyruvate. All the cells were maintained at 37 °C and 5% CO2 in a humidified incubator. All media and supplements were purchased from Gibco (Life Technology, Bleiswijk, Netherlands).
Generation of spheroids and monolayers
A liquid overlay technique was used to generate spheroids as previously described44. In brief, 96-well plates (Corning, Glendale, Arizona, USA, #3598) were coated with 50 μL of 2% agarose and stored at room temperature for two hours. The agarose-coated plates were placed under UV light for 30 min before seeding the cells. Subsequently, approximately ten thousand HPAF-II, Panc-1, or BxPC-3 cells were seeded in each well, and the plates were placed on an orbital shaker for 48 h at 180 rpm to assist in cell aggregation. After a two-day culture period, spheroids with a single, well-defined spherical structure were selected and transferred to a coated 96-well plate using a cut-off pipette tip. Six of these were dissociated using trypsin–EDTA (Gibco, #25,200,056) and counted using Kova Glasstic Slides (Kova International, Garden Grove, California, USA#87,144). The number of cells counted in the dissociated spheroids that were representative of the remaining intact spheroids, which consisted of approximately 1.1 × 10⁴ cells. These spheroids were immediately used for subsequent experiments. On day 3 of spheroid culturing, HPAC monolayers were generated by seeding 2 × 10⁴ HPAC cells per well in a flat-bottom 96-well plate, and cells were inoculated the next day.
Patient-derived samples to establish patient-derived organoids
Fresh tumor samples were collected from patients with PDAC that were part of a previously described clinical study18. This study was conducted in accordance with the principles of the Declaration of Helsinki and was approved by the Medical Ethics Committee at Erasmus University Medical Center (Ref. MEC-2015–085). Written informed consent was obtained from all patients. Tumor material was retrieved from both the treatment-naïve group and the experimental arm of the study; the latter received neoadjuvant FOLFIRINOX treatment.
Resected human PDAC tumor tissues were processed and patient-derived organoids (PDOs) were established and cultured as described previously18,45. Organoid growth media consisted of basic medium composed of AdDMEM/F12 (Gibco), 1X Glutamax (Gibco, #35,050,061), 1X Hepes (Gibco, #15,630), and 100 μg/mL Primocin (InvivoGen, San Diego, California, USA, #ant-pm-1) further supplemented with 1 mmol/L N-Acetyl L-Cysteine (Sigma, Darmstadt, Germany., #A9165), 1 mmol/L Nicotinamide (Sigma, #N0630), 0.5 nmol/L Wnt-surrogate (ImmunoPrecise Antibodies, Victoria, British Columbia, Canada, N001-100ug), 500 ng/mL recombinant R-spondin 1 (PeproTech Cranbury, New Jersey, USA, #120–38), 100 ng/mL mouse recombinant Noggin (PeproTech, #250–38), 50 ng/mL mouse recombinant EGF (Gibco, #PMG8041), 100 ng/mL FGF10 (PeproTech, #100–26), 10 nmol/L Gastrin I (Sigma, #G9020), 10 μmol/L Y-27632 Dihydrochloride (Tocris, Bristol, United Kingdom, #1254) and 500 nmol/L A83-01 (Tocris, #2939). For culturing, PDOs were placed in 80% Cultrex Reduced Growth Factor Basement Membrane Extract, Type R1 (BME hydrogel; Bio-Techne, Minneapolis, Minnesota, USA, #3433–010-R1), and 20% basic medium. Upon reaching confluency, when PDOs covered approximately 80% of the available culture area within the BME hydrogel dome, they were either expanded or inoculated with rNDV F0-GFP.
Recombinant newcastle disease virus
The reverse genetics system for the recombinant lentogenic Newcastle Disease Virus (NDV) LaSota strain containing green fluorescent protein (rNDV F0-GFP) has been described previously and was kindly provided by Prof. B. Peeters from the Central Veterinary Institute of Wageningen, the Netherlands46. To rescue virus, BSR-T7 cells were transfected with 5 μg full length pNDV F0-GFP, 2.5 μg pCIneo-NP, 1.25 μg pCIneo-P and 1.25 μg pCIneo using the calcium phosphate precipitation method. After 48 h, 100 µL of the supernatant was injected into the allantoic fluid of 11-day old embryonated chicken eggs. Embryonated chicken eggs were incubated in a humidified incubator at 37 °C for three days. Allantoic fluid was harvested, and the presence of virus was confirmed by hemagglutination assay, as described previously47. The infectious titer of the allantoic fluid was determined by end-point titration in Vero cells, calculated using the method of Reed and Muench, and expressed as Median Tissue Culture Infectious Dose (TCID50/mL)48.
Inoculation of monolayers, spheroids and PDOs with rNDV F0-GFP
Monolayers and spheroids were inoculated with rNDV F0-GFP at various multiplicities of infection (MOIs) and incubated for one hour at 37 °C. Afterwards, monolayers and spheroids were carefully washed with PBS and cultured in DMEM with PSG and 1 µg/mL TPCK-treated Trypsin (T1426, Sigma-Aldrich) for the assessment of replication kinetics or cell viability.
To inoculate the PDOs with rNDV F0-GFP, the cell count from one well was used to estimate the cell numbers in other wells containing the same PDOs. First, PDOs from one well were separated from the BME hydrogel using Cell Recovery Solution (Corning, #354,253), followed by gentle dissociation with TrypLE Express without phenol red, a cell-friendly dissociation enzyme (Gibco, #12,604–013). The dissociated cells from the PDO were counted using Kova Glasstic Slides. This cell count was used to represent the cell numbers in the other wells of the same plate that still contained intact PDOs. Based on cell count, the required number of domes containing intact PDO structures were isolated from the BME hydrogel and transferred into 15 mL Falcon tubes, each with 500 μL of basic media at an approximate concentration of 1 × 10⁵ cells per tube. PDOs were inoculated with rNDV F0-GFP at a range of MOIs and virus-PDO mixtures were incubated at 37 °C for one hour. Subsequently, the inoculated organoids were washed with basic media and placed in the BME hydrogel. All experiments were conducted in triplicates.
Confocal microscopy and image processing
Spheroids and PDOs were inoculated with rNDV F0-GFP at the indicated MOIs and were examined at the indicated time points, using the Zeiss LSM 700 inverted confocal microscope. Brightfield pictures and z-stacks of GFP signals were taken at 20x, 10 × or 5 × magnification. Z-stack slices from both spheroids and organoids were converted into an animation or as a z-axis projection, which averages the GFP signal across each slice of the z-stack, resulting in a single image. This was done using ImageJ, which is an open-access image analysis program developed by the U.S. National Institute of Health.
Replication kinetics
To assess the replication kinetics, monolayers, spheroids, and PDOs were inoculated with rNDV F0-GFP at the indicated MOIs. Supernatants were collected at regular time points after inoculation. Afterwards, the same volume of fresh medium was added to the cells. All collected supernatants were mixed with an equal volume of 50% sucrose (w/w) and stored at −80 °C. Virus titers in collected samples were quantified using end-point titration in Vero cells, calculated using the method of Reed and Muench, and expressed as Median Tissue Culture Infectious Dose (TCID50/mL)48.
Cell viability assays
Cell viability of inoculated HPAC monolayers, spheroids, and PDOs was determined 120 h post inoculation, or after repeated inoculations of spheroids, 72 h post inoculation. Cell Viability was assessed by determining ATP release using the CellTiter-Glo 3D Cell Viability Assay (Promega, Madison, Wisconsin, USA, #G9682) following the manufacturer’s instructions. Cell viability was presented as the percentage of luminescence of inoculated cells versus mock-inoculated cells, where the latter was considered to have a viability of 100%. All calculations of the half-maximal effective concentration (EC50) were performed using GraphPad Prism 10.
Supplementary Information
Acknowledgements
We would like to acknowledge the support from the Dutch Foundation OAK ("Overleven met Alvleesklier kanker") from the Netherlands, grant #16.01 and #19.10, as well as Netherlands NWO TTW grant #15414 (NWO-domein Toegepaste en Technische Wetenschappen). The graphical abstract was created in BioRender. 1, V. (2024) https://BioRender.com/n70v183.
Author contributions
M.H., B.H.: conceptualization; M.H., E.A.F., D.G.: methodology, investigation, data curation, and analysis. M.H., B.H. : validation; R.F., B.H.: funding acquisition, resources and data curation; M.H.: writing original draft. R.F. and B.H.: supervision, project administration, writing, reviewing & editing.
Funding
Dutch Foundation OAK ("Overleven met Alvleesklier kanker") from the Netherlands, #16.01 and #19.10, #16.01 and #19.10, NWO-domein Toegepaste en Technische Wetenschappen, #15414, #15414.
Data availability
The data generated in this study are available upon request from the corresponding author.
Declarations
Competing interests
The authors declare no competing interests.
Ethical approval
Fresh tumor samples were collected from patients with PDAC that were part of a previously described clinical study18. This study was conducted in accordance with the principles of the Declaration of Helsinki and was approved by the local medical ethics committee (MEC-2015–085.
Footnotes
Publisher’s note
Springer Nature remains neutral with regard to jurisdictional claims in published maps and institutional affiliations.
Supplementary Information
The online version contains supplementary material available at 10.1038/s41598-025-06023-8.
References
- 1.Chiu, M. et al. Combination therapy with oncolytic viruses and immune checkpoint inhibitors. Expert Opin. Biol. Ther.20(6), 635–652 (2020). [DOI] [PubMed] [Google Scholar]
- 2.Brancato, V., Oliveira, J. M., Correlo, V. M., Reis, R. L. & Kundu, S. C. Could 3D models of cancer enhance drug screening?. Biomaterials232(1), 1–14 (2020). [DOI] [PubMed] [Google Scholar]
- 3.Ware, M. J. et al. Generation of an in vitro 3D PDAC stroma rich spheroid model. Biomaterials108, 129–142 (2016). [DOI] [PMC free article] [PubMed] [Google Scholar]
- 4.Edmondson, R., Broglie, J. J., Adcock, A. F. & Yang, L. Three-dimensional cell culture systems and their applications in drug discovery and cell-based biosensors. Assay Drug Dev. Technol.12(4), 207–218 (2014). [DOI] [PMC free article] [PubMed] [Google Scholar]
- 5.Nath, S. & Devi, G. R. Three-dimensional culture systems in cancer research: Focus on tumor spheroid model. Pharmacol. Ther.163, 94–108 (2016). [DOI] [PMC free article] [PubMed] [Google Scholar]
- 6.Tsai, S. et al. Development of primary human pancreatic cancer organoids, matched stromal and immune cells and 3D tumor microenvironment models. BMC Cancer18(1), 1–13 (2018). [DOI] [PMC free article] [PubMed] [Google Scholar]
- 7.Tatullo, M. et al. Organoids in translational oncology. J. Clin. Med.9(9), 2774–2774 (2020). [DOI] [PMC free article] [PubMed] [Google Scholar]
- 8.Boj, S. F. et al. Organoid models of human and mouse ductal pancreatic cancer. Cell160(1–2), 324–338 (2015). [DOI] [PMC free article] [PubMed] [Google Scholar]
- 9.Kloker, L., Yurttas, C. & Lauer, U. Three-dimensional tumor cell cultures employed in virotherapy research. Oncolytic Virotherapy.7, 79–93 (2018). [DOI] [PMC free article] [PubMed] [Google Scholar]
- 10.Jamal-Hanjani, M., Quezada, S. A., Larkin, J. & Swanton, C. Translational implications of tumor heterogeneity. Clin. Cancer Res.21(6), 1258–1266 (2015). [DOI] [PMC free article] [PubMed] [Google Scholar]
- 11.Metzger, W. et al. The liquid overlay technique is the key to formation of co-culture spheroids consisting of primary osteoblasts, fibroblasts and endothelial cells. Cytotherapy13(8), 1000–1012 (2011). [DOI] [PubMed] [Google Scholar]
- 12.Buijs, P. R. A., Van Eijck, C. H. J., Hofland, L. J., Fouchier, R. A. M. & Van Den Hoogen, B. G. Different responses of human pancreatic adenocarcinoma cell lines to oncolytic Newcastle disease virus infection. Cancer Gene Ther.21(1), 24–30 (2014). [DOI] [PubMed] [Google Scholar]
- 13.Buijs, P. et al. Recombinant immunomodulating lentogenic or mesogenic oncolytic Newcastle Disease Virus for treatment of pancreatic adenocarcinoma. Viruses7(6), 2980–2998 (2015). [DOI] [PMC free article] [PubMed] [Google Scholar]
- 14.Subramani, R. et al. Hepatocyte nuclear factor 1 alpha influences pancreatic cancer growth and metastasis. Sci. Rep.10(1), 20225 (2020). [DOI] [PMC free article] [PubMed] [Google Scholar]
- 15.Cohly, H. et al. Cell culture conditions affect LPS inducibility of the inflammatory mediators in J774A.1 murine macrophages. Immunol. Invest.30(1), 1–15 (2001). [DOI] [PubMed] [Google Scholar]
- 16.Renga, G. et al. Optimizing therapeutic outcomes of immune checkpoint blockade by a microbial tryptophan metabolite. J. Immunother. Cancer.10(3), e003725 (2022). [DOI] [PMC free article] [PubMed] [Google Scholar]
- 17.Bommareddy, P. K. et al. Oncolytic herpes simplex virus expressing IL-2 controls glioblastoma growth and improves survival. J. Immunother. Cancer.12(4), e008880 (2024). [DOI] [PMC free article] [PubMed] [Google Scholar]
- 18.Farshadi, E. A. et al. Organoids derived from neoadjuvant FOLFIRINOX patients recapitulate therapy resistance in pancreatic ductal adenocarcinoma. Clin. Cancer Res.27(23), 6602–6612 (2021). [DOI] [PMC free article] [PubMed] [Google Scholar]
- 19.Carter, M. E. et al. A three-dimensional organoid model of primary breast cancer to investigate the effects of oncolytic virotherapy. Front. Mol. Biosci.11(9), 826302 (2022). [DOI] [PMC free article] [PubMed] [Google Scholar]
- 20.Walter, R. J., Attar, B. M., Rafiq, A., Tejaswi, S. & Delimata, M. Newcastle disease virus LaSota strain kills human pancreatic cancer cells in vitro with high selectivity. J. Pancreas.13(1), 45–53 (2012). [PubMed] [Google Scholar]
- 21.Schwaiger, T. et al. Newcastle disease virus mediates pancreatic tumor rejection via NK cell activation and prevents cancer relapse by prompting adaptive immunity. Int. J. Cancer.141(12), 2505–2516 (2017). [DOI] [PubMed] [Google Scholar]
- 22.Deer, E. L. et al. Phenotype and genotype of pancreatic cancer cell lines. Pancreas39(4), 425–435 (2010). [DOI] [PMC free article] [PubMed] [Google Scholar]
- 23.Van De Merbel, A. F. et al. Reovirus mutant jin-3 exhibits lytic and immune-stimulatory effects in preclinical human prostate cancer models. Cancer Gene Ther.29(6), 793–802 (2022). [DOI] [PMC free article] [PubMed] [Google Scholar]
- 24.Lamfers, M. L. M., Grill, J., Dirven, C. M. F., van Beusechem, V. W. & Geoerger, B. Potential of the conditionally replicative adenovirus Ad5-D24RGD in the treatment of malignant gliomas and its enhanced effect with radiotherapy. Cancer Res.62, 5736–5742 (2002). [PubMed] [Google Scholar]
- 25.Dautzenberg, I. J. C. et al. Mammalian orthoreovirus T3D infects U-118 MG cell spheroids independent of junction adhesion molecule-A. Gene Ther.21(6), 609–617 (2014). [DOI] [PubMed] [Google Scholar]
- 26.Raimondi, G. et al. Patient-derived pancreatic tumour organoids identify therapeutic responses to oncolytic adenoviruses. EBioMedicine56, 102786 (2020). [DOI] [PMC free article] [PubMed] [Google Scholar]
- 27.Hamdan, F. et al. Novel oncolytic adenovirus expressing enhanced cross-hybrid IgGA Fc PD-L1 inhibitor activates multiple immune effector populations leading to enhanced tumor killing in vitro, in vivo and with patient-derived tumor organoids. J. Immunother. Cancer.9(8), e003000 (2021). [DOI] [PMC free article] [PubMed] [Google Scholar]
- 28.Tong, J. G. et al. Evidence for differential viral oncolytic efficacy in an in vitro model of epithelial ovarian cancer metastasis. Mol. Ther. - Oncolytics.2, 15013 (2015). [DOI] [PMC free article] [PubMed] [Google Scholar]
- 29.Lee, K. J. et al. Real-time monitoring of oncolytic VSV properties in a novel in vitro microphysiological system containing 3D multicellular tumor spheroids. Pizzo SV, editor. PLoS ONE15(7), e0235356 (2020). [DOI] [PMC free article] [PubMed] [Google Scholar]
- 30.Voros, A., Kormos, B., Valyi-Nagy, T. & Valyi-Nagy, K. Increased resistance of breast, prostate, and embryonic carcinoma cells against herpes simplex virus in three-dimensional cultures. ISRN Oncol.22(2013), 1–9 (2013). [DOI] [PMC free article] [PubMed] [Google Scholar]
- 31.Vinci, M. et al. Advances in establishment and analysis of three-dimensional tumor spheroid-based functional assays for target validation and drug evaluation. BMC Biol.10.1186/1741-7007-10-29 (2012). [DOI] [PMC free article] [PubMed] [Google Scholar]
- 32.Zanoni, M. et al. 3D tumor spheroid models for in vitro therapeutic screening: A systematic approach to enhance the biological relevance of data obtained. Sci. Rep.2016(6), 1–11 (2015). [DOI] [PMC free article] [PubMed] [Google Scholar]
- 33.Ye, T. et al. Oncolytic Newcastle disease virus induces autophagy-dependent immunogenic cell death in lung cancer cells. Am. J. Cancer Res.8(8), 1514–1527 (2018). [PMC free article] [PubMed] [Google Scholar]
- 34.Pecora, A. L. et al. Phase I trial of intravenous administration of PVT01, an oncolytic virus, in patients with advanced solid cancers. J. Clin. Oncol.20(9), 2251–2266 (2002). [DOI] [PubMed] [Google Scholar]
- 35.Burke, M. J. et al. Phase I trial of seneca valley virus (NTX-010) in children with relapsed / refractory solid tumors: A report of the children’s oncology group. Pediatr. Blood Cancer.62(5), 743–750 (2015). [DOI] [PMC free article] [PubMed] [Google Scholar]
- 36.Morris, D. G. et al. REO-001: A phase i trial of percutaneous intralesional administration of reovirus type 3 dearing (Reolysin®) in patients with advanced solid tumors. Invest. New Drugs.31(3), 696–706 (2013). [DOI] [PubMed] [Google Scholar]
- 37.Wu, Y. Y., Sun, T. K., Chen, M. S., Munir, M. & Liu, H. J. Oncolytic viruses-modulated immunogenic cell death, apoptosis and autophagy linking to virotherapy and cancer immune response. Front. Cell Infect. Microbiol.15(13), 1142172 (2023). [DOI] [PMC free article] [PubMed] [Google Scholar]
- 38.Frappart, P. O. et al. Pancreatic cancer-derived organoids – a disease modeling tool to predict drug response. United Eur. Gastroenterol. J.10.1177/2050640620905183 (2020). [DOI] [PMC free article] [PubMed] [Google Scholar]
- 39.Vlachogiannis, G. et al. Patient-derived organoids model treatment response of metastatic gastrointestinal cancers. Science359(6378), 920–926 (2018). [DOI] [PMC free article] [PubMed] [Google Scholar]
- 40.Vazaios, K. et al. The heterogeneous sensitivity of pediatric brain tumors to different oncolytic viruses is predicted by unique gene expression profiles. Mol. Ther. Oncol.32(2), 200804 (2024). [DOI] [PMC free article] [PubMed] [Google Scholar]
- 41.Hadj Bachir, E. et al. A new pancreatic adenocarcinoma-derived organoid model of acquired chemoresistance to FOLFIRINOX: First insight of the underlying mechanisms. Biol. Cell.114(1), 32–55 (2022). [DOI] [PubMed] [Google Scholar]
- 42.Everts, A., Bergeman, M., McFadden, G. & Kemp, V. Simultaneous tumor and stroma targeting by oncolytic viruses. Biomedicines.8(11), 474 (2020). [DOI] [PMC free article] [PubMed] [Google Scholar]
- 43.Buchholz, U. J., Finke, S. & Conzelmann, K. K. Generation of bovine respiratory syncytial virus (BRSV) from cDNA: BRSV NS2 Is Not essential for virus replication in tissue culture, and the human RSV leader region acts as a functional brsv genome promoter. J. Virol.73(1), 251–259 (1999). [DOI] [PMC free article] [PubMed] [Google Scholar]
- 44.Carlsson J, Yuhas JM. Liquid-overlay culture of cellular spheroids. Recent Results Cancer Res Fortschritte Krebsforsch Prog Dans Rech Sur Cancer. 95(Foa 4):1–23. (1984). [DOI] [PubMed]
- 45.Driehuis, E., Gracanin, A., Vries, R. G. J., Clevers, H. & Boj, S. F. Establishment of pancreatic organoids from normal tissue and tumors. STAR Protoc.10.1016/j.xpro.2020.100192 (2020). [DOI] [PMC free article] [PubMed] [Google Scholar]
- 46.Peeters, B. P. H., de Leeuw, O. S., Koch, G. & Gielkens, A. L. J. Rescue of Newcastle Disease Virus from Cloned cDNA: Evidence that cleavability of the fusion protein is a major determinant for virulence. J. Virol.73(6), 5001–5009 (1999). [DOI] [PMC free article] [PubMed] [Google Scholar]
- 47.Hirst, G. K. The quantitative determination of influenza virus and antibodies by means of red cell agglutination. J. Exp. Med.75(1), 49–64 (1942). [DOI] [PMC free article] [PubMed] [Google Scholar]
- 48.Reed, L. J. & Muench, H. A simple method of estimating fifty per cent endpoints. Distribution27(3), 493–497 (1938). [Google Scholar]
Associated Data
This section collects any data citations, data availability statements, or supplementary materials included in this article.
Supplementary Materials
Data Availability Statement
The data generated in this study are available upon request from the corresponding author.