

Abstract
When investigating the brain, bodily, or behavioral correlates of emotional experience, researchers often present participants with stimuli that are assumed to reliably and exclusively evoke an instance of one, and only one, emotion category across participants (e.g., a fear stimulus, a joy stimulus, and so on). These assumptions are driven by a typological view. Here, we tested the extent to which they are met. Across three studies (total N=453), participants reported their experiences as they viewed silent video clips or static images that were curated from published studies and from online search engines. Two different response formats were used. Overall, the proportion of stimulus-evoked emotion experiences that met even lenient benchmarks for validity and reliability for labeling a stimulus as pertaining to a single emotion category label was exceedingly low. Furthermore, participants frequently used more than one label for a given instance. The findings suggest that typological assumptions, and the nomothetic approach they align with, rely on assumptions that are rarely, if ever, met in stimulus-evoked paradigms. Correspondingly, the use of group-averaged normative ratings mask tremendous variation that is potentially meaningful. An overreliance on these norms may lead to conclusions that emotions are organized as discrete categories, yet these theory-laden conclusions may have limited generalizability regarding the emotional experiences of individual people during these tasks. Rather, emotional experiences evoked by visual stimuli are multifaceted (i.e., involve multiple labels per instance) and vary tremendously across individuals. Future work may benefit from multifaceted measurement of emotion and idiographic, data-driven modeling approaches.
Keywords: emotion, norms, self-report, measurement, idiographic
The design for an experiment is usually dictated by hypotheses about the nature of the phenomenon under investigation (Barrett, 2022; Brunswik, 1949; Dubova & Goldstone, 2023; Westlin et al., 2023). In the science of emotion, typological views typically guide study design, wherein emotion categories are treated as types and instances (i.e., “tokens”) of an emotion category are assumed to share a mechanism, brain state, or set of features in common (for reviews, see Barrett & Lida, in press; Barrett & Satpute, 2019; Barrett & Westlin, 2021). Typological views underlie the hypothesis that emotions are natural kind categories, each with their own corresponding pattern of features that can be measured from the brain, peripheral physiology, and behavior (e.g., Barrett, 2006, 2022). These categories are either assumed to have an essence (i.e., the necessary and sufficient features that are unique and distinct from other categories; e.g., Panksepp, 1998, 2000), or a cluster of probabilistic features with a set of features that is the most frequent or typical (i.e., the category’s prototype; e.g., Cowen & Keltner, 2021; Russell, 1991), both of which imply that instances within a category are highly similar to one another regardless of context and individuals yet distinct from the instances of other categories. Variation across instances within an emotion category is not considered to be intrinsic to the emotion category itself but rather due to causal factors acting on the category (for example, causal factors that have been reported to act on emotional expressions include differences in the structure of facial muscles (Farahvash et al., 2010; Shimada & Gasser, 1989), cultural accents (Cordaro et al., 2018; Elfenbein et al., 2007), or display rules (Matsumoto, 1990), or due to stochastic noise (Roseman, 2011)).
If emotional instances cluster into natural kind categories as hypothesized by a typological view, then the best experimental design to investigate the nature of these categories would involve stimuli that reliably evoke instances belonging to one, and only one, category with a high probability (i.e., a given stimulus would be categorized across people with high reliability across people and high exclusivity to only one category). Such stimuli would allow researchers to investigate the most representative instances of the category of interest. Some stimuli might be emotionally evocative yet not suitable for such an investigation because they evoke instances from different emotion categories across people (e.g. a stimulus evokes sadness for one person, disgust for another) or instances belonging to multiple emotion categories within a single person. By analogy, when a psychometric scale is constructed, an experimenter tests many items and only selects the most homogeneous and reliable items for use in the final scale because these items are thought to best measure the construct of interest (Dawis, 2000).
Using this typological strategy, several stimulus sets have been developed over the past several decades using a variety of different induction methods to evoke emotions (e.g., images, sounds, imagined scenes, films, etc.; Cowen & Keltner, 2021; Gerrards-Hesse et al., 1994; Levenson, 2007; Martin, 1990; Westermann et al., 1996). Among them, video clips are one of the most widely used stimulus types due to their ability to elicit strong responses with relatively high ecological validity compared to other induction methods (Lench et al., 2011; for a review, see Rottenberg et al., 2007). Early video stimulus sets (Gross & Levenson, 1995; Philippot, 1993) were developed by selecting a handful of videos for each emotion category according to intensity (i.e., the mean rating of the target emotion category) and discreteness (i.e., the intensity of the target emotion category compared to non-target categories) of corresponding ratings.
Yet even when using carefully selected video stimuli, reports of experience still vary considerably. For example, Gross and Levenson (1995) developed a stimulus set of 16 videos with the highest intensity and discreteness ratings from a larger set of 78, yet even these 16 videos were not categorized solely as the target emotion category in a majority of participants. Only ~32% of participants categorized their experience as anger for videos intended to induce anger, and ~51% of participants categorized their experience as contentment for videos intended to induce contentment (Gross & Levenson, 1995). Low consistency is even more pronounced when including more diverse samples. For example, participants from a different cultural context (Japan) than those who normed the videos (the United States) categorized their experiences using many non-target emotion categories when exposed to videos; films labeled as evoking anger were not only categorized as anger, but also as confusion, disgust, fear, sadness, and tension (Sato et al., 2007). Other video stimulus sets have since been developed in the pursuit of eliciting discrete emotional states (e.g., Choe et al., 2013; Gabert-Quillen et al., 2015; Gilman et al., 2017; Maffei & Angrilli, 2019; Schaefer et al., 2010; Zupan & Babbage, 2017; for an example with static images, see Mikels et al., 2005), but variation nonetheless continues to be observed. Categorizations vary based on factors such as gender (e.g., videos labeled as fear were categorized highly on amusement by males but not by females; Gabert-Quillen et al., 2015), age (Hazer et al., 2015), or familiarity with the video (Gabert-Quillen et al., 2015), and discreteness may also differ based on the category of interest (e.g., videos labeled by experimenters as evoking anger were categorized by participants as both anger and sadness, but videos labeled by experimenters as evoking sadness were more exclusively categorized by participants as sadness; Cabral et al., 2018).
Despite this variation in previous norming studies, studies routinely assign singular emotion category labels to particular stimuli, consistent with typological assumptions about emotion. This practice has historical roots in psychological science; early researchers considered group aggregation to be an efficient and acceptable solution to overcome the commonly observed variability in individual behavior, despite this averaged behavior not being representative of any individual member of the group (Danziger, 1990; also see Bakan, 1967; Barrett & Theriault, in press; Estes, 1956; Flournoy et al., 2024; Gallistel, 2012; Sidman, 1960; Westlin et al., 2023). The continued reliance on this approach might be because using ‘normative ratings’ may seem like a theory-independent convention (when, in fact, it is not; Barrett, 2022), or because evidence of variation is dismissed as noise that arises from the limitations of self-report measures (for discussions on this topic, see Barrett, 2004; Chen et al., 1997; Schwarz, 1999). However, convention should not be mistaken for validity. The over-reliance on this strategy has resulted in a figure-ground problem, where typological assumptions have led researchers to foreground the group-averaged statistic as real and meaningful, and to treat any variation as error.
The reliance on normative ratings as ground truth for stimuli is only acceptable if instances that are being assigned to the same category have at least a family resemblance to one another and a category prototype (i.e., instances are normally distributed, and variance is low, such that the mean response across within category instances provides a reasonable representation of the instances themselves). However, an alternative view of emotions hypothesizes that emotion categories are populations of highly variable, context-specific instances (Barrett, 2013, 2017a, 2017b; Clark-Polner et al., 2017; Siegel et al., 2018). In contrast to a typological view, a populations view treats variation as real, and the group-averaged statistic as an abstraction that is a fiction. If the variation is real – if different people experience the same stimulus differently – then treating stimuli as reliably and exclusively evoking instances from singular emotion categories, is not valid, and oversimplifies the extent to which meaningful, structured variation is present among these instances. Moreover, doing so can lead to circular inferences: averaging data across individuals and using singular emotion category labels for them is likely to create results suggesting that emotions are organized as discrete categories in a typological model. However, these results might actually be an artificial product of the methodological approach rather than revealing novel insights about the structure of emotion (Barrett, 2022; Dubova & Goldstone, 2023).
In this paper, we present three studies from an initial effort to curate novel videos to investigate the biological correlates of emotion. In Study 1, participants reported their emotional experiences while watching hundreds of candidate video stimuli that targeted five emotion categories (anger, awe, fear, happiness, sadness). We observed that hardly any clips met even the most lenient benchmarks for reliability (percentage of participants who reported experiences of the same emotion category) and/or exclusivity (percent of participants who used the most reliable emotion category label and only that label). We further modeled the number of emotion categories used by a given participant for a given stimulus and observed an overall tendency for participants to categorize their experiences using more than one emotion category. In two subsequent studies, we replicated these findings using different response formats (forced-choice vs. free labeling; Study 2), and different stimulus sets (videos and static images; Study 3), some of which have been reported to reliably and exclusively evoke singular emotion categories in previously published studies. Across these three studies (totaling more than 400 participants), our observations suggest that the typological assumptions are rarely, if ever, met in stimulus-evoked paradigms. The use of these stimuli as if they reliably evoke specific emotion instances results in theory-laden observations that may ultimately bias study results and conclusions towards certain theory-based expectations.
Study 1: Investigating Emotion Categorization Across a Large Sample of Video Stimuli
In Study 1, each of 364 participants viewed a subset of videos (average of 96 per person) from a larger set of 672 unique clips. After each video, participants reported whether or not they experienced an instance emotion, and if yes, they then categorized their experience by selecting from a checklist the word(s) that described how each video made them feel from a set of 21 adjectives. We then examined the distribution of emotion categories used by participants across all 672 clips.
Method
Participants
We recruited 364 English-speaking participants (138 female, mean age = 40.55 years) through Amazon Mechanical Turk during 2021. Participants self-identified as Asian (8.0%), Black or African American (6.6%), Multiracial (Asian and White 0.6%, American Indian/Alaskan Native and White 1.4%, White and Prefer to self-describe 1.9%), and White (81.6%). To optimize for observing potential variation, we sought to recruit as many participants as possible within the time and financial constraints of our study. All procedures were approved by the Institutional Review Board at Northeastern University. All methods were carried out in accordance with relevant guidelines and regulations. In addition to the 364 participants included in the present analyses, an additional 15 participants were recruited but excluded following quality checks described in the procedure below.
Stimuli
A total of 672 videos were selected from online search engines and video databases (e.g., Google, YouTube) by trained research assistants with the five target emotion category labels in mind (anger, awe, fear, happiness, sadness). The search terms used included specific emotion labels (e.g., “angry video”, “awe-inspiring scene”) as well as more descriptive terms (e.g., “natural disaster footage”, “heartwarming video”). Videos were initially screened to meet basic criteria: at least a 20-second duration, appropriate visual quality, and emotionally evocative in the absence of audio. We aimed for an approximately equal distribution of videos across the five target emotion categories. Videos were trimmed to be 20 seconds long and any audio was removed (consistent with past studies that have used silent videos to evoke emotional instances, e.g., Cowen & Keltner, 2017). Videos were split across 7 surveys, each containing 94 to 98 unique videos (average of 96 videos per survey). Each survey was completed by an average of 52 participants.
Procedure
Participants categorized their experiences after watching each video using a forced-choice method. Participants were first asked to respond whether they experienced any emotion while watching the video. If the participant responded ‘yes’ (that they experienced an instance of emotion), they were then instructed to select the word(s) that best described their experience from a list of 21 emotion category adjectives (afraid, amused, anxious, angry, awe, calm, confused, curious, disappointed, disgusted, excited, frustrated, happy, interested, joy, pain, pity, proud, relieved, sad, surprised) as well as an ‘other’ option. This two-step process allowed us to include only those trials in which participants reported experiencing an instance of emotion in our analyses. Rather than using intensity ratings and applying an experimenter-defined threshold to determine the presence of an emotional instance, the forced-choice paradigm allowed participants to set their own decision threshold by choosing whether to endorse a specific word. A total of 26.5% of trials were removed due to no emotion being experienced. The emotion categories included in the list of adjectives were chosen based on the most frequently reported words in a previous investigation of emotion naming (Hegefeld et al., 2023; Nook et al., 2021). We examined co-occurrence of each pair of words (shown in Supplementary Figure 1), and observed co-occurrences between 0% (e.g., happy and angry, calm and afraid) to 10.1% (afraid and anxious) of sampled instances. Data were quality checked to ensure that included participants completed the survey in an appropriate amount of time, and that they did not always select the same response each time.
Analysis
Reliability and Exclusivity.
We calculated two different agreement metrics for instances evoked by each video: (1) reliability: we identified the most commonly used emotion category, and then calculated the percentage of participants who used this category to describe how they felt while viewing that video; (2) exclusivity: we calculated the percent of participants who used only the most reliable emotion category. We then examined the number of videos that evoked self-reported instances that achieved percent agreement at different percentages of reliability and exclusivity (varying from 0 to 100% agreement). We specifically report the number of videos that met strict (90% reliability, 90% exclusivity) and more lenient (70% reliability, 70% exclusivity) benchmarks for supporting a typological view.
Model Fitting.
We first transformed the number of emotion categories reported for each instance into frequency counts. We excluded trials during which a participant selected “no emotion elicited.” We modeled these frequency counts (grouped by participant and grouped by video) as Poisson distributions to test how many categories were used on average to report emotional experiences. The Poisson distribution is a discrete counting distribution that is used to describe the number of events (assuming independence) in a given time period (Haight, 1967). The Poisson distribution is appropriate for modeling the current data for several reasons. First, the data being modeled are discrete counts of emotion categories used by participants, and this distribution is used to model count data. Additionally, the selection of emotion categories can be considered independent, as choosing one category does not necessarily influence the selection of others. Co-occurrence analyses described in the procedure above revealed low rates of co-occurring words, suggesting that the independence assumption is reasonable for the present analysis. Finally, the Poisson distribution has one free parameter, lambda, which describes both the expected value (i.e., mean) and the variance of the distribution. Lambda is therefore well-suited to provide an index of how many emotion categories were used when reporting experiences (e.g., a lambda of one suggests that participants on average used one emotion category).
We determined integer-valued (constrained) maximum-likelihood estimates of the lambda parameter by evaluating the sum of log-probability for candidate values from 1 to 10, and then selected the best parameter that made the available data most likely. This model fitting procedure was conducted on both of the following observed distributions: (1) the number of emotion categories used by each participant, across all videos, and (2) the number of emotion categories used across all participants, for each video. We note that the instances where participants reported no emotion elicited would correspond to the case where the value of elicited emotion categories is zero. Because we excluded these trials, we omitted testing a lambda of zero as a potential parameter value.
Transparency and Openness
We report how we determined our sample size, all data exclusions, all manipulations, and all measures in the study, and we follow JARS (Kazak, 2018). Analyses were performed in Python 3.11.5. Data and code for all analyses and visualizations will be made available upon request. The study’s design and analyses were not pre-registered.
Results
Reliability and Exclusivity
We first examined the ability of each video to reliably and exclusively evoke an instance that was categorized in the same way by a majority of participants in the sample. Out of the 672 videos we included, none evoked experiences that were reliably and exclusively categorized with the same category across all participants (Figure 1). No videos evoked instances that met the strict threshold of 90% reliability and exclusivity, nor did any meet the more lenient threshold of 70% reliability and exclusivity (in fact, no stimulus achieved even a 60% benchmark; Figure 1). Plots of the frequency with which each emotion category was reported are shown in Supplementary Figure 2, grouped based on the most reliable category per video.
Figure 1. Plots of reliability and exclusivity from Study 1.

(a) The blue line reflects reliability (i.e., the percent of participants who used the most commonly used emotion word to describe their experience evoked by a given stimulus) in blue, and exclusivity (i.e., the percent of participants who used only a single emotion word to describe their experience evoked by a given stimulus) in orange. (b) Heatmap of exclusivity and reliability. Axes reflect percentages of participant agreement (varying from 10 to 100% agreement) for exclusivity and reliability. Colors reflect the percent of videos at each percent agreement.
Model Fitting
We next examined exclusivity across all categories (i.e., do participants tend to use only one emotion category to describe an emotional instance). We fit a set of Poisson distributions as described above to determine which distribution was most consistent with the observed data. The optimized lambda parameter of the fitted Poisson model that was most consistent with the data provided an index of the most probable number of emotion words used. When estimating lambda parameters separately for distributions of each participant’s instances across all videos, and distributions of instances evoked by each video across all participants (Figure 2), we observed considerable variation in the lambda values of the best-fitting distributions, with the majority of values greater than one. Lambda values were not related to total task duration (r(347) = 0.0058, p = 0.91).
Figure 2. Results of model fitting analyses from Study 1.
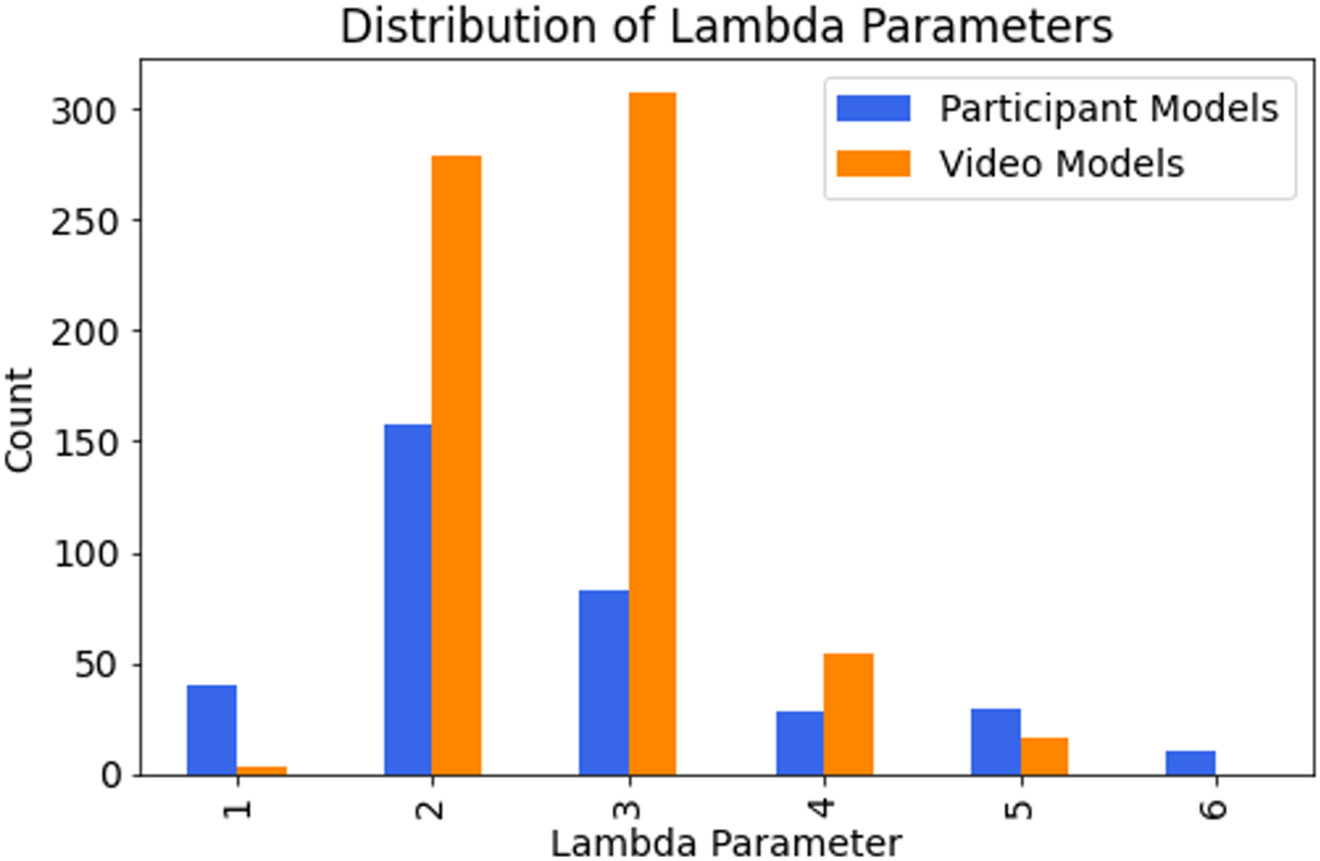
Plot shows the distribution of lambda parameters for the best fitting distributions, when distributions were fit separately on frequency counts for each participant, across videos (blue) and for each video, across participants (orange).
Discussion
In Study 1, we investigated whether a large sample of video stimuli reliably and exclusively evoked emotions across a large sample of participants. We identified very few videos that reliably evoked instances of the same emotion category in a majority of participants. Even videos that evoked the most reliable instances in fact frequently evoked instances belonging to more than one category. We also observed considerable variation in the lambda parameters of the best-fitting distributions, with the majority of parameters greater than one. This finding suggests that while only one emotion label was used to report some instances, this was not the most frequent response.
We next sought to understand whether this pattern of results would hold for other response methods. Past studies have shown that providing participants with an array of words through forced-choice results in increased consistency of responses across participants (for a review, see (Barrett, 2022; for examples in the study of emotional expressions, Barrett et al., 2019; Gendron et al., 2018; Russell, 1994; but see Cowen & Keltner, 2021 for a different claim). It is possible, however, that the videos evoked instances of different emotion categories that were not provided on the original list of 21 adjectives. It is also possible that participants use different numbers of categories when freely reporting their experiences compared to when they select words from a list. To test these possibilities, we tested a new sample of participants who reported their emotional experiences using either a forced-response or free-labeling format and compared the results across the two response formats.
Study 2: Replicating Findings Across Response Formats
We next sought to understand whether the observed variation in experiences evoked by the same stimulus generalized across different response types. According to a typological view, the pre-selected list of emotion words used in forced-choice should reflect the majority of individual experiences. An alternative, population’s view suggests that an individual’s experience may be better described using a variety of different emotion words, depending on the context of the situation. Thus, in Study 2, we examined the emotion words reported by participants using both the conventional multiple-choice method, as well as an open-ended, free-labeling response format (Hoemann et al., 2024). In this study, we decreased the overall number of videos sampled, but every video was presented to every participant.
Method
Participants
We recruited 57 English-speaking participants (16 female, mean age = 37.25 years) through Amazon Mechanical Turk during 2021. Participants self-identified as Asian (7.0%), Black or African American (1.8%), American Indian/Alaskan Native (1.8%), Prefer to self-describe (1.8%), and White (87.7%). The sample size for Study 2 was consistent with that from Study 1 (52 participants per video), with an extra 10% added to account for any potential data loss or participant exclusion. All procedures were approved by the Institutional Review Board at Northeastern University. All methods were carried out in accordance with relevant guidelines and regulations. In addition to the 57 participants included in the present analyses, an additional nine participants were recruited but excluded following quality checks described in the procedure below.
Stimuli
For study 2, we selected a subset of 70 videos from the original 672. The subset of videos was chosen as follows: for each intended emotion category (anger, awe, fear, happiness, sadness), seven videos were randomly selected. Trained research staff then identified an additional seven videos per category that best matched the randomly selected videos in terms of semantic content and emotional intensity. This process resulted in 35 pairs of videos (70 total), which allowed for effective counterbalancing of stimuli across free and forced-choice response formats. As in Study 1, videos were 20 seconds long and did not contain any audio.
Procedure
All participants categorized their experiences evoked by each of the videos by either selecting the word(s) that best described their experience from a list of 21 emotion adjectives (afraid, amused, anxious, angry, awe, calm, confused, curious, disappointed, disgusted, excited, frustrated, happy, interested, joy, pain, pity, proud, relieved, sad, surprised) as well as an ‘other’ option, called “forced choice”, or by self-generating a list of emotion words that best described their experience, called “free-labeling”. If a participant did not experience any emotion while watching the video, they were instructed to select ‘no emotion elicited’ in the forced-choice method, or to write ‘none’ in the free-labeling method. Both of the response formats allowed participants to set their own decision threshold by choosing whether to endorse or report a specific word, rather than relying on externally imposed criterion to determine the presence or absence of an emotional instance. A total of 35.4% of trials were removed due to no emotion being experienced. For each of the 35 pairs of videos, an instance evoked by one video from the pair was rated via forced-choice, while an instance evoked by the other video was rated via free-labeling. Participants were randomly selected to be in one of two counterbalanced groups: one group reported their experiences using the forced-choice method for a set of 35 videos first, followed by free-labeling an additional set of 35 paired videos second, while the other group reported their experiences first using free-labeling, followed by forced-choice. Counterbalancing was performed to determine whether the use of forced-choice methods first influenced the categories generated subsequently with free-labeling, and vice-versa. This blocked design was chosen over an interleaved design to minimize potential carryover effects (e.g., Conway et al., 2001). We examined co-occurrence of each pair of words for the forced-choice responses for the free-labeling first condition (Supplementary Figure 3) and forced-choice first condition (Supplementary Figure 4) separately. We observed co-occurrences between 0% (e.g., disappointed and awe) to 8.8% (joy and happy) of sampled instances for the free-labeling first condition, and between 0% (e.g., pity and excited) and 8.7% (anger and disgust) for the forced-choice first condition. Data were quality checked to ensure that included participants completed the survey in an appropriate amount of time and that they did not always select the same response each time. We also included an end quiz in which participants were asked to select which videos they had seen, and we only included participants who responded correctly on at least 7 out of 11 quiz questions.
Analysis
All analyses were conducted using the same reliability/exclusivity and model fitting approaches described in Study 1. Analyses were conducted separately for free-labeling and forced-choice response types.
Results
Reliability and Exclusivity
No video reliably and exclusively evoked reported instances of the same emotion category across a majority of participants, measured against benchmarks of 70% (lenient) and 90% (strict) reliability and exclusivity (Figure 3). This pattern was observed across both response methods; no video evoked instances with higher than 50% (free-labeling) or 60% (forced-choice) reliability and exclusivity.
Figure 3. Plots of reliability and exclusivity from Study 2.

(a) Percent of videos plotted against reliability for free-labeling (dark blue) and forced-choice (light blue) response types and exclusivity for free labeling (dark orange) and forced-choice (light orange) response types. (b) Heatmap of exclusivity and reliability, for free-labeling (left) and forced-choice (right) response types. Axes reflect percentages of participant agreement (varying from 10 to 100% agreement) for exclusivity and reliability. Colors reflect the percent of videos evoking instances that met each percent agreement.
Model Fitting
Model fitting analyses on each participant’s distribution (representing all instances evoked by all videos, for a given participant; Figure 4a) and each video’s distribution (representing all instances evoked by a given video, across participants; Figure 4b), revealed considerable variation, with a lambda of at least two being most probable for the majority of distributions. These findings were consistent across forced-choice and free-labeling, suggesting that a person’s tendency to use more than one emotion category was robust to response-type. Our findings were also consistent across counterbalanced conditions, suggesting that the use of forced-choice methods first did not influence the number of categories used with subsequent free-labeling, and vice-versa.
Figure 4. Distribution of optimal lambda parameters from Study 2, when distributions were fit separately on the frequency counts for each participant (a) and each video (b).
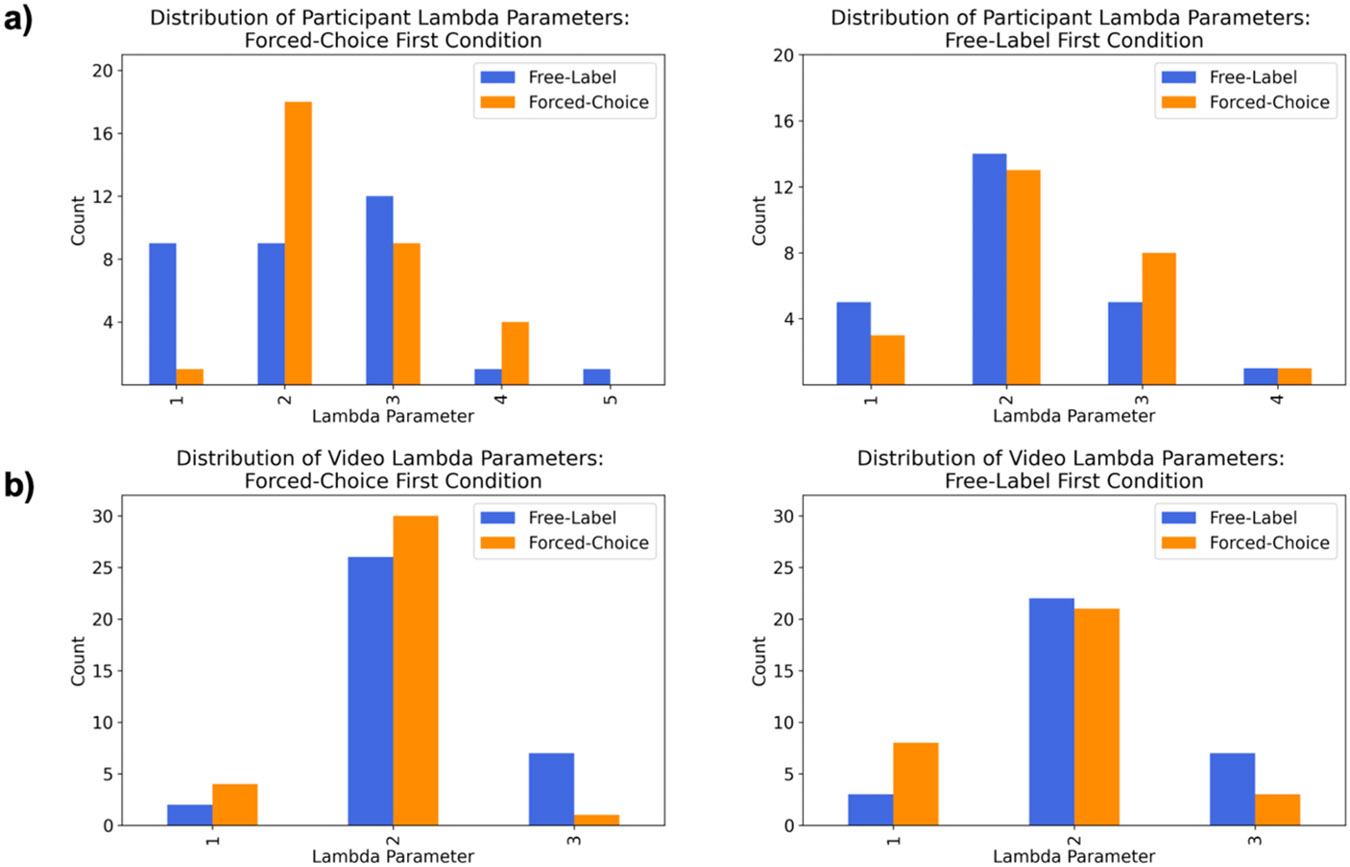
Left plots represent results from the forced-choice first condition, while right-plots represent plots from the free-label first condition. Results from free-labeling are shown in blue, and forced-choice are shown in orange.
Discussion
Study 2 replicated the observations of Study 1: no videos reliably and exclusively evoked emotions. The distributions of responses across all trials within a participant, and across all participants for each video, were again most consistent with a Poisson distribution with a lambda parameter greater than one, with considerable variation in the most probable lambda parameters. These findings did not differ based on response method, suggesting that an inability to identify stimuli that evoked reliable and exclusive instances across participants was not due to the method through which emotion categories were reported.
We next sought to understand whether this pattern of low reliability and exclusivity was limited to the use of 20s video clips. Video stimuli are frequently used in the study of emotional experiences due to their ability to evoke intense experiences with improved ecological validity compared to other stimuli (Rottenberg et al., 2007). However, it is possible that the dynamic, temporal component of a twenty-second video results in multiple discrete experiences as the video unfolds, which is reflected in the use of multiple category labels. Given this possibility, we next sought to examine whether our findings generalized to instances evoked by shorter video clips, as well as static image stimuli.
Study 3: Replicating Findings Across Stimulus Types
In a third study, we investigated the reliability and exclusivity of emotions during shorter video clips (~7 seconds on average) that have previously been normed using typological assumptions and provided evidence for a typology of emotion (Cowen & Keltner, 2017; Horikawa et al., 2020). Specifically, we examined responses to the highest rated videos in the database for each of five emotion categories (anger, awe, fear, happiness, sadness). We then further examined whether our observations of low reliability and exclusivity generalized to emotional experiences while viewing static images which have similarly been used to provide evidence for a typology of emotion (Barke et al., 2012; Lang et al., 2008; Mikels et al., 2005). We specifically selected images that matched the videos based on stimulus content. By using previously normed stimuli, we aimed to provide the best opportunity to observe a typology if one was indeed present.
Method
Participants
We recruited 32 English-speaking participants (13 female, mean age = 39.78 years) through Amazon Mechanical Turk during 2021. Participants self-identified as Asian (3.1%), American Indian/Alaskan Native (3.1%), and White (93.8%). The sample size for Study 3 is consistent with that from Study 2 (57 participants split into two conditions, with 28/29 per condition), with an extra 10% added to account for any potential data loss or participant exclusion. All procedures were approved by the Institutional Review Board at Northeastern University. All methods were carried out in accordance with relevant guidelines and regulations. In addition to the 32 participants included in the present analyses, an additional 20 participants were recruited but excluded following quality checks described in the procedure below. The higher exclusion rate in this study compared to the previous two may be due to the use of static images that participants could more easily skip through, unlike the video stimuli that required participants to watch fully before proceeding.
Stimuli
Participants were presented with a series of videos and static images from existing databases. A sample of 20 videos were selected from a previously published study examining emotion category ratings of affective videos (Cowen & Keltner, 2017). We selected videos that had the highest ratings for each of the five categories sampled in Studies 1 and 2 (anger, awe, fear, happiness, sadness). Videos had a mean length of 7.7 seconds and did not contain any audio. A sample of 24 static images were selected from the International Affective Picture System (Lang et al., 2008). Images were chosen to depict semantic content that was similar to the sampled videos.
Procedure
Participants reported their emotional experiences for each video or static image using the forced-choice method as described in Study 1. A total of 21.4% of trials were removed due to no emotion being experienced. The co-occurrence of each pair of words was examined separately for videos (Supplementary Figure 5) and static images (Supplementary Figure 6). For video stimuli, we observed co-occurrences between 0% (e.g., joy and disgust) to 7.3% (sad and pity) of sampled instances; for image stimuli, we observed co-occurrences between 0% (e.g., happy and disgust) and 4.7% (sad and pity). Data were quality checked to ensure that included participants completed the survey in an appropriate amount of time and that they did not always select the same response each time. We also included a quality control check at the end of the survey, in which participants were asked to select stimuli they had seen, and we only analyzed data for participants who responded correctly on at least 5 out of 8 questions.
Analysis
All analyses were conducted using the same reliability/exclusivity and model fitting analyses described in Studies 1 and 2.
Results
Reliability and Exclusivity
For both videos and images, the percent agreement of stimuli evoking instances that met high percentages of reliability and exclusivity was very low (Figure 5). Specifically, no video evoked instances with 70% reliability and exclusivity, and only three images achieved such benchmarks. If we increase the benchmark to a more strict percent agreement, only one image successfully evoked instances with 90% reliability and exclusivity.
Figure 5. Plots of reliability and exclusivity from Study 3.

(a) Percent of videos plotted against percent of participants who used the most commonly categorized emotion word to describe their experience evoked by a given stimulus for videos (blue) and images (orange). (b) Percent of videos plotted against percent of participants who used only a single emotion word for a given stimulus for videos (blue) and images (orange) stimulus types. (c) Heatmap of exclusivity and reliability for videos (left) and images (right). Axes reflect percentages of participant agreement (varying from 10 to 100% agreement) for exclusivity and reliability. Colors reflect the percent of videos at each percent agreement.
Model Fitting
Model fitting analyses for video stimuli again revealed variation in the most probable lambda parameters, with a lambda of two being the most frequent. For instances evoked by static images, we still observed variation in the most probable lambda parameters, yet the majority of most probable lambdas was one (grouped by participant- (Figure 6a) and stimulus-specific (Figure 6b) distributions).
Figure 6. Results of model fitting analyses from Study 3 for instances evoked by static images (blue) and videos (orange).
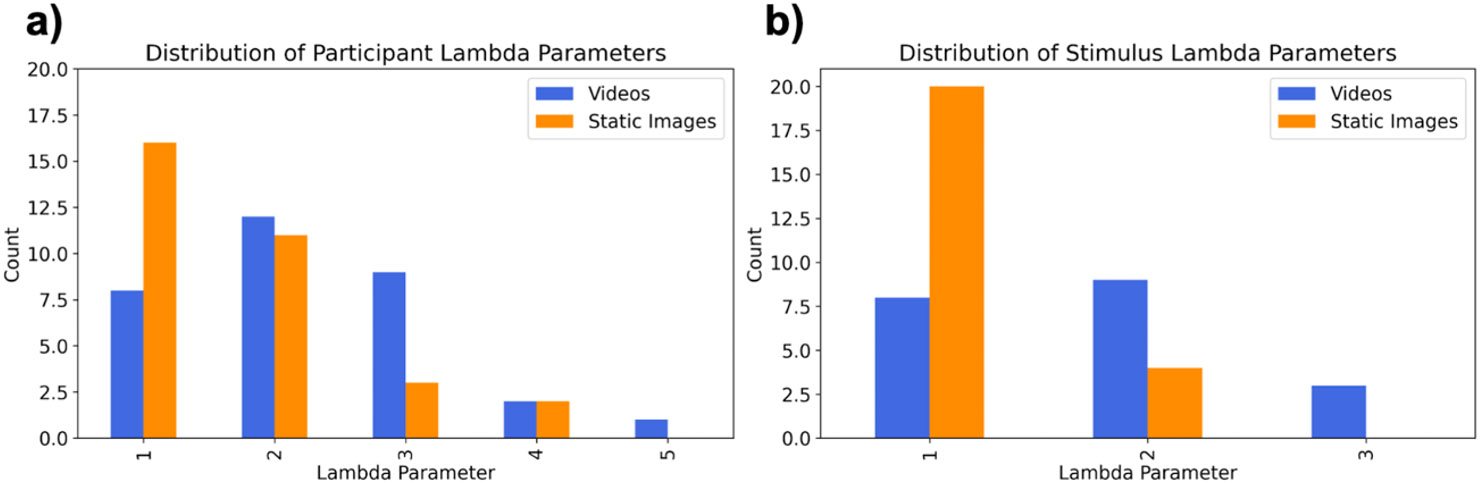
(a) Distribution of optimal lambda parameters when distributions were fit separately per participant. (c) Distribution of optimal lambda parameters when distributions were fit separately per stimulus.
Discussion
Study 3 replicated the pattern of findings observed in Studies 1 and 2: no video stimulus, and very few static images, evoked instances that met high benchmarks for both reliability and exclusivity, even when stimuli were selected to provide the best chance of observing a typology. Model fitting analyses also largely replicated findings from the previous two studies; there was variation in the best-fitting distributions, with the majority of most probable lambdas greater than one for instances evoked by video stimuli. For instances evoked by static image stimuli, model fitting analyses also revealed variation in the best-fitting distributions, yet the majority of distributions had a lambda of only one. Static images may have evoked instances of a single emotion category more than videos, however they were still not reliably categorized with a single category in a majority of participants.
General Discussion
Psychological science has a history of relying on group aggregates to simplify and abstract away from the tremendous variation observed across individuals (Danziger, 1990). Correspondingly, current studies of emotion usually use group-averaged norms to assign singular folk emotion category labels to the stimuli that are used to evoke emotions in the lab, yet these labels may not accurately or specifically evoke instances of the labeled emotion. In the present study, we systematically demonstrate that variation across self-reported instances is a reliable and consistent finding that persisted across hundreds of stimuli, multiple self-report methods, and multiple stimulus types. Across three studies, we found that, by and large, stimuli do not reliably and exclusively evoke an experience of the same self-reported emotion category across participants. This observation held for two different response types (forced-choice and free-labeling), across more than 700 stimuli (including longer videos, shorter videos, and static images), including normed stimuli from past studies (Cowen & Keltner, 2017). We also conducted a series of model fitting analyses to examine participants’ overall tendencies to use only a single emotion category label, or more than one emotion category label, when reporting their experiences. Results showed that participants often used two or more labels to describe their emotional experiences. These findings were not due to reporting synonyms since the same two labels (e.g. afraid and anxious) only co-occurred in a maximum of 10.1% of responses. In other words, the responses were not dominated by the same pair of words consistently being used together. Of note, the highest co-occurring pairs differed across each study (Study 1: afraid and anxious; Study 2: joy and happy, anger and disgust; Study 3: sad and pity). Hierarchical clustering of word co-occurrence (described in Supplementary Materials) also revealed co-occurring responses that largely organized into clusters of positive and negative valence, with heterogeneity in how specific positive or negatively valenced words tended to be used together across the three studies (Supplementary Figure 7).
These observations, which highlight considerable within-category variation and low category specificity/exclusivity, are consistent with past norming studies (e.g., Gross & Levenson, 1995; Sato et al., 2007) and are importantly at odds with the assumptions grounding a typological view of emotion. From a typological perspective, a stimulus might occasionally evoke an instance of a different category, or an instance with multiple labels, but presumably this should occur with low frequency, at the fuzzy boundaries of a category. By contrast, our findings suggest that stimuli evoke instances of different categories across individuals with a high frequency, with more than one label frequently being used to categorize a given person’s experience.
Our findings of variation are consistent with a populations view of emotion, which hypothesizes meaningful, situated variation in the features of a category (Barrett, 2017a, 2017b, 2022). This view draws on Darwin’s population thinking in On the Origin of Species (Darwin, 1859), which proposed that a biological category, such as a species, is a category of diverse individuals that vary in their physical features (Mayr, 2004). In the science of emotion, population thinking is supported by numerous studies that have documented variation not only in self report, but also in expressive facial configurations (Barrett et al., 2019; Le Mau et al., 2021), peripheral physiology (Hoemann et al., 2020; McVeigh et al., 2023; Siegel et al., 2018), and in neural activation patterns (Azari et al., 2020; Lebois et al., 2015; Wang et al., 2022; Wilson-Mendenhall et al., 2011, 2015), activation dynamics (Chang et al., 2021; Singh et al., 2021) and functional connectivity (Doyle et al., 2022) during emotional experience.
Drawing on population thinking, a constructionist view of emotion hypothesizes that instances of emotion emerge as the brain continuously creates meaning of sense data from the external environment (exteroceptive) and from the body (interoceptive) by drawing on past experience to construct situation-specific categories (Barrett, 2017a, 2017b, 2022; Satpute & Lindquist, 2019; Shaffer et al., 2022). This hypothesis can be used to help understand our observation of multiple, variable emotion words across participants when categorizing experiences evoked by the same stimulus: if categories are continuously constructed using memories from the past that are similar in some way to the current situation, then those momentary, ad-hoc categories would vary based on the features of equivalence in a particular situation for a particular individual. For example, if the most important feature (or pattern of features) for a given situation is a change in heart rate, or high arousal, then a given person’s constructed category may draw from instances across multiple different folk categories (e.g., fear, anger, disgust), resulting in a ‘mixed’ emotional experience. Such an experience would then be described with multiple category labels (Hoemann et al., 2017). Labels will also vary from individual to individual, based on each person’s experiences. From a constructionist perspective, then, the use of multiple emotion category labels to describe a given experience, as well as the observed variation across participants in the self-reported emotion categories evoked by the same stimulus, are expected findings.
Our findings have practical implications for future research, highlighting the need for a populations-based framework to guide both study design and analysis. A populations-based approach begins with researchers explicitly defining the population they aim to generalize to, which can be as broad (e.g., all manner of fearful instances) or as narrow (e.g., fear of flying) as the researchers desire. Researchers should then sample as widely as possible within the defined distribution, and contextualize research conclusions based on the population definition and sampling approach. This strategy contrasts with a typological approach wherein an emotion category is sampled in a particular way (e.g., fear of electrical stimulation), conditions are modeled as fixed effects (rather than sampling from a distribution), and yet findings are assumed to generalize to the emotion category more broadly, beyond the specified sampling distribution.
Our findings suggest that if the goal is to model category-level emotion representations, then researchers should sample stimuli widely and robustly and use idiographic analytical approaches that explicitly model subject-level variability. This approach, while challenging, is becoming more tractable with high density sampling experimental designs, the availability of large stimulus databases as well as emerging artificial intelligence solutions for generating stimuli (e.g., Jolly et al., 2022; OpenAI, n.d.), and subject-level data-driven analytical approaches (e.g., Azari et al., 2020; Hoemann et al., 2020; McVeigh et al., 2023). Studies adopting this approach will be able to test, rather than assume, whether the simplifying assumptions of the conventional, nomothetic approach are ultimately supported or not. Indeed, our findings suggest that assumptions underlying the nomothetic approach do not hold for self-report data at least. If idiographic analyses are not feasible, evaluating research from a population-based perspective can still be useful for researchers to identify constraints on generalization and the theory-laden assumptions underlying the study (Westlin et al., 2023).
The observed variation in how people respond to affective stimuli across our studies emphasizes the importance of collecting individual reports of emotional experience, as well as variables that may help predict or structure this variation. These measures may include affective features (e.g., how pleasant or unpleasant the instance feels, how arousing the instance feels; Barrett & Bliss-Moreau, 2009; Russell & Barrett, 1999), appraisal features (e.g., whether the situation is experienced as novel or familiar, as effortful, etc.; Barrett et al., 2007; Clore & Ortony, 2008; Ortony et al., 2022; Scherer et al., 2017), and functional, goal-based features (e.g., to avoid a predator, to win a competition; Adolphs, 2017; Lazarus, 1966, 1991).
Constraints on Generality
Our investigation relied on samples of predominantly White, English-speaking participants recruited through Amazon Mechanical Turk. Despite sampling from a relatively homogeneous group of participants, we observed tremendous variation across participants. While our exact findings may differ across more diverse samples, we would expect to observe even more variation when sampling from a more diverse group. Another consideration is the generalization boundaries of the experimental paradigm. Our conclusions pertain to typical laboratory experiments in affective science which predominantly use visual stimuli to induce emotional experiences. Notably, our findings generalized across static and dynamic visual stimuli and across distinct response formats (free-labeling and forced-choice). Future work may investigate whether similar results occur in other experimental contexts such as studies conducted outside of laboratory settings in more naturalistic contexts.
Conclusion
Across three studies, we observed reliable and consistent variation in self-reported emotional instances that persisted across hundreds of stimuli, as well as multiple self-report methods and stimulus types. These findings are inconsistent with the typological assumption that emotions are organized as discrete categories. Rather, they suggest that the use of group-averaged, normative ratings is a misplaced practice that masks tremendous variation. Considerable scientific opportunities await if scientists apply an alternative approach guided by population thinking (i.e. multifaceted measurement, idiographic, data-driven modeling approaches), and take seriously the possibility of meaningful, structured variation in emotional experience.
Supplementary Material
Acknowledgments
This work was supported by grants from the National Science Foundation (BCS 1947972), the National Institutes of Health (R01 AG071173), the U.S. Army Research Institute for the Behavioral and Social Sciences (W911NF-16-1-019), and the Unlikely Collaborators Foundation. The views, opinions, and/or findings contained in this manuscript are those of the authors and shall not be construed as an official Department of the Army position, policy, or decision, unless so designated by other documents, nor do they necessarily reflect the views of the Unlikely Collaborators Foundation.
References
- Adolphs R. (2017). How should neuroscience study emotions? By distinguishing emotion states, concepts, and experiences. Social Cognitive and Affective Neuroscience, 12(1), 24–31. 10.1093/scan/nsw153 [DOI] [PMC free article] [PubMed] [Google Scholar]
- Azari B, Westlin C, Satpute AB, Hutchinson JB, Kragel PA, Hoemann K, Khan Z, Wormwood JB, Quigley KS, Erdogmus D, Dy J, Brooks DH, & Barrett LF (2020). Comparing supervised and unsupervised approaches to emotion categorization in the human brain, body, and subjective experience. Scientific Reports, 10(1), Article 1. 10.1038/s41598-020-77117-8 [DOI] [PMC free article] [PubMed] [Google Scholar]
- Bakan D. (1967). On Method: Toward a Reconstruction of Psychological Investigation. Jossey-Bass. [Google Scholar]
- Barke A, Stahl J, & Kröner-Herwig B (2012). Identifying a subset of fear-evoking pictures from the IAPS on the basis of dimensional and categorical ratings for a German sample. Journal of Behavior Therapy and Experimental Psychiatry, 43(1), 565–572. 10.1016/j.jbtep.2011.07.006 [DOI] [PubMed] [Google Scholar]
- Barrett LF (2004). Feelings or Words? Understanding the Content in Self-Report Ratings of Experienced Emotion. Journal of Personality and Social Psychology, 87(2), 266–281. 10.1037/0022-3514.87.2.266 [DOI] [PMC free article] [PubMed] [Google Scholar]
- Barrett LF (2006). Are Emotions Natural Kinds? Perspectives on Psychological Science, 1(1), 28–58. 10.1111/j.1745-6916.2006.00003.x [DOI] [PubMed] [Google Scholar]
- Barrett LF (2013). Psychological Construction: The Darwinian Approach to the Science of Emotion. Emotion Review, 5(4), 379–389. 10.1177/1754073913489753 [DOI] [Google Scholar]
- Barrett LF (2017a). How emotions are made: The secret life of the brain. Houghton Mifflin Harcourt. [Google Scholar]
- Barrett LF (2017b). The theory of constructed emotion: An active inference account of interoception and categorization. Social Cognitive and Affective Neuroscience, 12(1), 1–23. 10.1093/scan/nsw154 [DOI] [PMC free article] [PubMed] [Google Scholar]
- Barrett LF (2022). Context reconsidered: Complex signal ensembles, relational meaning, and population thinking in psychological science. American Psychologist, 77(8), 894–920. 10.1037/amp0001054 [DOI] [PMC free article] [PubMed] [Google Scholar]
- Barrett LF, Adolphs R, Marsella S, Martinez AM, & Pollak SD (2019). Emotional Expressions Reconsidered: Challenges to Inferring Emotion From Human Facial Movements. Psychological Science in the Public Interest, 20(1), 1–68. 10.1177/1529100619832930 [DOI] [PMC free article] [PubMed] [Google Scholar]
- Barrett LF, & Bliss-Moreau E (2009). Affect as a Psychological Primitive. In Advances in Experimental Social Psychology (Vol. 41, pp. 167–218). Elsevier. 10.1016/S0065-2601(08)00404-8 [DOI] [PMC free article] [PubMed] [Google Scholar]
- Barrett LF, Mesquita B, Ochsner KN, & Gross JJ (2007). The Experience of Emotion. Annual Review of Psychology, 58(1), 373–403. 10.1146/annurev.psych.58.110405.085709 [DOI] [PMC free article] [PubMed] [Google Scholar]
- Barrett LF, & Satpute AB (2019). Historical pitfalls and new directions in the neuroscience of emotion. Neuroscience Letters, 693, 9–18. 10.1016/j.neulet.2017.07.045 [DOI] [PMC free article] [PubMed] [Google Scholar]
- Barrett LF, & Theriault J (in press). What’s real? A philosophy of science for social psychology. In Gilbert D, Fiske ST, Finkel E, & Mendes WB (Eds.), The Handbook of Social Psychology (6th ed.). [Google Scholar]
- Barrett LF, & Westlin C (2021). Navigating the science of emotion. In Emotion measurement, 2nd ed (pp. 39–84). Elsevier. 10.1016/B978-0-12-821124-3.00002-8 [DOI] [Google Scholar]
- Brunswik E. (1949). Systematic and Representative Design of Psychological Experiments. With Results in Physical and Social Perception. In Proceedings of the [First] Berkeley Symposium on Mathematical Statistics and Probability (Vol. 1, pp. 143–203). University of California Press. https://projecteuclid.org/ebooks/berkeley-symposium-on-mathematical-statistics-and-probability/Proceedings-of-the-First-Berkeley-Symposium-on-Mathematical-Statistics-and/chapter/Systematic-and-Representative-Design-of-Psychological-Experiments-With-Results-in/bsmsp/1166219204 [Google Scholar]
- Cabral JCC, Tavares P. de S., Weydmann GJ, das Neves VT, & de Almeida RMM (2018). Eliciting Negative Affects Using Film Clips and Real-Life Methods. Psychological Reports, 121(3), 527–547. 10.1177/0033294117730844 [DOI] [PubMed] [Google Scholar]
- Chang LJ, Jolly E, Cheong JH, Rapuano KM, Greenstein N, Chen P-HA, & Manning JR (2021). Endogenous variation in ventromedial prefrontal cortex state dynamics during naturalistic viewing reflects affective experience. Science Advances, 7(17), eabf7129. 10.1126/sciadv.abf7129 [DOI] [PMC free article] [PubMed] [Google Scholar]
- Chen P, Dai T, Spector P, & Jex S (1997). Relation Between Negative Affectivity and Positive Affectivity: Effects of Judged Desirability of Scale Items and Respondents’ Social Desirability. Journal of Personality Assessment, 69(1), 183–198. 10.1207/s15327752jpa6901_10 [DOI] [Google Scholar]
- Choe W, Chun H-S, Noh J, Lee S-D, & Zhang B-T (2013). Estimating Multiple Evoked Emotions from Videos. Proceedings of the Annual Meeting of the Cognitive Science Society, 35(35). [Google Scholar]
- Clark-Polner E, Johnson TD, & Barrett LF (2017). Multivoxel Pattern Analysis Does Not Provide Evidence to Support the Existence of Basic Emotions. Cerebral Cortex (New York, N.Y.: 1991), 27(3), 1944–1948. 10.1093/cercor/bhw028 [DOI] [PMC free article] [PubMed] [Google Scholar]
- Clore GL, & Ortony A (2008). Appraisal theories: How cognition shapes affect into emotion. In Handbook of emotions, 3rd ed (pp. 628–642). The Guilford Press. [Google Scholar]
- Conway MA, Dewhurst SA, Pearson N, & Sapute A (2001). The self and recollection reconsidered: How a "failure to replicate’ failed and why trace strength accounts of recollection are untenable. Applied Cognitive Psychology, 15(6), 673–686. 10.1002/acp.740 [DOI] [Google Scholar]
- Cordaro DT, Sun R, Keltner D, Kamble S, Huddar N, & McNeil G (2018). Universals and cultural variations in 22 emotional expressions across five cultures. Emotion (Washington, D.C.), 18(1), 75–93. 10.1037/emo0000302 [DOI] [PubMed] [Google Scholar]
- Cowen AS, & Keltner D (2017). Self-report captures 27 distinct categories of emotion bridged by continuous gradients. Proceedings of the National Academy of Sciences of the United States of America, 114(38), E7900–E7909. 10.1073/pnas.1702247114 [DOI] [PMC free article] [PubMed] [Google Scholar]
- Cowen AS, & Keltner D (2021). Semantic Space Theory: A Computational Approach to Emotion. Trends in Cognitive Sciences, 25(2), 124–136. 10.1016/j.tics.2020.11.004 [DOI] [PubMed] [Google Scholar]
- Danziger K. (1990). Constructing the Subject: Historical Origins of Psychological Research. Cambridge University Press. 10.1017/CBO9780511524059 [DOI] [Google Scholar]
- Darwin C. (1859). On the Origin of Species. John Murray. [Google Scholar]
- Dawis RV (2000). Scale construction and psychometric considerations. In Handbook of applied multivariate statistics and mathematical modeling (pp. 65–94). Academic Press. 10.1016/B978-012691360-6/50004-5 [DOI] [Google Scholar]
- Doyle CM, Lane ST, Brooks JA, Wilkins RW, Gates KM, & Lindquist KA (2022). Unsupervised Classification Reveals Consistency and Degeneracy in Neural Network Patterns of Emotion. Social Cognitive and Affective Neuroscience, nsac028. 10.1093/scan/nsac028 [DOI] [PMC free article] [PubMed] [Google Scholar]
- Dubova M, & Goldstone RL (2023). Carving joints into nature: Reengineering scientific concepts in light of concept-laden evidence. Trends in Cognitive Sciences, 0(0). 10.1016/j.tics.2023.04.006 [DOI] [PubMed] [Google Scholar]
- Ekman P, & Cordaro D (2011). What is meant by calling emotions basic. Emotion Review, 3, 364–370. 10.1177/1754073911410740 [DOI] [Google Scholar]
- Elfenbein HA, Beaupré M, Lévesque M, & Hess U (2007). Toward a dialect theory: Cultural differences in the expression and recognition of posed facial expressions. Emotion, 7(1), 131–146. 10.1037/1528-3542.7.1.131 [DOI] [PubMed] [Google Scholar]
- Estes WK (1956). The problem of inference from curves based on group data. Psychological Bulletin, 53(2), 134–140. 10.1037/h0045156 [DOI] [PubMed] [Google Scholar]
- Farahvash MR, Abianeh SH, Farahvash B, Farahvash Y, Yagoobi A, & Nazparvar B (2010). Anatomic Variations of Midfacial Muscles and Nasolabial Crease: A Survey on 52 Hemifacial Dissections in Fresh Persian Cadavers. Aesthetic Surgery Journal, 30(1), 17–21. 10.1177/1090820X09360703 [DOI] [PubMed] [Google Scholar]
- Flournoy JC, Bryce NV, Dennison MJ, Rodman AM, McNeilly EA, Lurie LA, Bitran D, Reid-Russell A, Vidal Bustamante CM, Madhyastha T, & McLaughlin KA (2024). A precision neuroscience approach to estimating reliability of neural responses during emotion processing: Implications for task-fMRI. NeuroImage, 285, 120503. 10.1016/j.neuroimage.2023.120503 [DOI] [PMC free article] [PubMed] [Google Scholar]
- Gabert-Quillen CA, Bartolini EE, Abravanel BT, & Sanislow CA (2015). Ratings for emotion film clips. Behavior Research Methods, 47(3), 773–787. 10.3758/s13428-014-0500-0 [DOI] [PMC free article] [PubMed] [Google Scholar]
- Gallistel CR (2012). On the evils of group averaging: Commentary on Nevin’s “Resistance to extinction and behavioral momentum”. Behavioural Processes, 90(1), 98–99. 10.1016/j.beproc.2012.02.013 [DOI] [PubMed] [Google Scholar]
- Gendron M, Crivelli C, & Barrett LF (2018). Universality Reconsidered: Diversity in Making Meaning of Facial Expressions. Current Directions in Psychological Science, 27(4), 211–219. 10.1177/0963721417746794 [DOI] [PMC free article] [PubMed] [Google Scholar]
- Gerrards-Hesse A, Spies K, & Hesse FW (1994). Experimental inductions of emotional states and their effectiveness: A review. British Journal of Psychology, 85, 55–78. 10.1111/j.2044-8295.1994.tb02508.x [DOI] [Google Scholar]
- Gilman TL, Shaheen R, Nylocks KM, Halachoff D, Chapman J, Flynn JJ, Matt LM, & Coifman KG (2017). A film set for the elicitation of emotion in research: A comprehensive catalog derived from four decades of investigation. Behavior Research Methods, 49(6), 2061–2082. 10.3758/s13428-016-0842-x [DOI] [PubMed] [Google Scholar]
- Gross JJ, & Levenson RW (1995). Emotion elicitation using films. Cognition and Emotion, 9, 87–108. 10.1080/02699939508408966 [DOI] [Google Scholar]
- Haight FA (1967). Handbook of the Poisson Distribution. Wiley. [Google Scholar]
- Hazer D, Ma X, Rukavina S, Gruss S, Walter S, & Traue HC (2015). Emotion Elicitation Using Film Clips: Effect of Age Groups on Movie Choice and Emotion Rating. In Stephanidis C (Ed.), HCI International 2015—Posters’ Extended Abstracts (pp. 110–116). Springer International Publishing. 10.1007/978-3-319-21380-4_20 [DOI] [Google Scholar]
- Hegefeld HM, Satpute AB, Ochsner KN, Davidow JY, & Nook EC (2023). Fluency generating emotion words correlates with verbal measures but not emotion regulation, alexithymia, or depressive symptoms. Emotion (Washington, D.C.). 10.1037/emo0001229 [DOI] [PubMed] [Google Scholar]
- Hoemann K, Gendron M, & Barrett LF (2017). Mixed emotions in the predictive brain. Current Opinion in Behavioral Sciences, 15, 51–57. 10.1016/j.cobeha.2017.05.013 [DOI] [PMC free article] [PubMed] [Google Scholar]
- Hoemann K, Khan Z, Feldman MJ, Nielson C, Devlin M, Dy J, Barrett LF, Wormwood JB, & Quigley KS (2020). Context-aware experience sampling reveals the scale of variation in affective experience. Scientific Reports, 10(1), 12459. 10.1038/s41598-020-69180-y [DOI] [PMC free article] [PubMed] [Google Scholar]
- Hoemann K, Warfel E, Mills C, Allen L, Kuppens P, & Wormwood JB (2024). Using Freely Generated Labels Instead of Rating Scales to Assess Emotion in Everyday Life. Assessment, 10731911241283623. 10.1177/10731911241283623 [DOI] [PubMed] [Google Scholar]
- Horikawa T, Cowen AS, Keltner D, & Kamitani Y (2020). The Neural Representation of Visually Evoked Emotion Is High-Dimensional, Categorical, and Distributed across Transmodal Brain Regions. iScience, 23(5). 10.1016/j.isci.2020.101060 [DOI] [PMC free article] [PubMed] [Google Scholar]
- Izard CE (1977). Human Emotions. Springer US. 10.1007/978-1-4899-2209-0 [DOI] [Google Scholar]
- Jolly E, Farrens M, Greenstein N, Eisenbarth H, Reddan MC, Andrews E, Wager TD, & Chang LJ (2022). Recovering Individual Emotional States from Sparse Ratings Using Collaborative Filtering. Affective Science, 3(4), 799–817. 10.1007/s42761-022-00161-2 [DOI] [PMC free article] [PubMed] [Google Scholar]
- Kazak AE (2018). Editorial: Journal article reporting standards. American Psychologist, 73(1), 1–2. 10.1037/amp0000263 [DOI] [PubMed] [Google Scholar]
- Keltner D, Brooks JA, & Cowen A (2023). Semantic Space Theory: Data-Driven Insights Into Basic Emotions. Current Directions in Psychological Science, 09637214221150511. 10.1177/09637214221150511 [DOI] [Google Scholar]
- Lang PJ, Bradley MM, & Cuthbert BN (2008). International affective picture system (IAPS): Affective ratings of pictures and instruction manual (A-8). University of Florida. [Google Scholar]
- Lazarus RS (1966). Psychological stress and the coping process. McGraw-Hill. [Google Scholar]
- Lazarus RS (1991). Emotion and adaptation. Oxford University Press. [Google Scholar]
- Le Mau T, Hoemann K, Lyons SH, Fugate JMB, Brown EN, Gendron M, & Barrett LF (2021). Professional actors demonstrate variability, not stereotypical expressions, when portraying emotional states in photographs. Nature Communications, 12(1), Article 1. 10.1038/s41467-021-25352-6 [DOI] [PMC free article] [PubMed] [Google Scholar]
- Lebois LAM, Papies EK, Gopinath K, Cabanban R, Quigley KS, Krishnamurthy V, Barrett LF, & Barsalou LW (2015). A shift in perspective: Decentering through mindful attention to imagined stressful events. Neuropsychologia, 75, 505–524. 10.1016/j.neuropsychologia.2015.05.030 [DOI] [PMC free article] [PubMed] [Google Scholar]
- Lench HC, Flores SA, & Bench SW (2011). Discrete emotions predict changes in cognition, judgment, experience, behavior, and physiology: A meta-analysis of experimental emotion elicitations. Psychological Bulletin, 137, 834–855. 10.1037/a0024244 [DOI] [PubMed] [Google Scholar]
- Levenson RW (2007). Emotion elicitation with neurological patients. In Handbook of emotion elicitation and assessment (pp. 158–168). Oxford University Press. [Google Scholar]
- Maffei A, & Angrilli A (2019). E-MOVIE - Experimental MOVies for Induction of Emotions in neuroscience: An innovative film database with normative data and sex differences. PLOS ONE, 14(10), e0223124. 10.1371/journal.pone.0223124 [DOI] [PMC free article] [PubMed] [Google Scholar]
- Martin M. (1990). On the induction of mood. Clinical Psychology Review, 10, 669–697. 10.1016/0272-7358(90)90075-L [DOI] [Google Scholar]
- Mayr E. (2004). What Makes Biology Unique?: Considerations on the Autonomy of a Scientific Discipline. Cambridge University Press. [Google Scholar]
- McVeigh K, Kleckner IR, Quigley KS, & Satpute AB (2023). Fear-related psychophysiological patterns are situation and individual dependent: A Bayesian model comparison approach. Emotion, No Pagination Specified-No Pagination Specified. 10.1037/emo0001265 [DOI] [PMC free article] [PubMed] [Google Scholar]
- Mikels JA, Fredrickson BL, Larkin GR, Lindberg CM, Maglio SJ, & Reuter-Lorenz PA (2005). Emotional category data on images from the international affective picture system. Behavior Research Methods, 37(4), 626–630. 10.3758/BF03192732 [DOI] [PMC free article] [PubMed] [Google Scholar]
- Nook EC, Satpute AB, & Ochsner KN (2021). Emotion Naming Impedes Both Cognitive Reappraisal and Mindful Acceptance Strategies of Emotion Regulation. Affective Science, 2(2), 187–198. 10.1007/s42761-021-00036-y [DOI] [PMC free article] [PubMed] [Google Scholar]
- OpenAI. (n.d.). Sora: Creating video from text. [Computer software]. https://openai.com/sora.
- Ortony A, Clore G, & Collins A (2022). The Cognitive Structure of Emotion. In Contemporary Sociology (2nd ed., Vol. 18). Cambridge University Press. 10.2307/2074241 [DOI] [Google Scholar]
- Panksepp J. (1998). Affective neuroscience: The foundations of human and animal emotions. Oxford University Press. [Google Scholar]
- Panksepp J. (2000). Emotions as natural kinds within the mammalian brain. Handbook of Emotions. [Google Scholar]
- Philippot P. (1993). Inducing and assessing differentiated emotion-feeling states in the laboratory. Cognition and Emotion, 7, 171–193. 10.1080/02699939308409183 [DOI] [PubMed] [Google Scholar]
- Roseman IJ (2011). Emotional behaviors, emotivational goals, emotion strategies: Multiple levels of organization integrate variable and consistent responses. Emotion Review, 3, 434–443. 10.1177/1754073911410744 [DOI] [Google Scholar]
- Rottenberg J, Ray RD, & Gross JJ (2007). Emotion elicitation using films. In Handbook of emotion elicitation and assessment (pp. 9–28). Oxford University Press. [Google Scholar]
- Russell JA (1991). In defense of a prototype approach to emotion concepts. Journal of Personality and Social Psychology, 60, 37–47. 10.1037/0022-3514.60.1.37 [DOI] [Google Scholar]
- Russell JA (1994). Is there universal recognition of emotion from facial expression? A review of the cross-cultural studies. Psychological Bulletin, 115(1), 102–141. 10.1037/0033-2909.115.1.102 [DOI] [PubMed] [Google Scholar]
- Russell JA, & Barrett LF (1999). Core affect, prototypical emotional episodes, and other things called emotion: Dissecting the elephant. Journal of Personality and Social Psychology, 76(5), 805–819. 10.1037/0022-3514.76.5.805 [DOI] [PubMed] [Google Scholar]
- Sato W, Noguchi M, & Yoshikawa S (2007). EMOTION ELICITATION EFFECT OF FILMS IN A JAPANESE SAMPLE. Social Behavior and Personality: An International Journal, 35(7), 863–874. 10.2224/sbp.2007.35.7.863 [DOI] [Google Scholar]
- Satpute AB, & Lindquist KA (2019). The Default Mode Network’s Role in Discrete Emotion. Trends in Cognitive Sciences, 23(10), 851–864. 10.1016/j.tics.2019.07.003 [DOI] [PMC free article] [PubMed] [Google Scholar]
- Schaefer A, Nils F, Sanchez X, & Philippot P (2010). Assessing the effectiveness of a large database of emotion-eliciting films: A new tool for emotion researchers. Cognition and Emotion, 24, 1153–1172. 10.1080/02699930903274322 [DOI] [Google Scholar]
- Scherer KR, Mortillaro M, & Mehu M (2017). Facial expression is driven by appraisal and generates appraisal inference. In The science of facial expression (pp. 353–373). Oxford University Press. [Google Scholar]
- Schwarz N. (1999). Self-reports: How the questions shape the answers. American Psychologist, 54(2), 93–105. 10.1037/0003-066X.54.2.93 [DOI] [Google Scholar]
- Shaffer C, Westlin C, Quigley KS, Whitfield-Gabrieli S, & Barrett LF (2022). Allostasis, Action, and Affect in Depression: Insights from the Theory of Constructed Emotion. Annual Review of Clinical Psychology, 18, 553–580. 10.1146/annurev-clinpsy-081219-115627 [DOI] [PMC free article] [PubMed] [Google Scholar]
- Shimada K, & Gasser RF (1989). Variations in the facial muscles at the angle of the mouth. Clinical Anatomy, 2(3), 129–134. 10.1002/ca.980020302 [DOI] [Google Scholar]
- Sidman M (1960). Tactics of scientific research: Evaluating experimental data in psychology (pp. x, 428). Basic Books. [Google Scholar]
- Siegel EH, Sands MK, Van den Noortgate W, Condon P, Chang Y, Dy J, Quigley KS, & Barrett LF (2018). Emotion Fingerprints or Emotion Populations? A Meta-Analytic Investigation of Autonomic Features of Emotion Categories. Psychological Bulletin, 144(4), 343–393. 10.1037/bul0000128 [DOI] [PMC free article] [PubMed] [Google Scholar]
- Singh A, Westlin C, Eisenbarth H, Reynolds Losin EA, Andrews-Hanna JR, Wager TD, Satpute AB, Barrett LF, Brooks DH, & Erdogmus D (2021). Variation is the Norm: Brain State Dynamics Evoked By Emotional Video Clips. 2021 43rd Annual International Conference of the IEEE Engineering in Medicine & Biology Society (EMBC), 6003–6007. 10.1109/EMBC46164.2021.9630852 [DOI] [PMC free article] [PubMed] [Google Scholar]
- Wang Y, Kragel PA, & Satpute AB (2022). Neural predictors of subjective fear depend on the situation (p. 2022.10.20.513114). bioRxiv. 10.1101/2022.10.20.513114 [DOI] [Google Scholar]
- Westermann R, Spies K, Stahl G, & Hesse FW (1996). Relative effectiveness and validity of mood induction procedures: A meta-analysis. European Journal of Social Psychology, 26, 557–580. [DOI] [Google Scholar]
- Westlin C, Theriault JE, Katsumi Y, Nieto-Castanon A, Kucyi A, Ruf SF, Brown SM, Pavel M, Erdogmus D, Brooks DH, Quigley KS, Whitfield-Gabrieli S, & Barrett LF (2023). Improving the study of brain-behavior relationships by revisiting basic assumptions. Trends in Cognitive Sciences, 27(3), 246–257. 10.1016/j.tics.2022.12.015 [DOI] [PMC free article] [PubMed] [Google Scholar]
- Wilson-Mendenhall CD, Barrett LF, & Barsalou LW (2015). Variety in emotional life: Within-category typicality of emotional experiences is associated with neural activity in large-scale brain networks. Social Cognitive and Affective Neuroscience, 10(1), 62–71. 10.1093/scan/nsu037 [DOI] [PMC free article] [PubMed] [Google Scholar]
- Wilson-Mendenhall CD, Barrett LF, Simmons WK, & Barsalou LW (2011). Grounding emotion in situated conceptualization. Neuropsychologia, 49(5), 1105–1127. 10.1016/j.neuropsychologia.2010.12.032 [DOI] [PMC free article] [PubMed] [Google Scholar]
- Zupan B, & Babbage DR (2017). Film clips and narrative text as subjective emotion elicitation techniques. The Journal of Social Psychology, 157, 194–210. 10.1080/00224545.2016.1208138 [DOI] [PubMed] [Google Scholar]
Associated Data
This section collects any data citations, data availability statements, or supplementary materials included in this article.