

Abstract
Understanding the response of innate immune cells to pathogens may provide insights to host defenses and the tactics used by pathogens to circumvent these defenses. We used DNA microarrays to explore the responses of human macrophages to a variety of bacteria. Macrophages responded to a broad range of bacteria with a robust, shared pattern of gene expression. The shared response includes genes encoding receptors, signal transduction molecules, and transcription factors. This shared activation program transforms the macrophage into a cell primed to interact with its environment and to mount an immune response. Further study revealed that the activation program is induced by bacterial components that are Toll-like receptor agonists, including lipopolysaccharide, lipoteichoic acid, muramyl dipeptide, and heat shock proteins. Pathogen-specific responses were also apparent in the macrophage expression profiles. Analysis of Mycobacterium tuberculosis-specific responses revealed inhibition of interleukin-12 production, suggesting one means by which this organism survives host defenses. These results improve our understanding of macrophage defenses, provide insights into mechanisms of pathogenesis, and suggest targets for therapeutic intervention.
Host–pathogen relationships are characterized by the complex interplay between host defense mechanisms and attempts to circumvent these defenses by microorganisms (1, 2). Macrophages play key roles in host defense by recognizing, engulfing, and killing microorganisms (3). Among the microorganisms recognized by macrophages, bacteria are an important and highly diverse class of human pathogens. Bacterial pathogens that overcome host defenses ensure their ability to survive and propagate (4). Therefore, a thorough understanding of the normal host response to bacteria provides a foundation to understand bacterial tactics for evading these responses and thus disease prevention.
The extent to which macrophage responses to different bacteria are distinct or similar at the level of transcription is not understood. Given the cellular components shared between bacteria and the signaling pathway shared by Toll-like receptors (TLR) that respond to these components (5), macrophages may respond to all bacteria in a standard fashion. However, the diversity of bacteria and the differences in their pathogenesis may also lead to pathogen-specific responses. For example, some microorganisms, like Mycobacterium tuberculosis, survive within macrophages (4) and might be expected to elicit specific changes in their host phagocytes.
To improve our understanding of host defenses and pathogenesis, we undertook a detailed, comparative examination of the transcriptional responses of macrophages to a variety of bacteria, including a number of pathogens. This experimental approach allowed us to discover the themes that define the innate immune responses of macrophages to bacteria. The macrophage transcriptional responses also discriminate between different pathogens, and analysis of the response to M. tuberculosis yielded insights into the mechanism of pathogenesis.
Materials and Methods
Macrophage Culture.
Freshly elutriated human monocytes (>95% pure) were purchased from Advanced Biotechnologies (Columbia, MD). Monocytes were cultured at a density of 2 × 10⁷ cells/10 ml of DMEM (Invitrogen) with 20% FCS (Intergen, Purchase, NY), 10% human serum (Nabi, Boca Raton, FL), and 50 μg/ml gentamicin (Invitrogen) in Primaria T-25 flasks (Becton Dickinson) for 5 days at 37°C, 5% CO2. On days 5 and 7, half of the media was removed and replaced with media lacking FCS. Media on the cultured macrophages was changed to 5 ml of DMEM with 1% human serum on day 9, 1 hour before experiments were begun.
Macrophage Exposure to Bacteria.
Latex beads (0.8 μm; Sigma) were washed with ethanol and added as described (6). Bacteria were diluted in media to 50 μl containing 108-109 bacteria, to give multiplicities of infection (MOIs) of 5:1 to 50:1, and added to cultures of macrophages. Dilutions were plated on agar plates, and colonies were counted to confirm the accuracy of dilution and viability of bacteria. This range of MOIs was selected because preliminary experiments revealed that, although the expression profiles elicited by different MOIs are largely similar, some genes with low levels of expression are not robustly detected at low mois (see Fig. 10, which is published as supporting information on the PNAS web site, www.pnas.org). Media was removed at 4 h, and cells were washed with Hanks' balanced salt solution (HBSS, Invitrogen) and fed with 5 ml of DMEM with 1% human serum and 50 μg/ml gentamicin. Staphylococcus aureus strain ISP794, derived from strain 8325, and Listeria monocytogenes strain EGD were grown overnight in brain–heart infusion broth, pelleted, and resuspended in 0.5× vol of 20% glycerol to make frozen stocks that were thawed for the experiments. M. tuberculosis Erdman stain, obtained from Tuberculosis Research Materials and Vaccine Testing Contract, and Mycobacterium bovis BCG (ATCC no. 35734) were grown in Middlebrook 7H9 broth with 0.5% glycerol, 0.05% Tween 80, and ADC enrichment (Becton Dickinson). A 6- to 7-day-old culture was used for infection. Escherichia coli strain sd-4 (ATCC no. 11143) was grown in Luria–Bertani medium with streptomycin, and frozen stocks were created as described (6). The Salmonella typhi (Quailes strain), S. typhimurium (ATCC no. 14028) and enterohemorrhagic E. coli O157:H7 (EHEC) were provided as frozen stocks and thawed on the day of the experiment.
Macrophage Exposure to Bacteria Components.
Macrophages were stimulated with isolated and purified bacterial components in media containing 10% human serum over the entire 24-h time course. Endotoxin-free status was verified for all components, and quantitated for lipopolysaccharide (LPS) and heat shock proteins (hsps), by using the Associates of Cape Cod (Falmouth, MA) gel-clot assay at a sensitivity of 0.3 endotoxin units. LPS from E. coli (Sigma, L-2880) and Salmonella (Sigma, L-4774) were added at a final concentration of 1 μg/ml. Lipoteichoic acid (Sigma, L-2515) and muramyl dipeptide (Sigma, A-9519) were added at 10 μg/ml and 100 μg/ml, respectively. Formyl-methionine-leucine-phenylalanine (Sigma, F-3506) was added to 100 nM; protein A to 10 μg/ml; and d-(+)-mannose (Sigma, M-8296) to 25 mM. Staphylococcus protein A (539202) was purchased from Calbiochem. Recombinant mycobacterial hsps were the kind gift of StressGen Biotechnologies (Victoria, BC, Canada) and were used at 10 μg/ml.
cRNA Target Preparation and Array Hybridization.
After incubation, the supernatant was recovered from the flasks, and RNA was harvested from the macrophages by using 2 ml of TriReagent (Molecular Research Center, Cincinnati) according to the manufacturer's protocols. Total RNA was processed and hybridized to Hu6800 GeneChips according to standard Affymetrix (Santa Clara, CA) protocols (7).
Data Analysis.
The data were analyzed by using a custom-built Oracle (Redwood Shores, CA) database, chipdb. Fluorescence intensities were normalized to median array intensities for all conditions tested on cells from a single donor, floored at 50, and fold-change was calculated relative to duplicate time-0 controls. Data were considered significant when (i) expression changed by at least 2-fold at two consecutive time points, or 10-fold (activation program) or 3-fold (differential gene expression) at a single time point, and (ii) increased gene expression included at least one present call (Affymetrix algorithm), or both zero time points were present when gene expression decreased. Additional details are available on the web site supporting this manuscript at http://web.wi.mit.edu/young/pathogens.
Results
Bacteria-Induced Macrophage Activation Program.
Human macrophages derived from primary monocytes were exposed to bacteria and bacterial components, and the resulting expression levels of 6,800 genes were monitored over a 24-h time course by using high density DNA microarrays. The eight bacteria studied were drawn from three broad classes with different cellular components and pathogenesis: Gram-negative bacteria [E. coli, enterohemorrhagic E. coli O157:H7 (EHEC), Salmonella typhi, and S. typhimurium], Gram-positive bacteria (S. aureus and L. monocytogenes), and mycobacteria (M. tuberculosis and M. bovis bacillus Calmette–Guérin).
Analysis of macrophage gene expression data showed that the expression of 977 genes significantly changed on exposure to one or more of the bacteria. Unsupervised hierarchical clustering of these genes (8) revealed prominent groups of genes that had similar changes in expression. Despite the diversity of the bacteria studied, a shared transcriptional response was elicited, consisting of 132 genes induced and 59 repressed (Fig. 1A; the entire data set is displayed in Fig. 4, which is published as supporting information on the PNAS web site). Latex beads failed to induce comparable expression changes (Fig. 1A). The changes in gene expression induced after exposure to bacteria contained, as expected, proinflammatory genes, including many cytokines and chemokines (Fig. 1A, Table 1). The majority of this transcriptional response, however, is comprised of genes that are involved with the interaction between macrophages and their environment. A large number of receptors, signaling molecules, and transcription factors were differentially regulated by macrophages on exposure to bacteria, as were adhesion molecules, genes involved in tissue remodeling, enzymes, and anti-apoptotic molecules. For example, macrophages up-regulated many of the NF-κB pathway members as well as receptors for chemokines (CCR6 and CCR7) and interleukins [IL-7 receptor (IL-7R) and IL-15 receptor α (IL-15RA)], and down-regulated molecules necessary to respond to transforming growth factor β (Table 1). We defined this collection of genes as the macrophage activation program because it represents signaling pathways and induced functions that are triggered on exposure to Gram-negative bacteria, Gram-positive bacteria, and mycobacteria.
Figure 1.

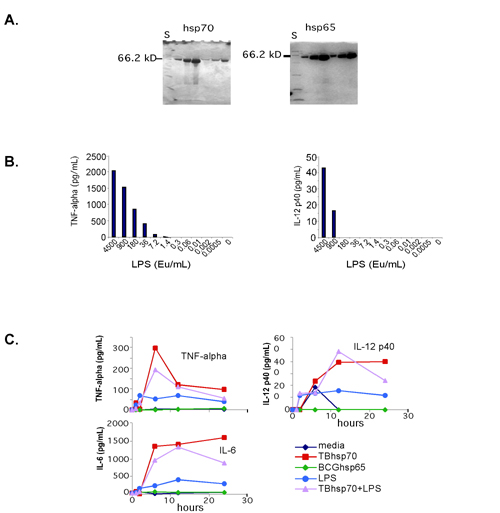
Macrophage activation program elicited in response to a variety of bacteria and bacterial components. (A) The macrophage activation program. Macrophage gene expression was measured at 1, 2, 6, 12, and 24 h after the introduction of bacteria or latex beads. One hundred ninety-one genes met criteria for significant changes (see Materials and Methods) on exposure to six of eight bacteria studied. The genes are ordered along the y axis by category, with the degree of change indicated by color intensity in the color bar. The display has been described in detail elsewhere (8). Minimal gene expression changes occurred in macrophages cultured in media over 24 h (Fig. 6, which is published as supporting information on the PNAS web site). Gene expression changes attributable to individual donors were excluded from this display (Fig. 7, which is published as supporting information on the PNAS web site). (B) A subset of bacterial components elicits much of the activation program (induced genes shown only). Control experiments demonstrated that residual endotoxin contamination of the recombinant hsps was not responsible for the extent of cytokine expression induced by hsps (Fig. 8, which is published as supporting information on the PNAS web site). The idea that the hsps were acting via TLR was supported by the observation that a specific TLR-4 antagonist, Rhodobacter sphaeroides lipid A (32), blocked cytokine production by macrophages exposed to E. coli, LPS, and hsp70 (Fig. 9, which is published as supporting information on the PNAS web site).
Table 1.
Genes of the activation program
| Induced | Repressed | |||
|---|---|---|---|---|
| Cytokines | Signaling | Proliferation | Anti-Inflammatory | Miscellaneous |
| GCSF | CNK | BTG1 | GCHFR | PURA |
| GMCSF | DUSP1 | BTG3 | CAT | MYO1E |
| IL12B | DUSP2 | TNFRSF9 | LTA4H | VCL |
| IL1RN | DUSP5 | TNFSF9 | Pro-Inflammatory | EVI2B |
| IL6 | EBI2 | Tissue remodeling/clotting | CD14 | ADFP |
| IL6 | GBP1 | DAF | ALOX5 | MNDA |
| PBEF | HCK | MMP1 | MCP1 | STAB1 |
| ProIL1B | INHBA | MMP10 | Adhesion | TGFBI |
| TNFA | JAG1 | MMP14 | PECAM1 | ESTs |
| Chemokines | KYNU | SERPINB2 | SPARC | KIAA0022 |
| IL8 | LIMK2 | SERPINB8 | Receptors | Unknown |
| IL8 | MAP2K3 | Stress response | RARA | AD000092 |
| IP10 | MAP3K4 | GADD45A | TNFRSF1A | D87075 |
| MCP1 | MINOR | HSPA1A | ENG | U79288 |
| MGSA | NAF1 | SOD2 | L77730 | P311 |
| MIP1A | NFKB1 | SOD2 | CD36L1 | HG2090-HT2090 |
| MIP1B | PDE4B | Transporters | CD163 | HG2090-HT2090 |
| MIP2A | PPP3CC | ATP2B1 | TGFBR2 | HG2090-HT2090 |
| MIP2B | PTPN1 | NRAMP2 | CSFIR | |
| RANTES | TRAF1 | SLC7A5 | MRC1 | |
| Adhesion | TRIP10 | Enzymes | CD32 | |
| CD44 | Transcription | ADA | P2RX1 | |
| CD44 | DSCR1 | AMPD3 | Signaling | |
| ICAM1 | ELF4 | Beta-1,4-galatosyl transferase | SRPK2 | |
| IFITM1 | ETS2 | BF | SLA | |
| LAMB3 | IRF1 | CKB | MERTK | |
| NINJ1 | IRLB | GJB2 | DAB2 | |
| TNFAIP6 | JUNB | GLCLR | Transcription | |
| Receptors | MRF-1 | HSD11B1 | SF3A3 | |
| ADORA2A | NFKBIA | INDO | EGR2 | |
| CCR6 | NFKBIE | MTF1 | NFATC3 | |
| CCR7 | NFKB p50 | Miscellaneous | MXI1 | |
| CCRL2 | STAT4 | ADM | FOS | |
| DTR | STAT5A | ARHH | Hbrm | |
| EBI3 | TSC22 | B4-2 | Transporters | |
| HM74 | XBP1 | BRCA2 | SLC29A1 | |
| IL15RA | ZFP36 | CD83 | Tissue remodeling/Clotting | |
| IL7R | Pro-inflammatory | GEM | UPA | |
| LDLR | COX2 | GOS | FGL2 | |
| P2RX7 | COX2 | GYPC | TBXAS1 | |
| P2XR | COX2 | H2AFO | Enzymes | |
| PLAUR | GCH1 | HIVEP2 | SGSH | |
| PVR | PTX3 | ISG15 | PPP2R5C | |
| SLAM | Anti-apoptotic | ISG20 | IDH2 | |
| TNFRSF5 | BIRC2 | MACMARKS | LPL | |
| TXN | BIRC3 | MIG2 | MPI | |
| BIRC3 | MX1 | PYGL | ||
| CFLAR | RCN1 | HSD17B4 | ||
| IER3 | SDC4 | RNASE6 | ||
| TNFAIP3 | SNL | GALC | ||
| TNFAIP2 | GLCLC | |||
| TSSC3 | RNASE1 | |||
| ESTs | ME1 | |||
| KIAA0105 | ||||
| KIAA0172 | ||||
The genes of the activation program are listed in the order displayed in Fig. 1 and are categorized by functional class. Several genes are repeated because they appear more than once on the array.
We next tested whether specific bacterial components could elicit the activation program. Macrophages were cultured with purified components specific for Gram-negative bacteria (LPS), Gram-positive bacteria (lipoteichoic acid and protein A), and components shared by all three classes of bacteria [muramyl dipeptide, heat shock proteins (hsp65 and hsp70), formyl-methionine-leucine-phenylalanine, and mannosylated proteins (d-(+)-mannose)]. LPS, lipoteichoic acid, muramyl dipeptide, and hsp65 and hsp70 induced the majority of the activation program (Fig. 1B). The other components failed to induce this set of gene expression changes (Fig. 1B), as did monophosphoryl lipid A (detoxified lipid A). Thus, some, but not all, bacterial components are capable of inducing the activation program.
M. tuberculosis-Specific Macrophage Gene Expression Changes.
To identify the alterations in the host macrophage expression profiles elicited by specific organisms, a difference index was devised. This analysis focused on M. tuberculosis, E. coli, and S. aureus because multiple, independent time course experiments were performed for each of these organisms (Fig. 2A). By using this index, several differentially regulated genes with positive and negative effects on host defenses were identified. M. tuberculosis poorly induced the expression of IL-12 p40 and IL-15, as described in greater detail below. STAF50, a transcriptional repressor of HIV LTR, and STAT2, a transcription factor critical to responsiveness to interferons, and IL-10 receptor α were induced in macrophages by E. coli. Similarly, S. aureus induced a proinflammatory lysophospholipase, HU-K5, but also down-regulated several cytoskeletal components and up-regulated a negative regulator of G-protein signaling. Thus, organism-specific macrophage gene expression changes were discernable.
Figure 2.

Differences in expression profiles distinguish between bacteria. (A) Differential gene expression in macrophages exposed to M. tuberculosis, E. coli, or S. aureus. The difference index represents how expression levels induced by the three bacteria differ from the average expression level induced by all bacteria studied: large values are assigned to genes whose expression levels exhibit the greatest differences in specific bacterial infections. Multiple time course experiments were used (M. tuberculosis, two repeats; E. coli, three repeats; and S. aureus, two repeats). For every gene within each profile, the responses of macrophages to each of the bacterial species in question were compared with the average response to all bacterial species studied. Statistically significant differences were identified by using Student's t test (P < 0.005). The difference index was calculated as follows: D.I. = log2 (fold-change of gene X in infection A) − log2 (avg fold-change of gene X in all infections) . (B) M. tuberculosis induced lower levels of macrophage IL-12 and IL-15 gene expression than the average expression measured across all data sets. The average fold-change values observed after exposure to M. tuberculosis (▴) are displayed for the time course. In comparison, the average fold-change values across all data sets was significantly greater (■).
Because of the impact of tuberculosis on world health, we focused additional experiments on macrophages exposed to M. tuberculosis. These experiments were designed to test the difference index and evaluate clues to pathogenesis. It was striking that the expression levels of genes encoding two proteins critical for host defense and adaptive immunity, IL-12 and IL-15, were differentially regulated. The induction of these genes was significantly lower after exposure to M. tuberculosis than other bacteria (Fig. 2B). Although IL-12 met the criteria for inclusion in the macrophage activation program (Table 1), the difference index disclosed substantial differences in the levels of IL-12 expression by macrophages exposed to M. tuberculosis and other bacteria. As predicted by the microarray data, supernatants from macrophages stimulated by M. tuberculosis contained less IL-12 p40 than macrophages exposed to E. coli (Fig. 3A). Macrophages exposed to M. tuberculosis also secreted less IL-12 p70 and IL-15 protein than macrophages cultured with E. coli (not shown).
Figure 3.

M. tuberculosis induced repression of IL-12 protein production. (A) M. tuberculosis induced less IL-12 protein than E. coli and suppressed IL-12 production induced by E. coli. IL-12 p40 accumulation in supernatants of macrophages 12 h after exposure to either M. tuberculosis, E. coli, or both bacteria was measured by ELISA (R & D Systems). Additional experiments demonstrated that this response was reproducible and not donor dependent. TNF-α ELISA was performed on supernatants from the same cultures after 4 h (peak expression of this cytokine preceding the wash step). Values are means ± SD of replicate ELISA measurements. Neither IL-12 nor TNF-α was detected in macrophages treated with media alone.
Because the lower levels of IL-12 in macrophages exposed to M. tuberculosis could be due to active repression of IL-12 production by M. tuberculosis, a coculture experiment was performed. Macrophages were exposed to M. tuberculosis, to E. coli, or to both simultaneously. Macrophages exposed to a mixture of M. tuberculosis and E. coli produced low levels of IL-12, comparable to macrophages exposed to M. tuberculosis alone and substantially less than macrophages exposed to E. coli alone (Fig. 3A). Although M. tuberculosis inhibited the production of IL-12 levels normally induced by E. coli, this inhibition did not extend to the production of TNF-α (Fig. 3B). These findings indicate that M. tuberculosis alters the macrophage activation program and dominates the stimulatory effects of E. coli exposure.
Discussion
Studying host–pathogen interactions by using a parallel, comparative analysis of gene expression permitted the identification of both shared and distinct gene expression responses in human macrophages. The shared macrophage activation program is robust and is induced by Gram-positive bacteria, Gram-negative bacteria, and mycobacteria. The proinflammatory component of the activation program may constitute a generic “alarm signal” that marshals antibacterial defenses. However, the majority of the activation program is comprised of cell surface proteins and signaling molecules engendering new functions in the macrophage, suggesting a maturation process similar to that observed with dendritic cells (9).
A subset of bacterial components is able to induce the activation program. These components are all agonists for TLRs: LPS for TLR4 (10, 11), lipoteichoic acid and muramyl dipeptide for TLR2 (12, 13), and hsps for TLR2 and TLR4 (14, 15). The ability of hsps to elicit this response is likely to account for their potency as adjuvants in preclinical (16) and clinical vaccine trials (17). In contrast, the other components tested are not known to activate TLRs. These findings suggest that the activation program is due to signaling mediated by macrophage TLRs.
Notably absent from the activation program were several categories of genes commonly associated with macrophage functions, such as genes involved in antigen presentation. However, we found that such genes are highly expressed in macrophages in the absence of bacterial stimulation. Comparison of gene expression profiles of unstimulated human macrophages to unstimulated human fibroblasts revealed that cathepsins, HLA-D genes, and others relevant to macrophage functions were preferentially expressed in the macrophages (Fig. 5, which is published as supporting information on the PNAS web site).
The parallel, comparative analysis of gene expression also revealed clues to M. tuberculosis pathogenesis. This organism induced little IL-12 and IL-15 relative to other bacteria, and repressed IL-12 production. Such a pathogen-specific response suggests that signaling pathways other than those mediated by TLR are active, leading to distinctive changes in gene expression. The poor induction of IL-12 by M. tuberculosis is consistent with observations of macrophage responses to M. tuberculosis and to recombinant Mycobacterium smegmatis transformed with the 19-kDa antigen of M. tuberculosis (18, 19). The effect of M. tuberculosis on macrophage IL-12 production appears similar to the inhibition of IL-12 production observed with Leishmania major and Histoplasma capsulatum, two other intracellular pathogens (20, 21). This finding may represent convergent evolution of organisms selected for their ability to survive within macrophages.
IL-12 plays a fundamental role in generating T helper 1 (Th1) immune responses (22) and is critical for host resistance to tuberculosis infection in mice and in humans (23–27). Repression of IL-12 production may enhance the survival of M. tuberculosis against the innate immune response or the developing adaptive immune response. This notion is supported by two observations. First, supplemental IL-12 enhances the ability of normal mice to clear a mycobacterial infection (24, 28). Second, exogenous IL-12 therapy has rescued two patients, one with a pulmonary Mycobacterium abscessus infection and one with disseminated M. tuberculosis infection, whose infections were refractory to antibiotics and supplemental IFN-γ (29, 30). Our findings support the idea that both IL-12 and IL-15 could be useful therapies for clinical tuberculosis, suggested by the animal models (24, 28, 31).
This study of host–pathogen interactions has provided insights into host defenses and pathogen-specific manipulations of those defenses that should have practical applications. Understanding the macrophage activation program, and the bacterial components that elicit it, will be useful in designing vaccines and cytokine therapies that engage the innate immune system in a targeted fashion. The expression data described here should provide a foundation for further studying the pathogenesis of these and other infectious agents such as fungi, viruses, and parasites.
Supplementary Material
Acknowledgments
We thank John Wyrick for help with array procedures and data analysis and John Barnett for database management and support. We also thank Lee Mizzen and StressGen Biotechnologies for their donation of recombinant heat shock proteins and Christine Ladd for technical assistance. Virulent M. tuberculosis Erdman strain was provided by the Tuberculosis Research Materials and Testing Contract, National Institutes of Health (NIH), National Institute of Allergy and Infectious Diseases, NO1 AI-753230 at Colorado State University. Other bacteria were kind gifts of Dr. David Hooper and Dr. Dilek Ince (S. aureus), Dr. Stephen Calderwood (EHEC), and Dr. Elizabeth Hohmann (Salmonellae) of Massachusetts General Hospital, and Dr. Douglas Drevets of the University of Oklahoma Health Sciences Center (L. monocytogenes EGD). We thank Dr. Douglas Golenbock of University of Massachusetts Medical School, and Dr. Nilofer Qureshi of University of Missouri-Kansas City School of Medicine, for providing Rhodobacter sphaeroides lipid A. This work was supported by funds from NIH; Corning, Inc.; Affymetrix, Inc.; Millennium Pharmaceuticals, Inc.; and Bristol-Myers Squibb Company.
Abbreviations
- TLR
Toll-like receptor
- MOI
multiplicity of infection
- EHEC
enterohemorrhagic E. coli O157:H7
- LPS
lipopolysaccharide
- hsp
heat shock protein
References
- 1.Knodler L A, Celli J, Finlay B B. Nat Rev Mol Cell Biol. 2001;2:578–588. doi: 10.1038/35085062. [DOI] [PubMed] [Google Scholar]
- 2.Fortunato E A, McElroy A K, Sanchez I, Spector D H. Trends Microbiol. 2000;8:111–119. doi: 10.1016/s0966-842x(00)01699-1. [DOI] [PubMed] [Google Scholar]
- 3.Gordon S. In: Fundamental Immunology. Paul W, editor. New York: Lippincott-Raven; 1999. pp. 533–545. [Google Scholar]
- 4.Pieters J. Curr Opin Immunol. 2001;13:37–44. doi: 10.1016/s0952-7915(00)00179-5. [DOI] [PubMed] [Google Scholar]
- 5.Akira S, Takeda K, Kaisho T. Nat Immunol. 2001;2:675–680. doi: 10.1038/90609. [DOI] [PubMed] [Google Scholar]
- 6.Nau G J, Guilfoile P, Chupp G L, Berman J S, Kim S J, Kornfeld H, Young R A. Proc Natl Acad Sci USA. 1997;94:6414–6419. doi: 10.1073/pnas.94.12.6414. [DOI] [PMC free article] [PubMed] [Google Scholar]
- 7.Lockhart D J, Dong H, Byrne M C, Follettie M T, Gallo M V, Chee M S, Mittmann M, Wang C, Kobayashi M, Horton H, Brown E L. Nat Biotechnol. 1996;14:1675–1680. doi: 10.1038/nbt1296-1675. [DOI] [PubMed] [Google Scholar]
- 8.Eisen M B, Spellman P T, Brown P O, Botstein D. Proc Natl Acad Sci USA. 1998;95:14863–14868. doi: 10.1073/pnas.95.25.14863. [DOI] [PMC free article] [PubMed] [Google Scholar]
- 9.Hamerman J A, Aderem A. J Immunol. 2001;167:2227–2233. doi: 10.4049/jimmunol.167.4.2227. [DOI] [PubMed] [Google Scholar]
- 10.Poltorak A, He X, Smirnova I, Liu M Y, Huffel C V, Du X, Birdwell D, Alejos E, Silva M, Galanos C, Freudenberg M, Ricciardi-Castagnoli P, Layton B, Beutler B. Science. 1998;282:2085–2088. doi: 10.1126/science.282.5396.2085. [DOI] [PubMed] [Google Scholar]
- 11.Chow J C, Young D W, Golenbock D T, Christ W J, Gusovsky F. J Biol Chem. 1999;274:10689–10692. doi: 10.1074/jbc.274.16.10689. [DOI] [PubMed] [Google Scholar]
- 12.Schwandner R, Dziarski R, Wesche H, Rothe M, Kirschning C J. J Biol Chem. 1999;274:17406–17409. doi: 10.1074/jbc.274.25.17406. [DOI] [PubMed] [Google Scholar]
- 13.Yoshimura A, Lien E, Ingalls R R, Tuomanen E, Dziarski R, Golenbock D. J Immunol. 1999;163:1–5. [PubMed] [Google Scholar]
- 14.Vabulas R M, Ahmad-Nejad P, da Costa C, Miethke T, Kirschning C J, Hacker H, Wagner H. J Biol Chem. 2001;276:31332–31339. doi: 10.1074/jbc.M103217200. [DOI] [PubMed] [Google Scholar]
- 15.Ohashi K, Burkart V, Flohe S, Kolb H. J Immunol. 2000;164:558–561. doi: 10.4049/jimmunol.164.2.558. [DOI] [PubMed] [Google Scholar]
- 16.Chu N R, Wu H B, Wu T C, Boux L J, Mizzen L A, Siegel M I. Cell Stress Chaperones. 2000;5:401–405. doi: 10.1379/1466-1268(2000)005<0401:ioahpt>2.0.co;2. [DOI] [PMC free article] [PubMed] [Google Scholar]
- 17.Goldstone, S. E., Palefsky, J. M., Winnett, M. T. & Neefe, J. R. (2002) Dis. Colon Rectum, in press. [DOI] [PubMed]
- 18.Giacomini E, Iona E, Ferroni L, Miettinen M, Fattorini L, Orefici G, Julkunen I, Coccia E M. J Immunol. 2001;166:7033–7041. doi: 10.4049/jimmunol.166.12.7033. [DOI] [PubMed] [Google Scholar]
- 19.Post F A, Manca C, Neyrolles O, Ryffel B, Young D B, Kaplan G. Infect Immun. 2001;69:1433–1439. doi: 10.1128/IAI.69.3.1433-1439.2001. [DOI] [PMC free article] [PubMed] [Google Scholar]
- 20.Carrera L, Gazzinelli R T, Badolato R, Hieny S, Muller W, Kuhn R, Sacks D L. J Exp Med. 1996;183:515–526. doi: 10.1084/jem.183.2.515. [DOI] [PMC free article] [PubMed] [Google Scholar]
- 21.Marth T, Kelsall B L. J Exp Med. 1997;185:1987–1995. doi: 10.1084/jem.185.11.1987. [DOI] [PMC free article] [PubMed] [Google Scholar]
- 22.Magram J, Connaughton S E, Warrier R R, Carvajal D M, Wu C Y, Ferrante J, Stewart C, Sarmiento U, Faherty D A, Gately M K. Immunity. 1996;4:471–481. doi: 10.1016/s1074-7613(00)80413-6. [DOI] [PubMed] [Google Scholar]
- 23.Cooper A M, Magram J, Ferrante J, Orme I M. J Exp Med. 1997;186:39–45. doi: 10.1084/jem.186.1.39. [DOI] [PMC free article] [PubMed] [Google Scholar]
- 24.Flynn J L, Goldstein M M, Triebold K J, Sypek J, Wolf S, Bloom B R. J Immunol. 1995;155:2515–2524. [PubMed] [Google Scholar]
- 25.Altare F, Durandy A, Lammas D, Emile J F, Lamhamedi S, Le Deist F, Drysdale P, Jouanguy E, Doffinger R, Bernaudin F, et al. Science. 1998;280:1432–1435. doi: 10.1126/science.280.5368.1432. [DOI] [PubMed] [Google Scholar]
- 26.de Jong R, Altare F, Haagen I A, Elferink D G, Boer T, van Breda Vriesman P J, Kabel P J, Draaisma J M, van Dissel J T, Kroon F P, et al. Science. 1998;280:1435–1438. doi: 10.1126/science.280.5368.1435. [DOI] [PubMed] [Google Scholar]
- 27.Altare F, Lammas D, Revy P, Jouanguy E, Doffinger R, Lamhamedi S, Drysdale P, Scheel-Toellner D, Girdlestone J, Darbyshire P, et al. J Clin Invest. 1998;102:2035–2040. doi: 10.1172/JCI4950. [DOI] [PMC free article] [PubMed] [Google Scholar]
- 28.Doherty T M, Sher A. J Immunol. 1998;160:5428–5435. [PubMed] [Google Scholar]
- 29.Holland S M. Adv Intern Med. 2000;45:431–452. [PubMed] [Google Scholar]
- 30.Greinert U, Ernst M, Schlaak M, Entzian P. Eur Respir J. 2001;17:1049–1051. doi: 10.1183/09031936.01.17510490. [DOI] [PubMed] [Google Scholar]
- 31.Maeurer M J, Trinder P, Hommel G, Walter W, Freitag K, Atkins D, Storkel S. Infect Immun. 2000;68:2962–2970. doi: 10.1128/iai.68.5.2962-2970.2000. [DOI] [PMC free article] [PubMed] [Google Scholar]
- 32.Lien E, Means T K, Heine H, Yoshimura A, Kusumoto S, Fukase K, Fenton M J, Oikawa M, Qureshi N, Monks B, et al. J Clin Invest. 2000;105:497–504. doi: 10.1172/JCI8541. [DOI] [PMC free article] [PubMed] [Google Scholar]
Associated Data
This section collects any data citations, data availability statements, or supplementary materials included in this article.