Abstract
The annual advance and retreat of sea ice has been considered a major physical determinant of spatial and temporal changes in the structure of the Antarctic coastal marine ecosystem. However, the role of glacial meltwater on the hydrography of the Antarctic Peninsula ecosystem has been largely ignored, and the resulting biological effects have only been considered within a few kilometers from shore. Through several lines of evidence collected in conjunction with the Palmer Station Long-Term Ecological Research Project, we show that the freshening and warming of the coastal surface water over the summer months is influenced not solely by sea ice melt, as suggested by the literature, but largely by the influx of glacial meltwater. Moreover, the seasonal variability in the amount and extent of the glacial meltwater plume plays a critical role in the functioning of the biota by influencing the physical dynamics of the water (e.g., water column stratification, nearshore turbidity). From nearly a decade of observations (1991–1999), the presence of surface meltwater is correlated not only to phytoplankton blooms nearshore, but spatially over 100 km offshore. The amount of meltwater will also have important secondary effects on the ecosystem by influencing the timing of sea ice formation. Because air temperatures are statistically increasing along the Antarctic Peninsula region, the presence of glacial meltwater is likely to become more prevalent in these surface waters and continue to play an ever-increasing role in driving this fragile ecosystem.
Along the continental margins of Antarctica, melting of glacial ice and snow contributes freshwater to the surface waters each year. The amount of meltwater released seasonally into the water column and the areal extent of coastal waters impacted by meltwater are not well characterized. In the Antarctic Peninsula region, meltwater conditions are likely to become more prevalent in surface waters because of the warming trend in the area. Instrument records over the last half-century indicate a statistically significant warming trend in air temperature along the Antarctic Peninsula (1–4). Moreover, the latest evidence indicates that vast ice sheets in the Antarctic Peninsula may be on the verge of collapse (5). Melting surface water, which can build up on the ice shelf in just a few warm summers, seeps into cracks and forces quicker-than-expected ice-shelf retreat.
A surface lens of meltwater can significantly influence the marine ecosystem from phytoplankton at the base of the food chain to sea ice dynamics. Past research has shown that the presence of low-salinity meltwater can be linked to an increase in phytoplankton blooms in nearshore waters (6–8). Moreover, the presence of meltwater can also influence the phytoplankton composition of the water column and, thereby, the entire food web. Along the Antarctic Peninsula region, decreased salinity has been associated with a transition from a diatom-dominated system to one dominated by smaller cryptophytes (8). Such a change could, in turn, influence the abundance of zooplankton populations (i.e., krill versus salps) (8). However, the source of the low-salinity waters (e.g., glacial versus sea ice) have not been well characterized, and the influence of glacial meltwater on the physical and biological oceanography of the larger continental shelf region is not documented. Current literature describing the hydrography and circulation of water along the Antarctic Peninsula ignores the influence of glacial meltwater on the development of water masses (9, 10).
The physical and biological dynamics of glacial meltwater are complex. First, the meltwater can release particles that have been concentrated within the ice and can cause the nearshore waters to become more turbid. Turbidity affects light penetration and can influence the primary production within the water column. Turbidity, however, may impact phytoplankton from the Antarctic region less than from temperate waters. Antarctic phytoplankton must acclimate to rapid variations in light caused by frequent high winds and deep mixing, shading by pack ice, and extreme variable day-length over the course of a season. As a result, phytoplankton from this polar region tend to be adapted to low-light conditions and can operate at their maximal photosynthetic capability at light levels corresponding to only a small percent of incoming irradiance (11).
In addition to the input of suspended particles, meltwater can effect the nutrient dynamics in the water column. Although the pools of most macronutrients (phosphate, nitrate, and silicate) in Antarctic waters are generally far in excess of phytoplankton needs, macronutrient depletion has been reported in nearshore Antarctic waters after massive coastal blooming (12). Meltwater may provide a replenishment of macronutrients in the later summer and early fall when the nutrient pool may be diminished from earlier blooms. Additionally, concentrations of micronutrients, such as iron, manganese, and copper, may limit maximal production in pelagic regions of the Southern Ocean (13, 14). The primary input of iron to offshore waters is from atmospheric dust blown onto the surface. Meltwater may be enriched in iron and other trace elements because of glacial scouring of underlying rock surfaces and accumulation from atmospheric deposition. Although trace metals were not monitored directly, the chemical content and composition of glacial meltwater ponds along the McMurdo Ice Shelf showed a wide range of solute concentrations depending on terrain type, with some meltwater having substantial enrichments of solutes (15). If iron were similarly concentrated within the meltwater, dispersion of meltwater offshore could provide a mechanism for transporting essential trace micronutrients to offshore waters.
Because meltwater is less dense than the underlying water column, the meltwater will not readily mix with the underlying dense water and, without wind forcing, creates a stable surface layer. Within this stable layer, water temperatures can warm because of solar heating and serve to further increase the stability of the surface layer. The stable layer also permits phytoplankton to remain within a favorable light environment and prevents mixing to depths where light is limiting. Research in this region has shown that water column stability and a shallow mixed layer are essential to phytoplankton bloom development (16).
Finally, the input of meltwater can have a significant influence on the formation of sea ice in this region. In fresher water, the freezing point of water is higher and less energy is required to produce sea ice. Additionally, the amount of stratification in the upper water column also significantly influences the heating and cooling rates of the sea surface. Both the salinity and cooling rate of the surface layer will influence the onset of sea ice formation, which has important implications from oceanographic, climatological, and biological perspectives. Sea ice is an important component of the ocean–atmosphere heat flux and critical to the formation of Antarctic bottom water (17). The annual advance and retreat of sea ice is also a major physical determinant of spatial and temporal changes in the structure and function of the Antarctic marine ecosystem, from total annual primary production to krill recruitment and breeding success in seabirds (18).
Here, we analyze nearly a decade (1991–1999) of observations collected spatially on- to offshore along the Antarctic Peninsula and temporally over the course of the growing season to evaluate the salinity, temperature, optics, and biology associated with meltwater events. This dynamic ecosystem is characterized by extreme interannual ecological variability (e.g., 7-fold interannual variability in primary production; ref. 19). We demonstrate that meltwater conditions also display large interannual variability and hypothesize that meltwater plays a critical role in the biological dynamics of the water column.
Methods
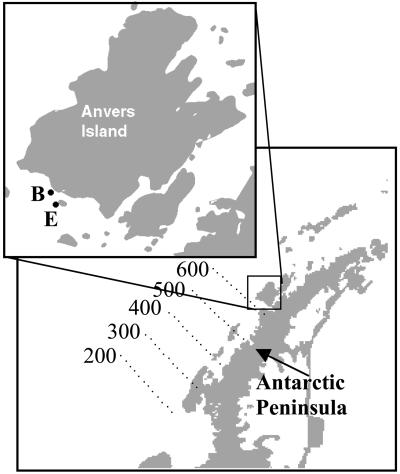
The field data presented in this paper were collected in collaboration with the Palmer Long-Term Ecological Research (Pal-LTER) project (18). The sampling regime involves an approximately weekly time series over the growing season (roughly November–March depending on sea ice conditions) for two stations near the inlet to Palmer Station: stations B (64.780 S, 64.075 W) and station E (64.815 S, 64.041 W). These nearshore stations are susceptible to meltwater and runoff from glaciers on Anvers Island and other small islands in the vicinity. In addition, annual cruises covering a larger spatial grid were conducted in January of each year (Fig. 1). For each station, concurrent measurements of salinity, temperature, irradiance, and chlorophyll were conducted. Data shown here were collected from 1991 through 1999.
Figure 1.
Location of the Pal-LTER sampling grid (lines 200–600) and the Palmer nearshore stations (B and E) in relation to the Antarctic Peninsula.
Phytoplankton biomass was estimated as total chlorophyll-a concentration (Chl) by using standard fluorometric techniques (20). Conductivity-temperature-depth measurements were made at each station by using a SeaBird system (21). Vertical profiles of downwelling spectral irradiance and upwelling radiance were measured by using a Biospherical Instruments (San Diego) Profiling Reflectance radiometer operated in a free-fall configuration. Radiance reflectance just above the sea surface is estimated as the ratio of upwelling radiance to downwelling irradiance (22). The turbidity of the water indicates the extent to which liquids lack clarity and can be related to the amount of inorganic nonpigmented particulates from glacial erosion. Because the nearshore waters have relatively high levels of phytoplankton, they absorb heavily in the blue region of the spectrum. Because of relatively low backscattering of these waters, the reflectance in the green tends to be lower than for other waters per unit of Chl (22). Therefore, we call waters “turbid” when they significantly scatter more light in the green wavelength than is typically found for these waters (i.e., radiance reflectance at 555 nm is greater than 2 SDs from the mean measured for all stations or 0.0039 sr−1).
Results
Meltwater Nearshore Over the Growing Season.
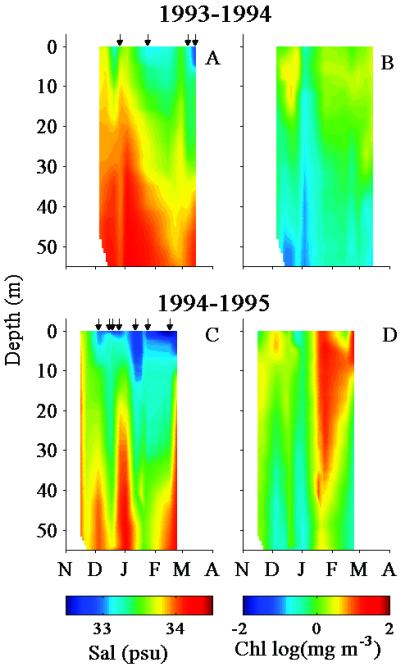
Contours showing the vertical distributions of salinity and Chl at station B are presented for a relatively low biomass season (1993–1994) and a high biomass season (1994–1995) (Fig. 2). Layers of meltwater, varying from a few meters mixed down to 40 m, can be found sporadically in the surface waters from November to March. The quantity and timing of meltwater pulses vary markedly from season to season. For some seasons, the nearshore waters contain a nearly continuous low-salinity layer on the surface waters (Fig. 2C). Other seasons are characterized by only a few pulsed meltwater episodes (Fig. 2A). In 1993–1994 (Fig. 2 A and B), for example, surface salinity inversely correlates with biomass concentrations (r2 = 0.54). In the 1994–1995 season (Fig. 2 C and D), a time lag is evident between meltwater influx and biomass accumulation. On January 12, 1995, salinity dropped down to 32.8 practical salinity units (psu), and surface Chl measured 2.6 mg⋅m−3. One week later, salinity was 32.9, but Chl had increased to 12.8 mg⋅m−3. For all of the time series data, over 70% of large blooms (Chl > 5 mg⋅m−3) occur when surface salinity is less than 33.2.
Figure 2.
Time series (November–March) of the vertical profiles of salinity and Chl at station B from two example seasons: a relatively low biomass season (1993–1994) (A and B); and a high-biomass season (1994–1995) (C and D). The left column is salinity and the right column is Chl. Small arrows on the top of the salinity panels denote the stations that were considered turbid because of high radiance reflectance.
The small arrows in Fig. 2 A and C correspond to the sampling dates when the waters were considered turbid. The turbid waters at station B also coincide with the presence of meltwater. Approximately 70% of the highly turbid stations have surface salinity less than 33.2 and 97% have salinity less than 33.5. From the 8 years of near-weekly sampling, station B is considered turbid on average 40% of the growing season (November–March). In contrast, station E, located 3.7 km offshore, is turbid less than 3% of the growing season.
The temperature profiles (data not shown) are much more uniform with depth than the salinity contours and are more conserved from year to year. Cold (−1°C) winter water is found in November and December of each season. This water warms over the course of the season and is typically greater than the 1°C by midsummer. Temperatures generally remain above 1°C from January through March. Interspersed within this general framework, seasonal variations in surface temperature are evident. The surface waters tend to warm in the presence of a stable meltwater surface layer.
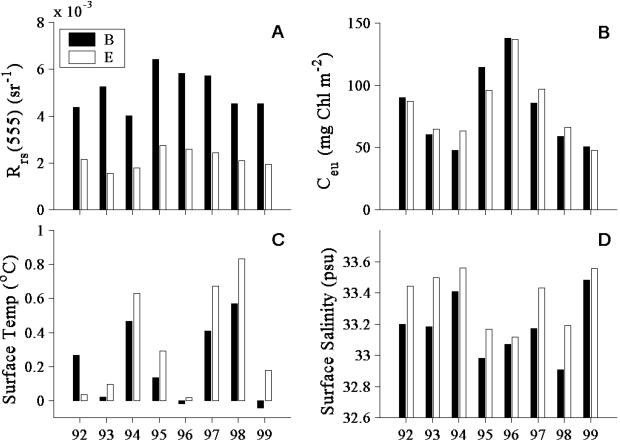
The seasonal median radiance reflectance, Chl, salinity, and temperature for each year are presented in Fig. 3 for both stations B and E. The waters of station B have high radiance reflectance and are much more turbid than the further offshore waters of station E. In contrast, the mean water-column-integrated Chl is similar between the two stations. Consistent with a plume of freshwater moving offshore, station E is more saline and slightly warmer than station E. Although stations B and E exhibit large differences in turbidity, the seasonal patterns of salinity, temperature, and Chl are conserved between these stations.
Figure 3.
Bar graphs comparing the seasonal mean values (November–March) of four parameters determined in surface waters at stations B (inlet to Arthur Harbor) and E (3.7 km offshore) from 1991–1992 through 1998–1999. (A) Radiance reflectance. (B) Water-column integrated Chl. (C) Temperature. (D) Salinity.
Large interannual variability is observed between all four parameters in Fig. 3. Mean seasonal Chl integrated over the euphotic zone, Ceu, varies from around 40 to over 140 mg⋅m−3. The highest Chl occurred during the 1994–1995 and 1995–1996 seasons. Comparing Fig. 3 B and D, mean seasonal Chl and salinity are inversely correlated (r2 = 0.26, P < 0.05), with high-biomass seasons having low surface salinity.
Macronutrient concentrations are also evaluated for stations B and E. Nutrient concentrations are generally high and considered to be nonlimiting in this area. We categorized the data into subclasses to compare nutrient concentrations. Stations were first divided into those with meltwater less than 33.2 and those with meltwater greater than 33.2. Stations were further subdivided by Chl concentration (>3 and <3 mg⋅m−3). Although some nutrient drawdown occurs under high-biomass conditions, no significant differences in surface nitrate, ammonium, phosphate, or silicate concentrations were observed between these four categories.
Meltwater Interactions Onshore to Offshore.
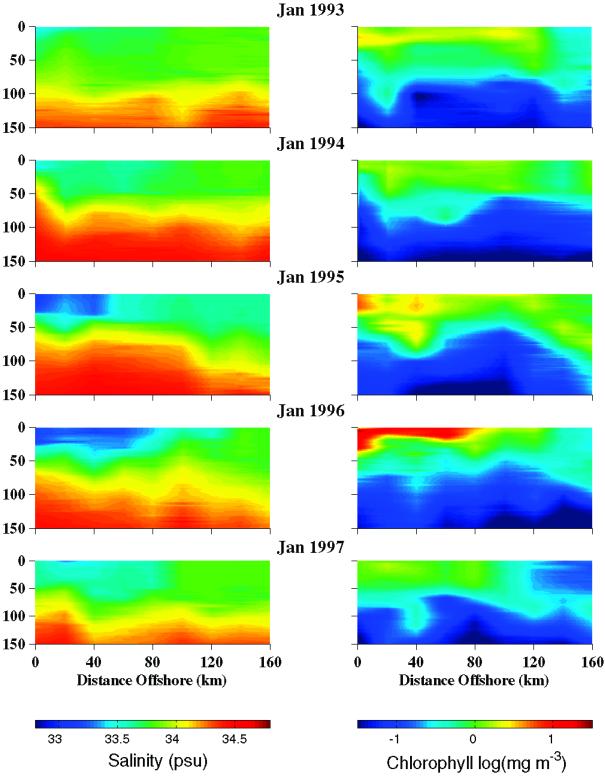
Vertical contours of salinity (Fig. 4 Left) and Chl (Fig. 4 Right) are presented for a transect extending from shore out to 160 km. These example profiles were obtained along the 600 line (Fig. 1A) from five summer cruises (January 1993–1997). Lower salinity is associated with waters close to shore, and salinity gradually increases with distance from shore. Highly stratified meltwater layers extending nearly 100 km offshore are observed in 1995 and 1996. This observation also coincides with the on- to offshore gradient in biomass. The low-salinity surface water is generally mixed between 50 and 80 m within 100 km offshore. The two years with the most intense stratification (1995 and 1996) also had the highest biomass. A very large bloom is evident in the January 1996 data that extends 100 km offshore and is associated with the presence of an extensive freshwater lens extending from shore.
Figure 4.
Depth contours of salinity and chlorophyll along an onshore to offshore transect (600 line) from five sample seasons (1993–1997).
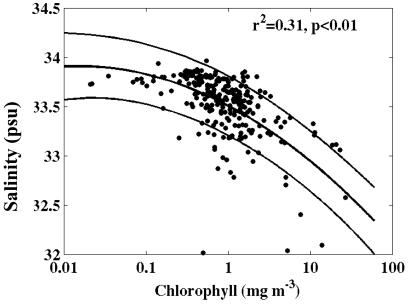
The relationship between surface salinity and Chl for all of the grid stations sampled on- and offshore from January 1993 through 1999 is presented in Fig. 5. Although the relationship is significant (P < 0.01), it explains only 31% of the variability in the data. However, all of the stations with Chl less than 0.2 mg⋅m−3 are associated with higher-salinity waters (>33.5) and all of the Chl greater than 3 mg⋅m−3 are associated with lower-salinity surface waters (<33.4). A t test revealed that Chl was significantly higher in the low-salinity waters (P < 0.01).
Figure 5.
Regression of surface chlorophyll versus salinity for all stations from 9 years of January Pal-LTER cruises (1991–1999) [r2 = 0.31; P < 0.01; y = −0.12x2 − 0.44x + 33.5, x = log(Chl)].
Discussion
A conceptual model for the meltwater input into the system is described below. With solar heating, the snow and ice melts from the glaciers and land surfaces. Being less saline, the runoff enters the water column and creates a lens of fresher water on the sea surface. In the shallow nearshore waters, the resulting lens can be mixed from just a few meters down to 50 m in the water column. The nearshore stations exhibit pulses of freshwater input that occur throughout the growing season (Fig. 2). The salinity of the meltwater lens on the sea surface can be as low as 30.5, but averages around 33.2. Meltwater is more common in the late summer to early fall (January–March).
Under meltwater conditions, the initial radiance reflectance typically increases as more of the light is scattered upward by particles released into the water column. This increased turbidity is likely caused by the presence of highly scattering minerogenic particles that make the waters optically distinct from typical conditions. By station E, 3.7 km offshore, radiance reflectance is half of that at station B (Fig. 3A). Hence, meltwater particles sink out rapidly and are not carried away from shore.
The increased water turbidity, however, appears to have little impact on Chl. Although stations B and E have dramatically different optical properties, they have strikingly similar vertical distributions of Chl throughout the growing seasons (Fig. 3B). Phytoplankton in this region are generally considered to be shade-adapted and do not require very high levels of light to achieve their maximum photosynthetic levels (11). As a result, we hypothesize that the increased turbidity observed at station B does not significantly alter the levels of biomass and primary production from what is observed further offshore in the nonturbid waters of station E.
Meltwater has a significant impact on the biomass in the water column both temporally and spatially over 100 km offshore. From the 8 years of analysis, surface salinity along the Antarctic Peninsula is inversely correlated to phytoplankton biomass (Fig. 5). The two seasons with the highest annual Chl at Palmer Station also had extensive low-salinity surface waters over nearly the entire growing season (Figs. 3 and 4). The relationship between salinity and biomass is nonlinear, and the correlation is not tight because of the time lag inherent between the influx of meltwater and the phytoplankton response. Because of the low water temperature, maximum phytoplankton growth rates in situ are usually <0.3 per day. If the phytoplankton are responding to the formation of a stable surface layer created by the meltwater, as discussed further below, then the phytoplankton will be correlated to the presence of the stable surface layer whether absolute salinity is decreased slightly or substantially.
An important mechanism linking meltwater and biomass involves stratification of the water column and the creation of a stable surface layer. Phytoplankton within the stable surface layer remain in a favorable light regime. Proximity to stabilizing meltwater and protection from intense storms activity is essential for the development of persistent massive blooms in this region (6). For the largest blooms (i.e., 1994–1995 and 1995–1996), the water column is highly stratified and the freshwater lens is consistently mixed to less than 50 m (Fig. 4), whereas the freshwater layer for the other seasons (January 1993, 1994, and 1997) is mixed over 80–100 m. The depth at which irradiance corresponds to 1% of the incident irradiance, also referred to as the euphotic depth, is on average 47.3 m ± 14 m for stations B and E. Therefore, the phytoplankton from 1993–1995 are mixed within the euphotic zone and would have irradiance levels consistent with optimal photosynthesis. Research has suggested that the critical depth, or the depth at which net growth equals net respiration (23), ranges from 50 to 80 m (24, 25). Our results demonstrate that meltwater creates a stable mixed layer extending offshore that is less than these critical-depth estimates and allows bloom formation.
Meltwater does not appear to be affecting levels of macronutrients required for photosynthesis. In general, nitrate, ammonium, phosphate, and silicate concentrations were well above limiting concentrations and did not appear to be correlated with pulses of meltwater. Although some drawdown of nutrients was evident under high-biomass conditions, nutrient concentrations remained high both nearshore and offshore. If meltwater contained elevated levels of a limiting nutrient, such as iron (not measured here), then this could serve to further enhance the potential for bloom development in offshore regions that may be limited by iron (14, 26).
Along the continental shelf west of the Antarctic Peninsula, waters above 100–150 m are composed of Antarctic surface water and its end member winter water (9, 10). This water mass displays a broad range of characteristics because it is affected by atmospheric exchange, ice formation and melting, and exchange across the permanent pycnocline. Temperatures typically vary from −1.8 to 1.0°C and salinity from 33.0 to 33.7. During the winter, the Antarctic surface water is referred to as winter water and is well mixed to 100 m having low temperatures (−1.5°C) and high salinity of 33.8–34.0. As the spring and summer progresses, the surface water mass freshens and is warmed by solar heating. In the fall, surface warming decreases and storm intensities increase, leading to a breakdown of the stable mixed layer and the development of a thick layer of cold winter water.
Although the literature predominantly suggests that the freshening of Antarctic surface water is a result of melting sea ice (10), our data suggest that meltwater from continental glaciers and ice shelves also significantly impacts surface waters west of the Antarctic Peninsula. First, because winter sea ice extends several hundred kilometers off the shores of the Antarctic Peninsula, melting of this expansive layer of sea ice should affect nearshore and offshore regions equally. Because sea ice melts offshore first, we might also expect the pool of freshwater to be moving offshore to onshore as the sea ice melts. However, our results demonstrate a gradient of surface salinity with fresher waters nearshore and more saline waters offshore (Fig. 4). In addition, our nearshore time series of salinity (Fig. 2) demonstrates the pulsed input of freshwater into the water column throughout the growing season, even in March, when sea ice is effectively gone from the area. As determined from satellite imagery, sea ice melts rapidly along the Antarctic Peninsula region from November to December and is generally gone by January (19, 27). The freshwater pulses occurring at the inlet to Arthur Harbor are also associated with increased turbidity. Consistent with a pool of freshwater diffusing away from shore, the waters at station B, closest to the glacier at Palmer Station, are fresher than waters at station E, several kilometers from nearshore (Fig. 3D).
In addition, the salinity in nearshore waters (e.g., mean of 33.2) is lower than the salinity typically associated with melting of sea ice along the marginal ice zone (e.g., 33.8 to 34.0; refs. 25 and 28). We can conduct a simple mass balance calculation of the surface salinity that would result from melting of a typical layer of sea ice. For the Western Antarctic Peninsula region, the sea ice thickness varies from 0.5 to 1 m, the salinity from 3 to 15 psu, and the resulting bulk sea ice density ranges from 0.6 to 0.9 g/cm3 depending on the amount of voids within the ice and the amount of unconsolidated snow (29, 30). If we assume an initial water column salinity of 34, water temperature of 0°C, and a mixing within the top 50 m of water (Fig. 5), melting a 1-m-thick layer of sea ice (6 psu, 0.8 g⋅cm−3) would reduce the surface salinity from 34 to ≈33.5 psu. However, the surface salinity reported for the nearshore waters along the Antarctic Peninsula is generally less than 33.2. For example, along the 600 line in 1995 (Fig. 4), surface salinity was 32.8 nearshore, increased to 33.3 at 100 km offshore, and then increased above 33.5 greater than 120 km offshore. For these reasons, we hypothesize that the fresher surface waters observed during summer and fall along the Antarctic Peninsula are largely associated with runoff from land-based glaciers and snow pack. However, further measurements (e.g., isotopic analysis) may provide more direct evidence as to the origins of the meltwater.
If the air temperatures in Antarctic Peninsula continue to warm (1), the potential for large-scale melting of glaciers and snow pack would increase. An increase in meltwater could result in an increase in biomass in coastal waters and a shift in phytoplankton species (8). Increased nearshore biomass and primary production associated with meltwater would result in increased incorporation of CO2 into organic matter through photosynthesis. If the relationship between biomass and glacial meltwater is consistent, this finding could represent a negative feedback for global warming. However, the Southern Ocean's role in moderating enhance CO2 is both complex, uncertain, and dependent on the response of the biological and solubility pumps controlling CO2 concentrations in surface waters (31). Other mechanisms, such as the infiltration of different water masses, formation and retreat of sea ice, and frequency of storm events, must also be considered in conjunction with these results. Further research is necessary to fully understand the timing, duration, and spatial extent to which meltwater influences the water column. Moreover, more frequent sampling (e.g., from a mooring) would help to better define the time course of the phytoplankton response to the influx of meltwater.
Acknowledgments
We gratefully acknowledge the many people who helped acquire the Pal-LTER dataset over the years. In particular, K. Baker provided data management support and D. Menzies carried out instrument repair and optical calibration. In addition, we acknowledge S. Stammerjohn, J. Ukita, R. Zimmerman, G. J. Smith, and the two anonymous reviewers for their helpful comments on the manuscript. This research was supported by National Aeronautics and Space Administration Training Grants NGT-30063 (Earth System Science Fellowship) and NGT-40005 (California Space Institute) (to H.D.), and National Science Foundation Grant OPP90–11927 and National Aeronautics and Space Administration Grant NAGW 290–3 (to R.C.S.).
Abbreviations
- Chl
chlorophyll-a concentration
- Pal-LTER
Palmer Long-Term Ecological Research
- psu
practical salinity units
Footnotes
This paper was submitted directly (Track II) to the PNAS office.
References
- 1.King J C. Int J Climatol. 1994;14:357–369. [Google Scholar]
- 2.Stark P. Weather. 1994;49:215–220. [Google Scholar]
- 3.Smith R C, Stammerjohn S E, Baker K S. In: Foundations for Ecosystem Research West of the Antarctic Peninsula, Antarctic Research Series. Ross R M, Hofmann E E, Quetin L B, editors. Vol. 70. Washington, DC: American Geophysical Union; 1996. pp. 105–121. [Google Scholar]
- 4.Smith R C, Stammerjohn S E. Annals Glaciol. 2001;33:493–500. [Google Scholar]
- 5.Scambos T A, Hulbe C, Fahnestock M, Bohlander J. J Glaciol. 2000;46:516–530. [Google Scholar]
- 6.Mitchell B G, Holm-Hansen O. Deep-Sea Res. 1991;38:961–1007. [Google Scholar]
- 7.Moline M, Prezelin B B. Mar Ecol Progr Ser. 1996;145:143–160. [Google Scholar]
- 8.Moline M A, Claustre H, Frazer T K, Grzymski J, Schofield O, Vernet M. In: Antarctic Ecosystems: Models for Wider Ecological Understanding. Davison E, Howard-Williams C, Broady P, editors. Christchurch, New Zealand: New Zealand Natural Sciences, Canterbury University; 2000. [Google Scholar]
- 9.Smith D A, Hofmann E E, Klinck J M, Lascara C M. Deep-Sea Res I. 1999;46:925–949. [Google Scholar]
- 10.Klinck J M. J Geophys Res. 1998;103:7617–7636. [Google Scholar]
- 11.Dierssen H M, Smith R C, Vernet M. Ant Sci. 2000;12:20–32. [Google Scholar]
- 12.Holm-Hansen O, Amos A F, Silva N S, Villafane V, Helbling E W. Ant Sci. 1994;6:315–324. [Google Scholar]
- 13.Hart T J. Discov Rep. 1934;8:1–268. [Google Scholar]
- 14.Martin J H, Gorden R M, Fitzwater S E. Nature (London) 1990;345:156–158. [Google Scholar]
- 15.de Mora S J, Whitehead R F, Gregory M. Ant Sci. 1994;6:17–27. [Google Scholar]
- 16.Mitchell B G, Holm-Hansen O. Deep-Sea Res. 1991;38:1009–1028. [Google Scholar]
- 17.Gloerson P, Campbell W J, Cavaliere D J, Comiso J C, Parkinson C L, Zwally H J. Arctic and Antarctic Sea Ice, 1978–1987: Satellite Passive-Microwave Observations and Analysis. Washington, DC: Scientific and Technical Information Program. National Aeronautics and Space Administration; 1992. [Google Scholar]
- 18.Smith R C, Baker K S, Fraser W R, Hofmann E E, Karl D M, Klinck J M, Quetin L B, Prezelin B B, Ross R M, Trivelpiece W Z, Vernet M. Oceanography. 1995;8:77–86. [Google Scholar]
- 19.Smith R C, Baker K, Dierssen H M, Stammerjohn S E, Vernet M. Am Zool. 2001;41:40–56. [Google Scholar]
- 20.Smith R C, Baker K S, Dustan P. Fluorometer Techniques for Measurement of Oceanic Chlorophyll in the Support of Remote Sensing Report 81-17. La Jolla: Visibility Laboratory, Scripps Institution of Oceanography (SIO), Univ. of Calif. at San Diego; 1981. [Google Scholar]
- 21.Smith R C, Menzies D W, Booth C R. In: Ocean Optics XIII. Ackleson S G, Frouin R, editors. Halifax, Nova Scotia, Canada: International Society for Optical Engineering; 1997. pp. 777–786. [Google Scholar]
- 22.Dierssen H, Smith R C. J Geophys Res. 2000;105:26301–26312. [Google Scholar]
- 23.Sverdrup H U. J Cons Int Explor Mer. 1953;18:287–295. [Google Scholar]
- 24.Nelson D M, Smith W O. Limnol Oceanogr. 1991;36:1650–1661. [Google Scholar]
- 25.Boyd P W, Robinson C, Savidge G, Williams P J leB. Deep-Sea Res II. 1995;42:1177–1200. [Google Scholar]
- 26.Boyd P W, Watson A J, Law C S, Abraham E R, Trull T, Murdoch R, Bakker D C, Bowie A R, Buesseler K O, Chang H, et al. Nature (London) 2000;407:695–702. doi: 10.1038/35037500. [DOI] [PubMed] [Google Scholar]
- 27.Stammerjohn S E, Smith R C. In: Foundations for Ecosystem Research West of the Antarctic Peninsula, Antarctic Research Series. Ross R M, Hofmann E E, Quetin L B, editors. Vol. 70. Washington, DC: American Geophysical Union; 1996. pp. 81–104. [Google Scholar]
- 28.Smith W O, Nelson D M. Science. 1985;227:163–166. doi: 10.1126/science.227.4683.163. [DOI] [PubMed] [Google Scholar]
- 29.Worby A P, Jeffries M O, Weeks W F, Morris K, Jana R. J Geophys Res. 1996;101:28441–28455. [Google Scholar]
- 30.Tucker W B, Perovich D K, Gow A J, Weeks W F, Drinkwater M R. In: Microwave Remote Sensing of Sea Ice. Carsey F D, editor. Washington DC: American Geophysical Union; 1992. pp. 9–26. [Google Scholar]
- 31.Volk T, Hoffert M I. In: The Carbon Cycle and Atmospheric CO2: Natural Variations Archean to Present. Sundquist E T, Broecker W S, editors. Washington, DC: American Geophysical Union; 1985. pp. 99–110. [Google Scholar]


