



ABSTRACT
Extracellular vesicles (EVs) are small particles that are released by cells and mediate cell–cell communication by transferring bioactive molecules such as RNA. RNA cargo of EVs, including coding and non‐coding RNAs, can change the behaviour of recipient cells, affecting processes including gene expression, proliferation, and Fapoptosis. CircRNAs are stable and resistant to degradation and have been shown to be enriched in EVs. They play key roles in gene regulation and are also emerging as promising biomarkers for disease diagnosis due to their stability and disease‐specific expression. Although microRNAs (miRNAs) are the most well studied RNA cargo of EVs, very little is known about the mechanisms of enrichment of circular RNAs (circRNAs) as well as long linear RNAs. Here, we take a comprehensive genome‐wide approach to investigate the role of structuredness and shape along with GC%, size, exon count and coding potential, in the sorting and enrichment of circular and long linear RNAs into EVs. We developed a model using these parameters to predict the likelihood of EV packaging of RNA and it was validated by using single molecule RNA imaging of EV bound RNAs. Furthermore, we found that structuredness could explain the relative enrichment of circRNAs over their linear counterparts. These results were validated on existing public databases of circular and linear RNAs in EVs. By identifying and analysing these factors, we aim to better understand the complex mechanisms behind EV‐mediated RNA transfer and its impact on cell communication in both health and disease. This mechanistic understanding of RNA enrichment in EVs is crucial for engineering EVs with selective RNA cargo.
Keywords: extracellular vesicles, exosomes, circRNAs, mRNAs, lncRNAs, enriched, cis elements, RNA imaging, SPIRFISH
1. Introduction
Extracellular vesicles (EVs) are small membrane‐bound particles that are secreted by cells into the extracellular environment and play a crucial role in intercellular communication (Gurung et al. 2021; Yáñez‐Mó et al. 2015). EVs transfer bioactive molecules, including proteins, and various types of RNAs, between cells and thereby influence recipient cell behaviour (Pitt et al. 2016). Among the diverse cargo of EVs, RNA molecules have garnered significant interest due to their potential in regulating gene expression in recipient cells (Prieto‐Vila et al. 2021). The RNA cargo in EVs is biologically active and can significantly alter the behavior of recipient cells (Valadi et al. 2007). For instance, microRNAs (miRNAs) delivered by EVs can suppress the expression of target genes by binding to complementary mRNA sequences, leading to gene silencing (Ong et al. 2014; Ding et al. 2015; Viñas et al. 2016). This process can influence cellular functions in recipient cells such as proliferation, differentiation and apoptosis (He et al. 2020; Ding et al. 2021; Raimondo et al. 2020). The selective enrichment of certain RNA species in EVs suggests that RNA packaging into EVs is a highly regulated process rather than a random event. Most research on RNA sorting into EVs has focused on small non‐coding RNAs, primarily miRNAs. RNA‐binding proteins like Y‐box‐binding protein 1 (YBX1), Heterogeneous nuclear ribonucleoprotein A2/B1 (hnRNP A2/B1), and synaptotagmin‐binding cytoplasmic RNA‐interacting protein (SYNCRIP) have been postulated to assist in sorting miRNAs by binding to small motifs called “zip codes” within the RNA sequence (Liu et al. 2021; Shurtleff et al. 2016; Villarroya‐Beltri et al. 2013; Santangelo et al. 2016). A comprehensive review by Leidal and Debnath further elaborates on these miRNA sorting mechanisms into EVs, highlighting the complexity of this process (Leidal and Debnath 2020). However, recent work has suggested that the enrichment of miRNAs in EVs might have been overstated, and that the majority of miRNAs reported as EV cargo could simply be part of the EV biocorona (Albanese et al. 2021). On the other hand, the mechanisms underlying the sorting and selection of longer linear RNAs, such as long non‐coding RNAs (lncRNAs), and circular RNAs (circRNAs) into EVs remain largely unknown. These RNA species have recently been appreciated to be highly enriched in EVs (Kenneweg et al. 2019; Li et al. 2015), prompting further investigation into their sorting mechanisms.
CircRNAs, in particular, have recently garnered significant attention due to their unique structure and high stability as they are resistant to exonucleases (Zhou et al. 2020). CircRNAs are produced by back‐splicing where a downstream 5’ splice site attacks an upstream 3’ splice site joining the intervening sequence into a circular form (Kristensen et al. 2019). CircRNAs play a crucial role in regulating cellular gene expression in various ways. An in‐depth review by Kristensen et al. highlights the diverse functions of circRNAs, including their ability to act as sponges for miRNAs by binding them and preventing their interaction with target mRNAs, thus modulating gene expression (Kristensen et al. 2019). Additionally, circRNAs can interact with RNA‐binding proteins, influencing cellular processes such as transcription and splicing (Kristensen et al. 2019). Furthermore, the expression of circRNA is often dysregulated in many pathological conditions such as cancer, cardiovascular diseases, and neurological disorders (Verduci et al. 2021; Wang et al. 2023). Due to their stability and disease‐specific expression, circRNAs are emerging as promising biomarkers for diagnostics (Allegra et al. 2022). Detecting specific circRNAs in body fluids such as blood or urine could help in the early detection of diseases (Lin et al. 2020; Peter et al. 2021; Zhu et al. 2020). Interestingly, circRNAs were reported to be enriched in EVs compared to their cognate linear isoforms (Lasda and Parker 2016). This enrichment was first identified by Li et al., who identified over 1000 circRNAs in human serum exosomes and demonstrated their enrichment in liver cancer cell exosomes (Li et al. 2015). Although initially considered a passive process for cells to eliminate these stable RNAs, mounting evidence suggests functional roles for EV‐bound circRNAs, implying a selective packaging process (Wang et al. 2019). For instance, a recent study by Ngue et al. revealed that circRNAs in breast cancer EVs are associated with chemotherapy resistance, highlighting their potential as both biomarkers and therapeutic targets (Ngue et al. 2023). Furthermore, Chen et al. demonstrated the presence and potential roles of circRNAs in bronchoalveolar lavage fluid (BALF) EVs during lung inflammation, expanding our understanding of circRNA functions in disease contexts (Chen et al. 2024). Most recently, Zhao et al. also found enrichment of circRNAs in EVs from human biofluids (Zhao et al. 2024). Despite these advances, the mechanisms underlying the sorting and enrichment of circRNAs into EVs remain elusive.
Most studies focus on the role of RNA binding proteins (RBPs) in mediating selective enrichment of RNAs as reviewed in Fabiano et al., but exactly how RBPs distinguish between RNAs that contain the same recognition motifs is not known (Fabbiano et al. 2020). This is particularly relevant for circRNAs as they share their sequence with their linear counterparts but show differential enrichment into EVs (Li et al. 2015; Zhao et al. 2024). Much of our understanding of RNA biology has focused on its primary sequence. Although secondary structure is appreciated for certain RNA classes like tRNAs and ribozymes (Assmann et al. 2023), recent advances in structural and computational tools have revealed that all RNAs adopt complex tertiary structures, consisting of stem‐loops, pseudoknots, and multi‐helix junctions, which ultimately dictate their 3D shape and cellular fate (reviewed in (Cao et al. 2024)). RNA folding is a dynamic process influenced by intrinsic factors (size, nucleotide order, and composition) and extrinsic factors (RBPs, ionic concentration) (Bushhouse et al. 2022). Although experimental structure determination of RNA is challenging, intrinsic features like length, GC content, and nucleotide order can be used to predict the thermodynamic free energy (ΔG) of folded structures (Bellaousov et al. 2013; Lorenz et al. 2011; Low and Weeks 2010; Zuker 2003), which, along with other attributes, can be used to predict RNA structuredness (Busa et al. 2021; Radecki et al. 2018). Genome‐wide RNA structure profiling methods, such as DMS‐MaPseq, SHAPE‐Seq (Mortimer et al. 2012), icSHAPE and SHAPE‐MaP (Wang et al. 2020), along with computational modelling tools like 3dRNA (Zhang et al. 2022), RNABIND (reviewed in (Strobel et al. 2018)), have been developed to probe RNA 3D structure. Although the field of RNA structural biology is still emerging, it is evident that significant structural heterogeneity exists among cellular RNA molecules. RNA structure has a profound effect on its function. For instance, highly structured mammalian RNAs often have shorter half‐lives (Fischer et al. 2020; Guo et al. 2020). With current and emerging technologies, the field is well‐equipped to investigate RNA structure, and the impact of RNA structuredness on RNA biology is beginning to be appreciated (Dominguez et al. 2018). The role of RNA structure in maintaining RNA‐RBP specificity and stability of interaction is also garnering interest (reviewed in (Chekulaeva 2024)). Recent work from Leung lab and others has implicated RNA structuredness in RNA function and targeted decay (Fischer et al. 2020), characterizing a novel structure‐based pathway where highly structured mRNAs and circRNAs are targeted for degradation by RBPs (Guo et al. 2020). However, the role of RNA structure in intercellular transport, particularly for EV RNA, remains largely unexplored. Understanding this role is crucial for deciphering RNA transport mechanisms. We hypothesize that EV enrichment of RNAs is a cumulative effect of multiple cis and structural elements of the RNA molecule.
In this study, we performed a genome‐wide analysis investigating the role of various factors for circRNA enrichment into EVs, including the presence of motifs for RBP binding, GC content, size, exon count, and coding potential. Some of these factors particularly the small size and the role of RBPs have been reported individually in previous studies to impact RNA transport (Han et al. 2022; Zhao et al. 2024) but their cumulative effect is not fully explored. Most importantly, we evaluated the role of RNA structuredness as a critical novel factor affecting RNA enrichment into EVs. Furthermore, we also analysed the role of these factors on the transport of long linear RNAs including mRNAs and lncRNAs and developed a model to predict the probability of a given RNA molecule to be enriched in EVs. We also utilized our recently developed single molecule imaging techniques called SPIRFISH, to visualize the presence of EV enriched RNA in EV (Troyer et al. 2024). Our study aims to develop a comprehensive model to understand the process of RNA packaging into EVs. By identifying and characterizing these factors, we hope to shed light on the intricate processes underlying EV‐mediated RNA transfer and their implications for cell‐to‐cell communication in health and disease. This research has the potential to advance our understanding of EV biology and open new avenues for diagnostic and therapeutic applications leveraging EV‐RNA interactions.
2. Results
2.1. CircRNAs Are Less Structured Compared to Their Linear Counterparts
Numerous studies have investigated the enrichment of miRNAs into EVs and reported several RBPs that are involved in facilitating miRNA enrichment (Garcia‐Martin et al. 2022). We reasoned that this alone cannot explain the higher enrichment of circRNAs over their cognate linear isoforms (Li et al. 2015; Zhao et al. 2024) and that there must exist other factors that distinguish circRNAs from their linear isoforms. This is because, with the exception of the back‐splice junction, circRNAs are a subset of linear isoforms. However, since most RBPs bind 3’UTRs of mRNAs rather than the coding sequence, we sought to compare the motif counts of RBPs in circRNAs to the 3’UTRs of their cognate linear isoforms. We utilized exoRBase which is a database containing circRNAs reported in human blood EVs (Lai et al. 2022). We then compiled a list RBPs reported to be involved in RNA transport in EVs and obtained their motifs from ATtRACT database (Giudice et al. 2016). Results show that for the overwhelming majority of RBPs, 3’UTR of linear isoforms had higher RBPs motif counts compared to circRNAs (Figure 1A). This prompted us to investigate other factors that could explain this preferential enrichment of circRNAs.
FIGURE 1.
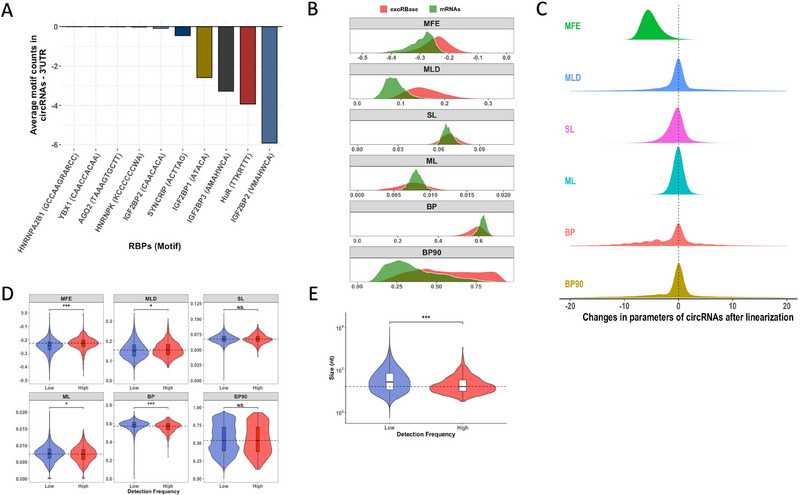
CircRNAs are less structured compared to their linear counterparts: (A) Average motif count difference between exoRBase circRNAs and the 3’ UTR of their linear counterparts for five RBPs. Motifs of RBPs are shown in brackets. (B) Distribution of size‐normalized structure parameters of circRNAs in exoRBase and their cognate linear isoforms. (C) Change in structure parameters of exoRBase circRNAs after in‐silico linearization. (D) Violin plot of size‐normalized structure parameters of exoRBase circRNAs with high detection frequency compared to those with low frequency. (E) Violin plot of size distribution of exoRBase circRNAs with high detection frequency compared to those with low frequency. Structure parameters are MFE: minimum free energy; MLD: maximum ladder distance; SL: number of stems, ML: number of multiloops of order 3 or higher; BP: Number of paired bases; BP90: 90th percentile of pair distance. p values were calculated using Mann–Whitney's test, NS: no significant difference, *p < 0.05, **p < 0.01, ***p < 0.001.
Recently, structure of RNA has been implicated in multiple aspects of its life from its inception to degradation (Fischer et al. 2020). Therefore, we wondered if structure could explain circRNAs enrichment in EVs. We investigated multiple structure‐related parameters and compared those in circRNAs from exoRBase to their cognate linear isoforms (Lai et al. 2022). There parameters include minimum free energy (MFE), maximum ladder distance (MLD), number of stems (SL), number of multi‐loops of order three or higher (ML), number of base pairs (BP), and the 90% percentile of pair distance (BP90). We directly compared these parameters for circRNAs from exoRBase to their linear isoforms from the same respective transcript. Results show that multiple factors including MFE, BP, MLD and BP90 were different between the two populations (Figure 1B). All parameters, with the exception of ML, showed noticeable differences between circRNAs and their linear counterparts. CircRNAs were on average less structured (indicated by higher size‐normalized MFE) and less compact (indicated by higher size‐normalized MLD and BP90). Although, these parameters were normalized to RNA length, other factors such as dinucleotide frequency, could affect RNA structure (Clote et al. 2005). Thus, we performed an in‐silico analysis to look at changes in structure‐related parameters upon linearization of circRNAs. Most parameters were unaffected by the linearization process with the exception of MFE which showed that linearization led to a lower MFE value for almost all circRNAs we tested (Figure 1C). We found that linearization of circRNAs increases the structuredness of RNAs (indicated by lower MFE) whereas other parameters were largely unaffected by the shape of RNA. Conversely, in‐silico circularization of mRNAs showed a reduction in the structuredness of those RNAs while the other parameters were largely unaffected (Extended Figure 1A). These data suggest that structuredness of RNA could explain the preferential enrichment of circRNAs in EVs compared to their linear counterparts. Next, we sought to understand if these parameters can contribute to the circRNA enrichment in EVs. We utilized detection frequency as a proxy for EVs enrichment and arbitrarily chose a cutoff threshold of 0.5 to compare circRNAs with high and low detection frequency in exoRBase. We analysed these circRNAs for structure parameters, size, GC%, and exon count. CircRNAs in exoRBase with high detection frequency showed a similar significantly lower structuredness (indicated by higher size‐normalized MFE and lower number of base pairs) than those with low detection frequency. They were also significantly less compact (indicated by higher size normalized MLD and a smaller number of multi‐loops) (Figure 1D). Recent studies have investigated the role of other cis elements including size, GC%, and number of exons in sorting linear RNAs into EVs (O'Grady et al. 2022). This prompted us to investigate the role of these cis elements in circRNAs enrichment in EVs. Results showed that circRNAs with high detection frequency were consistently significantly smaller but had less exons per kilobase of transcript (Figure 1E and Extended Data Figure 1C). GC% did not show a significant difference between the two populations (Extended Data Figure 1B). Since some circRNAs have also been reported to be translated into peptides, we sought to investigate whether the coding potential of circRNAs in the cell would affect their EVs enrichment (Legnini et al. 2017; Jiang et al. 2021; van Heesch et al. 2019). We compared the coding probability of circRNAs and found that circRNAs with high detection frequency showed significantly lower coding probability than those with low detection frequency (Extended Data Figure 1D).
These data suggest that EVs enriched circRNAs have a distinct profile of sequence features that distinguish them from their cognate linear isoforms as well as from other cellular circRNAs.
2.2. CircRNAs Are Enriched in EVs
To validate these results, we prepared RNA sequencing libraries of total RNAs from DLD‐1 cells and their isolated EVs. EVs from DLD‐1 cells were isolated and characterized according to MISEV guidelines (Théry et al. 2018) (Figure 2A and Extended Data Figure 2A–D). Although circRNAs are much more stable compared to linear RNAs—due to their lack of free ends—they represent a small proportion of cellular RNAs (Zhang et al. 2019). To enrich circRNAs, RNA from both cell and EVs fractions were treated with RNase R which digests linear RNAs and, thus, enriches circRNAs. We obtained high‐quality reads from sequencing of RNA libraries with a high percentage of reads from both cells and EV samples aligning to the human genome (Extended Data Figure 3A). CircRNAs were then identified from sequencing data and analysed for enrichment in EVs. First, we did observe a significant increase in the ratio of circRNAs to linear RNAs after RNase R treatment in both cellular and EVs fractions (Extended Data Figure 3B). Consistent with previous reports of circRNAs enrichment in EVs, we found that in control samples (no RNase R treatment), the ratio of circular to linear RNAs was significantly higher in EVs compared to cells (0.288 vs. 0.178; p < 0.001, Mann–Whitney's test) (Figure 2B). This suggests that circRNAs are more enriched in EVs compared to the cell which is in line with previous reports (Li et al. 2015; Lasda and Parker 2016). We detected around 30% overlap with circRNAs in exoRBase 2.0 but a smaller overlap (13%) with circBase (Figure 2C and Extended Data Figure 3C) (Glažar et al. 2014; Lai et al. 2022). The vast majority of detected circRNAs were exonic (defined as both start and end positions located in exons) while only a small fraction (1.8%) was intronic (Extended Data Figure 3D). All of the intronic circRNAs had low number of reads and were excluded during differential expression analysis (Extended Data Figure 3E). We further analysed the coverage of exons along multi‐exonic circRNAs (two or more exons) and found a much lower coverage of introns compared to exons. This was particularly lower in circRNAs in EVs compared to cellular circRNAs (Extended Data Figure 3F). Moreover, we compared the raw counts and normalized counts of different classes of RNAs in EVs. Since, using the number of back‐splice junctions severely underestimates circRNAs counts, we remapped the reads of RNase R‐treated samples to circRNAs detected using back‐splice junctions. When comparing the number of transcripts of both circRNAs and linear RNAs (mRNA, lncRNAs and other RNAs) that are detected in EVs, we observed higher average count of circRNAs transcripts compared to linear classes of RNAs (Figure 2E). There were more circRNAs detected in at least one or two of the three replicates compared to linear RNAs. Moreover, RNA counts from all classes were normalized using DESeq2 and their differential enrichment in EVs were analysed. CircRNAs showed the highest enrichment in EVs followed by mRNAs, lncRNAs and, finally, other RNAs (Figure 2F). These results are again consistent with previous reports and highlight the preferential enrichment of exonic circRNAs in EVs.
FIGURE 2.
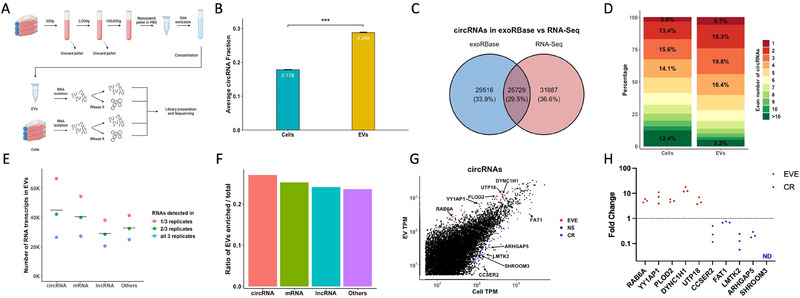
CircRNAs are enriched in EVs: (A) Workflow of EVs isolation and RNA‐Seq. (B) Average circular/linear RNA fraction in cell and EVs. (C) Overlap of identified circRNAs with exoRBase circRNAs. (D) Distribution of circRNA exon numbers in cells and EVs. (E) Total number of transcripts detected in either one, two, or all three EV samples from RNA‐Seq for all four classes of RNAs analysed. (F) Ratio of significantly enriched transcripts in EVs compared to cell‐retained transcripts for all four classes of RNAs analysed. (G) circRNAs abundance from RNA‐Seq in EVs and cells. Arrows point to names of circRNAs that were validated by RT‐qPCR. (H) EVs/cell fold Change of circRNAs from three independent samples. CR, cell retained; EVE, EVs enriched; ND, not detected. p values were calculated using Mann–Whitney's test, ***p < 0.001.
FIGURE 3.
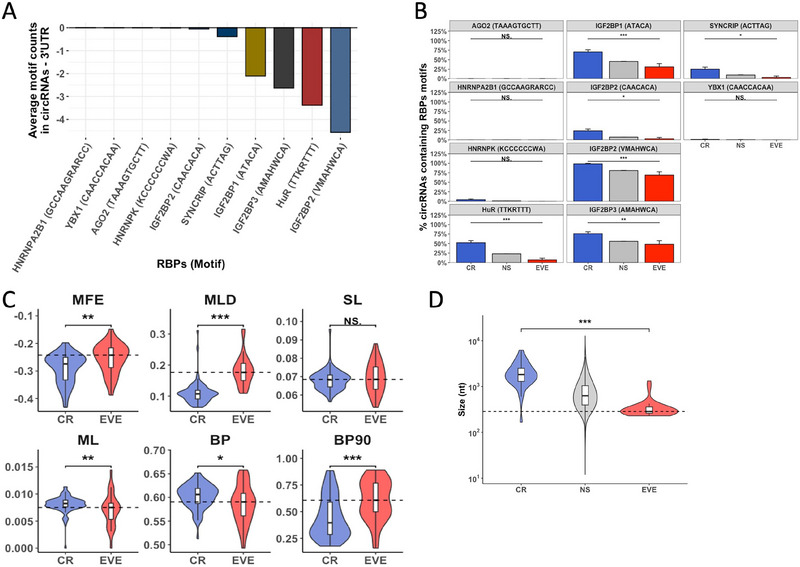
Role of cis elements in enriching circRNAs in EVs: (A) Average motif count difference between cells and EVs circRNAs and the 3’ UTR of their linear counterparts for five RBPs. Motifs of RBPs are shown in brackets. (B) Percentage of EVs enriched (EVE), cell retained (CR), or circRNAs with no significant difference (NS) that contain RBPs motifs. Motifs of RBPs are shown in brackets. (C) Violin plot of size‐normalized structure parameters of EVE and CR circRNAs. (D) Violin plot of size distribution of EVE, NS and CR circRNAs. Structure parameters are MFE: minimum free energy; MLD: maximum ladder distance; SL: number of stems, ML: number of multiloops of order 3 or higher; BP: Number of paired bases; BP90: 90th percentile of pair distance. p values were calculated using Mann–Whitney's test, NS: no significant difference, *p < 0.05, **p < 0.01, ***p < 0.001.
Overall, we observed a high correlation between the abundance of circRNAs in cells and in EVs (r = 0.84) and we validated selected enriched and depleted circRNAs using RT‐qPCR (Figure 2G–H and Extended Data Figure 3G). These results validate that circRNAs are one of the major RNA cargoes in EVs.
2.3. Role of Cis Elements in Enriching CircRNAs in EVs
We reanalysed motif enrichment of RBPs on cells and EVs circRNAs in our RNA seq dataset. Results were consistent with exoRBase circRNAs (Figure 3A). 3’ UTRs of linear transcripts contained on average more motifs of most RBPs compared to cells and EVs circRNAs. Analysing circBase circRNAs showed similar results (Extended Data Figure 4A). Next, we categorized circRNAs based on their enrichment in EVs as either EVs‐enriched (EVE), cell retained (CR) or those whose enrichment is not significant (NS), and we then compared the motif occurrence of all RBPs from previous analysis. For all RBPs, there was either no difference or a significantly higher fraction of CR circRNAs containing RBPs motifs compared to EVE circRNAs (Figure 3B). These results, once again, indicate that circRNA enrichment in EVs could not be solely explained by the presence of “Zipcodes”. We then sought to study the sequence of features of cell and EVs circRNAs. Consistent with results from exoRBase circRNAs, results showed that EVE circRNAs were significantly less structured (indicated by higher size‐normalized MFE and smaller number of base pairs) and less compact (indicated by higher size‐normalized MLD and BP90 and lower number of multi‐loops) (Figure 3C). EVE circRNAs were also smaller significantly smaller than CR circRNAs and had higher number of exons per kilobase transcript (Figure 3D and Extended Data Figure 4B).
FIGURE 4.
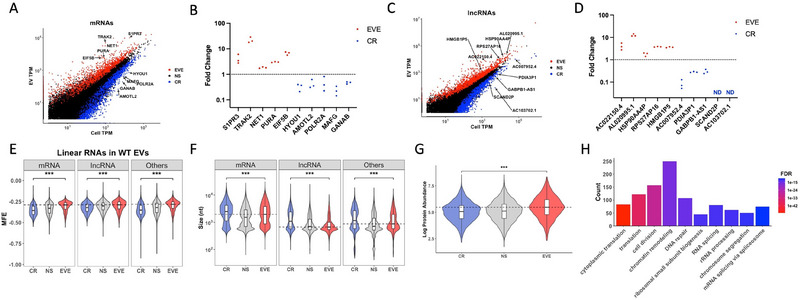
Role of cis elements in enriching linear RNAs in EVs: (A) mRNAs abundance from RNA‐Seq in EVs and cells. Arrows point to names of mRNAs that were validated by RT‐qPCR. (B) EVs/cell fold change of mRNAs from three independent samples. ND = not detected. (C, D) Similar to A–B but for lncRNAs. (E) Violin plot of size‐normalized structure parameters of EVs enriched (EVE), cell retained (CR), and linear RNAs with no significant difference (NS). (F) Violin plot of size distribution of EVE, NS and CR linear RNAs. (G) Log protein cellular abundance of EVE, NS and CR mRNAs. (H) Gene Ontology (GO) biological process enrichment analysis for EVs enriched mRNAs. p values were calculated using Mann–Whitney's test, ***p < 0.001.
GC%, however, did not show a significant difference between EVE and CR circRNAs (Extended Data Figure 4C). Finally, coding probability of EVE were lower than that of CR circRNAs (Extended Data Figure 4D). This could indicate that translation of circRNAs might impeded their enrichment of EVs. Overall, these data validate the results of sequence analysis of exoRBase circRNAs and highlight the different sequence features profile of EVs enriched circRNAs characterized by lower structuredness, lower compactness and smaller size.
2.4. Role of Cis Elements in Enriching Linear RNAs in EVs
Next, we investigated if the same factors under study are also involved in the EVs enrichment of linear RNAs. To this end, we first separated all linear RNAs from Gencode v32 into three categories: protein‐coding genes, labelled as mRNAs, long non‐coding RNAs labelled as lncRNAs and all other classes of linear RNAs labelled as others. We then quantified linear RNAs in our RNA‐Seq data and categorized them into EVE, NS or CR based on their enrichment in EVs. We used qPCR to validate select mRNA and lncRNA candidates from both EVE and CR categories and obtained consistent results to our RNA‐Seq datasets (Figure 4A–D).
To determine the role of RNA features in EVs enrichment, we first investigated structure parameters. We found that all EVs enriched classes of linear RNAs showed a similar significantly lower structuredness (indicated by higher size‐normalized MFE and less base pairing) compared to CR linear RNAs (Figure 4E and Extended Data Figure 5A). We further dissected mRNAs into their constituting parts: 5’ UTR, CDS and 3’UTR. Results showed that the difference in structuredness was attributed to 3’UTR and CDS while 5’UTRs had similar structuredness between EVE and CR mRNAs (Extended Data Figure 5B). LncRNAs showed significantly lower compactness (indicated by higher size‐normalized MLD and BP90 (Extended Data Figure 5A). EVE mRNAs and lncRNAs were significantly smaller and both had more exons per kilobase transcript (Figure 4F and Extended Data Figure 5C). The smaller size of EVE mRNAs was mainly attributed to 3’UTRs (Extended Data Figure 5D). Furthermore, we found that all linear RNA showed lower GC% for those enriched in EVs (Extended Data Figure 5E). Once again, the difference in GC% was attributed to 3’UTR and CDS (Extended Data Figure 5F). In contrast to circRNAs, we found that the coding probability of EVE lncRNAs was higher than that of CR lncRNAs (Extended Data Figure 5G). Furthermore, we compared mRNAs with high detection frequency in exoRBase to those with low frequency and we found the results to be highly consistent with our dataset. (Extended Data Figure 6A–D).
FIGURE 5.
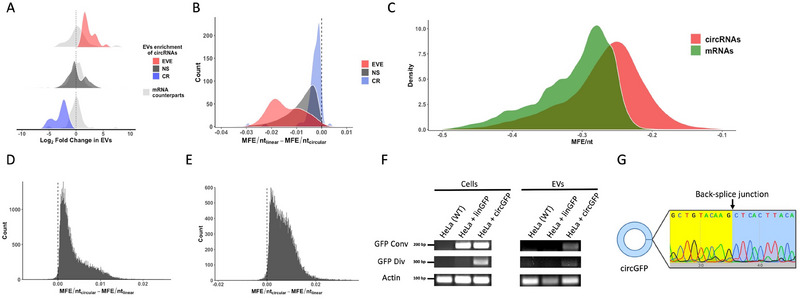
Circularization enhances RNAs enrichment in EVs: (A) Density plot of log2 fold change in EVs of circRNAs that are EVs enriched (EVE), cell retained (CR), or those with no significant difference (NS) as well as their respective mRNA counterparts. (B) Change in structuredness (MFE) after linearization of EVE, NS or CR circRNAs sequences. (C) Density plot of the structuredness of circRNAs and their mRNA counterparts. (D‐E) Change in structuredness (MFE) after circularization of mRNAs and lncRNAs sequences, respectively. (F) Gel image of WT HeLa cells, or cells expressing linear GFP or circular GFP (circGFP) in cells and EVs using both convergent and divergent primers. (G) Sequence of circGFP covering the back‐splice junction.
FIGURE 6.
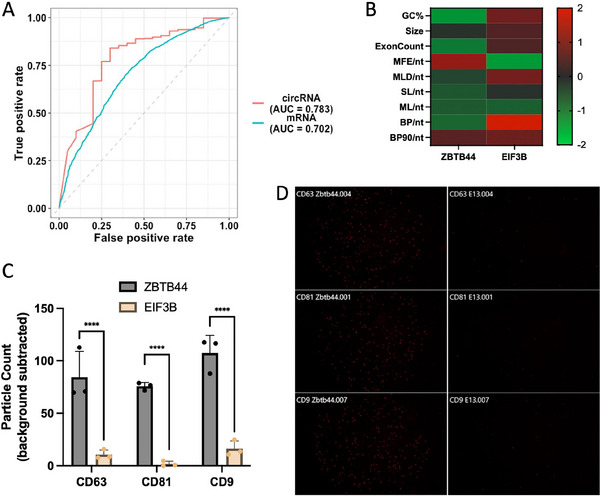
Prediction of RNA enrichment in EVs: (A) Receiver operating characteristic (ROC) curve for EV enrichment prediction models for circRNAs and mRNAs. AUC is shown in brackets. (B) Heatmap of z‐scores of sequence features of ZBTB44 and EIF3B mRNAs. (C) Grouped bar graph comparing the number of CD81+ particles (determined by capture spot) that are detected by interferometry and additionally are determined to be smFISH+. Bars show the mean particle counts across three independent SP‐IRIS microchip experiments; error bars represent standard deviation. Statistical testing was performed by ordinary one‐way ANOVA with Šídák's multiple comparisons test. ****, p ≤ 0.0001. (D) Representative red channel fluorescent images detecting smFISH+ particles from (top to bottom) CD63, CD81, CD9 capture spots on the SP‐IRIS microchips for ZBTB44 and EIF3B RNAs.
Finally, we sought to correlate RNA abundance in EVs with proteins abundance in the cell, we performed mass spectrometry analysis of DLD‐1 whole‐cell lysate. We then correlated transcript per million (TPM) values for mRNAs with intensity‐based absolute quantification (iBAQ) for proteins (Schwanhäusser et al. 2011). Surprisingly, Spearman's correlation of protein abundance with RNA abundance in EVs was higher than the correlation with RNA abundance in cells (0.487 vs. 0.457, p value = 0.002). We also saw a significantly higher protein abundance of EVE mRNAs compared to CR mRNAs (Figure 4G). Interestingly, EVE mRNAs were enriched in processes related to translation, cell division, chromatin remodelling and DNA repair (Figure 4H).
These data suggest that similar sequence features (lower structuredness and smaller size) distinguish linear RNAs that are enriched in EVs.
2.5. Circularization Enhances RNAs Enrichment in EVs
Since, a given gene can be spliced differently to produce both linear RNAs as well as circRNAs and thus linear RNAs harbour most of the same cis elements that are found in circRNAs. We wondered if the linear counterparts of EV‐enriched circRNAs have an equal probability to be enriched into EVs and vice versa. We compared the abundance of linear cognates of circRNAs and found a Spearman correlation of 0.007 indicating no correlation between the enrichment of linear and circular transcripts from the same gene into EVs. Furthermore, we analysed the differential EV‐enrichment of linear isoforms of all circRNAs in our dataset. The distributions of the fold change of linear counterparts were almost identical regardless of the level of enrichment of the circRNAs (Figure 5A). These data further confirm that there is a distinct and independent mechanism for the enrichment of circular and linear RNAs into EVs despite sharing the same sequence.
We then sought to validate the role of RNA shape on its structuredness using RNAs in our dataset. We performed in‐silico linearization of circRNAs sequences and calculated the difference in their structuredness scores (size‐normalized MFE) and compared it to their original scores. Indeed, most circRNAs from all gained structuredness (−ΔG/nt) after linearization indicated by lower (MFE) (Figure 5B). 98.3% of circRNAs had lower structuredness compared to their linearized sequences. Furthermore, we found larger gains in structuredness after in silico linearization for EVs‐enriched circRNAs than those with no enrichment or cell‐retained circRNAs (Figure 5B). Furthermore, when we compared the structuredness of circRNAs to that of their linear counterparts, we observed that circRNAs, on average, had significantly lower size‐normalized structuredness (indicated by higher MFE/nt) than their linear counterparts (Figure 5C).
Conversely, we investigated whether linear RNAs would become less structured after circularization. In‐silico circularization of mRNA sequences from our dataset, led to lower structuredness (Figure 5D). Similarly, lncRNAs showed lower structuredness after circularization (Figure 5E). These data suggest that circular conformation leads to lower structuredness of circRNAs which could explain their EVs enrichment over their linear counterparts.
To experimentally verify these in silico results, we designed a linear and circular version of GFP, and we cloned either linear GFP or circular form of GFP (circGFP) in HeLa cells and isolated RNAs from both cellular and EV fractions of cells expressing these GFP variants. We found that circGFP could be detected in EVs but not linear GFP (Figure 5F). To confirm the circularity of the circGFP, the PCR products from both cellular and EV fractions were extracted and sequenced to confirm the presence of the back‐splice junction (Figure 5G). These results validated our findings that circularization of a linear RNA could increase its enrichment in EVs likely by lowering its structuredness.
2.6. Prediction of RNA Enrichment in EVs and Visualization of EV Bound RNAs Using SPIRFISH
Combining all of the above information, we sought to build a model that can predict the enrichment of RNAs in EVs. Starting with circRNAs, we developed two random forest models that takes the cis element information of circRNAs and mRNAs, respectively, as input, including structure parameters (MFE, MLD, SL, ML, BP and BP90), GC% and AT%, size, exon count per kilobase, and coding probability for circRNAs. The models achieved an area under the curve of receiver operating characteristic curve (AU‐ROC) of 78.3% and 70.2%, respectively (Figure 6A).
We then ranked the importance of sequence features from the model and found the three most important variables are size, coding probability and compactness (MLD) for circRNAs and AT%, GC% and structuredness (MFE) for mRNAs (Extended Data Figure 7A, B). To showcase the applicability of this model, we selected two mRNAs: ZBTB44 which was predicted to be enriched in EVs and EIF3B which was predicted to not be enriched in EVs by our model). ZBTB44 and EIF3B mRNAs had different profiles of sequence features and thus their EV enrichment scores for were 83.34% and 19.8%, respectively (Figure 6B). We utilized our recently developed SPIR‐FISH method that allows simultaneous detection of protein and RNAs in single EVs (Troyer et al. 2024). Using smFISH probes for both ZBTB44 and EIF3B, we found that ZBTB44 showed significantly higher particle count that were smFISH+ compared to EIF3B indicating the presence of ZBTB44 in individual EVs (Figure 6C, D and Extended Data Figure 7C).
FIGURE 7.
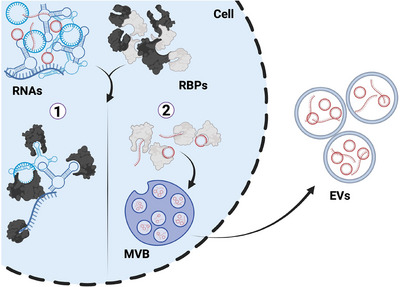
Model of RNA sorting into EVs: MVB, multivesicular body. Different coloured proteins are depicting unique proteins that interact with high or low structured RNAs. Created with BioRender.com.
These results highlight that these sequence features are important contributors to RNA cargo selection and can be used to predict RNAs enrichment in EVs with reasonable accuracy.
3. Discussion
In this study, we evaluated the role of several cis factors in the enrichment of different RNA species into EVs. Our findings suggest that RNA packaging into EVs is dependent on a combination of RNA cis elements including GC%, size, the number of exons, structuredness and the coding potential for non‐coding RNAs. Although numerous studies have investigated the role of GC%, size and exons count in RNAs enrichment in EVs, this is the first study exploring the role of structuredness and coding potential of RNA in its extracellular transport as well as looking at combinatorial effect of multiple cis factors. We used a genome wide approach to characterize long RNA cargo of EVs. Our data validated the fact that circRNAs are more abundant in EVs compared to other long linear classes of RNA, such as mRNAs and lncRNAs which was also reported by other studies (Li et al. 2015; Lasda and Parker 2016). The process of EVs cargo selection is likely a highly regulated one where the cellular function and homeostasis of a given RNA could affect its enrichment in EVs. For example, CDR1as, a circRNA well known for its sponging function of miR‐7, was not enriched in EVs when miR‐7 mimics were introduced in the cell while its cellular levels increased (Li et al. 2015). Thus, RNA cargo selection for EVs could potentially be a yet another tool in the arsenal of cell to regulate its gene expression (O'Grady et al. 2022).
The most common mechanism explored for RNA transport thus far relies on the ability of RBPs to recognize specific sequence motifs in the RNA sequences. RNA‐RBP interactions are often attributed to sequence motifs, also known as “zip codes”, recognized by RBP RRMs. These motifs, typically up to 25 nucleotides long with a core sequence of 4–5 nucleotides, are often located at the 3' end of the RNA. Several subcellularly localized RNAs contain consensus zip codes (Hamilton and Davis 2007; Martin and Ephrussi 2009), which have also been implicated in RNA packaging into intracellular compartments (Arora et al. 2022). Recent efforts have focused on identifying such zip codes for RBPs that can be responsible for EV RNA targeting, primarily for miRNAs (Mukherjee et al. 2016; Oka et al. 2023; Santangelo et al. 2016; Shurtleff et al. 2016; Villarroya‐Beltri et al. 2013) and to a lesser extent for mRNAs (Bolukbasi et al. 2012; Szostak et al. 2014). A purine‐rich zip code has also been reported for circRNA sorting (Zhang et al. 2019). However, the presence of these zip codes alone cannot fully explain the differential sorting and transport of RNAs (Jankowsky and Harris 2015), especially in the case of circRNAs, which share the same sequence as linear counterparts but exhibit distinct localization patterns. For instance, several studies showed preferential enrichment of circRNAs over their linear counterparts in EVs (Zhao et al. 2024). The altered conformation resulting from circularization likely affects the presentation or sequestration of zip codes compared to linear RNAs (Choudhary et al. 2019). Although protein structural biology and computational tools have provided significant insights into RRM structure and function, the arrangement of zip codes within folded RNA structures and how these arrangements influence RBP recognition remains unclear (Dominguez et al. 2018). This RBP‐dependent RNA transport is studied both in the context of the transport of different RNA species within the cell as well for its extracellular Transport (Batish et al. 2012; Fabbiano et al. 2020). For instance, it was believed that neuronal RNAs are transported to distal dendrites via packaging into RNA granules using RBPs by virtue of having the RBP recognition motifs termed as “zip codes”. However, it was shown that addition of zip codes from a dendritically localized RNA to an exogenous RNA does not result in its packaging into RNA granules. In fact, single molecule imaging revealed that RNA granules do not have aggregates of RNAs of same or different species implying that these zip codes do not direct the packaging of RNAs into granules (Batish et al. 2012). Similarly, several zip codes have been identified for EV bound RNAs particularly for miRNAs. We evaluated the presence of these zip codes in EV‐enriched circRNAs and long linear RNAs and could not find preferential enrichment of zip codes in circRNAs over their linear counterparts. These results signify that the presence of RBP recognition motifs on RNAs cannot solely dictate the packaging of a given RNA species into EVs, and that certain constraints on RNA transport apply in conjunction.
Recent work has identified the correlation of other RNA cis factors with EVs enrichment. Of note, size and GC content are one of most evaluated features. CircRNAs in EVs were also reported to have smaller size and lower GC% compared to cellular circRNAs (Zhang et al. 2019). Consistently, we observed that circRNAs enriched in EVs in our dataset as well as in public databases have a smaller size. Further, GC% of circRNAs with high detection frequency in exoRBase was significantly different. In our dataset, although the GC% difference was not significant, it was slightly lower than that of cell‐retained circRNAs. Given the small size of EVs, it is perhaps reasonable to assume that smaller RNAs would have a higher tendency to be packaged as compared to longer RNAs. Furthermore, O'Grady et al., have recently examined the correlation of cis elements such as GC%, size and exon counts with EVs enrichment of linear RNAs and found that EV enriched linear RNAs tend to have smaller size, contain a larger number of exons and have relatively higher GC% (O'Grady et al. 2022). We found similar results for the size and exon count for mRNAs and lncRNAs, but our data suggest that linear RNAs that are EVs enriched have lower GC% compared to those retained in the cell. Some studies, however, have found no difference in GC content of long RNAs between EVs and human plasma while others reported lower GC% of circRNAs in EVs fractions compared to cellular fractions in HepG2 cells (Rodosthenous et al. 2020; Zhang et al. 2019). This inconsistency could be attributed to different cell types used in those studies and, therefore, might suggest an inconsequential role of GC content in enriching RNAs in EVs.
The coding potential is a relatively less explored feature of RNA that we showed to be correlated with EV enrichment. Interestingly, we found that coding potential has opposite effects for circular and linear RNAs. Analysis of RNAs from public datasets confirmed the effect we observed in our own data. EVs were enriched with circRNAs of lower coding potential and lncRNAs of higher coding potential than their respective cellular fractions. Although some circRNAs were recently reported to encode peptides, they still represent a small fraction of identified circRNAs. For instance, about 1200 circRNAs are predicted to have the ability to be translated into peptides (Li et al. 2021). This number diminishes in comparison to over 90,000 circRNAs reported in circBase and over 289,000 reported in more recent databases such as CircNet 2.0 (Glažar et al. 2014; Chen et al. 2022). Conversely, regulatory functions of circRNAs including miRNAs sponging and protein interactions remain the main functions reported for circRNAs. For instance, the number of predicted circRNA‐miRNA interactions are over nine million (Chen et al. 2022). On the other hand, Almeida et al. have reported numerous lncRNAs in EVs that were predicted to encode peptides and have experimentally confirmed several of those peptides (Almeida et al. 2022). Perhaps, cells prioritize circRNAs with non‐coding functions and lncRNAs with translation capabilities to be transported into EVs. Furthermore, we quantified the correlation of protein abundance with mRNAs abundance in cells and obtained similar results to what is reported in literature (Jarnuczak et al. 2021). It is intriguing to see a small, albeit significant, increase in correlation of protein abundance with mRNAs abundance in EVs compared to cells. Our data also indicate EV enriched mRNAs had higher cellular protein abundance. It is possible that cells might opt to restrict the transport of mRNAs with low protein abundance as their function could be needed in the cell.
One of the key findings of this study is the role of structuredness on RNA transport. Our data suggest that structuredness is a novel factor that could explain the preferential enrichment of circRNAs in EVs. Recently, RNA secondary structure was reported to play a major role in determining the decay of cellular mRNAs and circRNAs. This process has been termed as structure‐mediated RNA decay (Fischer et al. 2020). Specifically, highly structured linear and circular RNAs are more prone to decay in the cell compared to those with lower structuredness (Fischer et al. 2020). Here, we report that structured RNA decay does have implications on the transport of RNAs into EVs wherein highly structured RNAs tend to be retained in the cell and not get packaged into EVs while less structured RNAs tend to get enriched into EVs. We applied our observations to publicly available datasets for circRNAs as well as linear RNAs and found that structuredness was consistently inversely correlated with EVs enrichment of RNAs. Furthermore, our data suggest that circularization of RNA leads to a decrease in its structuredness, and that this could explain the preferential enrichment of circRNAs in EVs over their cognate linear isoforms. Specifically, we found that most circRNAs have lower size‐normalized structuredness than their linear isoforms and that the enrichment of circRNAs is independent of their linear isoforms. This selective enrichment may be due to the enhanced stability of circRNAs as they are less likely to be targeted by structure‐mediated RNA decay pathway. Furthermore, it is likely that different RBPs recognize RNAs based on their structure instead of just the sequence motifs. In other words, the actual “zipcode” might lie in the secondary structure of RNA instead of its linear sequence.
Thus, we found that a combination of multiple factors contributes to the enrichment of circRNAs in EVs. The higher abundance of circRNAs in EVs could enhance their role in modulating gene expression in recipient cells, suggesting a preferential mechanism for EV‐mediated transfer of regulatory RNAs as well as miRNAs which had been extensively reported in literature (Bao et al. 2018; Abels et al. 2019; Harmati et al. 2019). Our data indicate that there is a selection process in the cell where RNAs of different classes either get sorted to EVs or are retained in the cell based on their cis elements (Figure 7). It is likely that this process is mediated by RBPs that recognize these elements along the RNA sequence and effect their transport (O'Grady et al. 2022). For instance, RBPs could bind to stem‐loop or other structured parts of an RNA leading to its retention in the cell whereas those lacking such structured elements are free to bind other RBPs that facilitate their enrichment in EVs.
Cellular origin could impact RNA profiles in EVs and hence conducting such analysis using a few cell lines under specific conditions may not fully capture the diversity of RNA enrichment patterns in EVs (Vaka et al. 2023). For this reason, we sought to validate our results using existing publicly available databases such as exoRBase. In the case of circRNAs and mRNAs, we were able to validate most of the results from our datasets. It is possible that different factors could be at play in different cell types or in response to various environmental conditions. Furthermore, although we have focused in this study on the cis elements of RNAs that are correlated with their enrichment in EVs, these effects are probably mediated through a network of RBPs in the cell. Ongoing work aims to identify RBPs that are potentially involved in RNA sorting into EVs and investigate the specific molecular mechanisms underlying these interactions. Functional validation experiments, such as RNA immunoprecipitation or knockdown studies, are then needed to confirm the role of these proteins in RNA packaging and to determine if other unidentified factors contribute to this process.
Differentiating reads originating from circRNAs and mRNAs in RNA‐Seq data has been quite challenging. To investigate circRNAs, we utilized RNase R treatment in this study which is a 3’‐5’ exoribonuclease that degrades linear RNAs with high processivity and, thereby, enriching circRNAs. However, RNase R's activity is not 100% effective in degrading linear RNAs. Specifically, RNase R needs at least seven unstructured nucleotides at the 3’ end of RNAs to be able to bind those RNAs (Vincent and Deutscher 2006). Moreover, it was reported RNase R is interrupted by internal G‐quadruplex structures (Xiao and Wilusz 2019). Therefore, it remains difficult to accurately distinguish reads from linear and circular transcripts. Hence, we relied on back‐splice junctions to count circRNAs for most of our analysis. Although this definitely gives an underrepresented count of circRNAs in a sample, it lends more confidence to the conclusion of our analysis. This could explain the discrepancy between studies reporting circRNAs enrichment in EVs and those unable to detect such enrichment. The latter studies have likely relied solely on back splice junctions to quantify circRNAs enrichment (Pérez‐Boza et al. 2018). Full‐length RNA‐Seq, and perhaps in conjunction with short‐read sequencing, could be able to address this challenge and to further identify alternatively spliced circRNAs isoforms that share the same back splice junction (Xin et al. 2021; Kontos et al. 2023). Furthermore, imaging approaches such as circFISH can be used to experimentally quantify the difference between circular and linear transcripts of a given gene (Koppula et al. 2022).
Although our study sheds light on new factors influencing RNAs enrichment in EVs, several limitations need to be acknowledged. The methods used for EV isolation could introduce biases in the types of RNAs detected and EVs of different size could have different cargo (Tang et al. 2017; Barreiro et al. 2020). In this study, most of our EVs population were within the size range of small EVs (sEVs) (<200 nm) (Welsh et al. 2024). It would be interesting to see if these findings would be applicable to EVs of larger size ranges. Moreover, in some EVs isolation techniques, other extracellular components, such as lipoproteins or protein complexes could be co‐isolated with EVs, which could confound the analysis of RNA content. For this reason, we included a size exclusion step in our EV isolation protocol to remove such confounding factors. Additionally, many of the steps in a RNA‐Seq protocol can introduce biases, particularly for samples with low quantity and/or quality of RNA which can eventually affect the comprehensiveness of RNA profile analysis (Shi et al. 2021). Further studies using a broader range of cell types and experimental conditions would be important to generalize these findings. Furthermore, our study primarily focused on the steady‐state levels of RNA in EVs without considering the dynamics of RNA packaging and release. RNA content in EVs may change over time or in response to cellular or environmental stimuli, and these temporal dynamics were not captured in our experimental design. Longitudinal studies with time‐course analysis would provide a more comprehensive understanding of how RNA cargo is selectively packaged into EVs under such different conditions. Addressing these limitations in future research will be critical to fully understanding the mechanisms governing RNA enrichment in EVs and their potential applications in therapeutics.
Our study provides insights into the factors that govern RNAs enrichment in EVs, emphasizing the selective nature of RNA packaging influenced by various RNA cis elements. Ongoing work in our lab is focused on determining if RNA structure plays a role in intracellular RNA transport as well and to characterize RBPs that are involved in distinguishing EV cargo based on RNA structure and the underlying mechanisms for this selection process. Understanding these mechanisms is crucial for leveraging EVs in therapeutic applications as RNA delivery vehicles. Future work should focus on elucidating the detailed molecular mechanisms driving selective RNA packaging and enrichment and how these processes are altered in different pathological states. This could pave the way for more precise use of EVs in therapeutics applications.
4. Materials and Methods
4.1. Cell Culture
DLD‐1 cells (a generous gift from Leung lab (Johns Hopkins, MD, USA)), HEK‐293T, and HeLa cells were cultured in DMEM (Millipore Sigma, St. Louis, MO, USA, D6429) supplemented with 10% FBS (Millipore Sigma, St. Louis, MO, USA, F2442) and 1% penicillin/streptomycin (Millipore Sigma, St. Louis, MO, USA, P4333). All cells were grown in a humidified incubator at 37°C and with 5% CO2. HeLa cells were transduced with lentiviruses to generate stable engineered cell lines. Briefly, second generation lentiviral vectors were used along with either a plasmid expressing linear (Addgene 12154) or a plasmid expressing circular GFP (circGFP) (a gift from Guarnerio Lab) in 293T cells to produce lentiviruses that were collected, concentrated and then added to HeLa cells (Guarnerio et al. 2019). Successfully transduced cells were sorted using Fluorescence Activated Cell Sorting (FACS) (BD FACSAria III, San Jose, CA, USA).
4.2. EVs Isolation and Characterization
DLD‐1 cells were grown in T‐175 flasks to 50%–70% confluency and were washed twice with sterile PBS. The growth medium was then replaced with serum‐free growth medium, and cell culture conditioned medium (CCM) was collected after 48 h. Collected CCM was spun down using ThermoFisher Sorwall WX80 centrifuge at 10,000×g for 30 min at 4°C with max. acceleration and deceleration using Open‐Top Thinwall Ultra‐Clear Tubes (Beckman Coulter, 344058) and AH‐629 swinging bucket rotor (K factor: 242). The subsequent supernatant from the spin was centrifuged again at 100,000×g for 70 min at 4°C. Resulting pellet was resuspended in 1 mL PBS and loaded onto a qEV1 Legacy 70 nm column (Izon) prewashed with Dulbecco's phosphate buffered saline (DPBS, Gibco) and four 1‐mL fractions were collected using automated fraction collector (Izon) with default settings. Fractions were combined and further concentrated with Amicon 15 Ultra RC 10 kDa filters (Millipore Sigma at room temperature (RT, approx. 22C) till final volume.
Flow NanoAnalyzer (NanoFCM, Inc) was used to measure the concentration and size of particles following the manufacturer's instructions. Briefly, the instrument was calibrated separately for concentration and size using 250 nm PE‐ and FITC‐ fluorophore‐conjugated Silica Nanospheres (NanoFCM, QS2502) and a Silica Nanosphere Cocktail #1 (NanoFCM, S16M‐Exo), respectively. Samples were diluted in DPBS, and events were recorded for 1 min. Using the calibration curve, the flow rate and side scattering intensity were converted into corresponding particle concentrations and size. We have submitted all relevant data of our experiments to the EV‐TRACK knowledgebase (EV‐TRACK ID: EV250065) (EV‐TRACK Consortium et al. 2017)
4.3. Western Blot
The volume of the final product normalized for all samples. 10 uL of the sample were mixed with 8 uL of 1x PBS and were lysed in 1x radioimmunoprecipitation assay buffer (RIPA, Cell Signalling Technology, 9806) for 30 min at RT. Lysates were heated at 100C for 5 min with Laemmli sample buffer (Bio‐Rad, 1610747).
Samples then were subjected to SDS‐PAGE using a 4%–15% Criterion TGX Stain‐Free Precast gel (Bio‐Rad, 5678084), then transferred onto a PVDF membrane (Invitrogen, IB24001) using iBlot 2 semi‐dry transfer system (Invitrogen) for 1 min at 20 V, 4 min at 23 V and 2 min at 25 V. Blots were incubated for 1 h in PBST (PBS with 0.05% Tween‐20 (BioXtra, P7949) and 5% Blotting Grade Blocker (Bio‐Rad, 1706404) (PBST‐Milk) and incubated overnight (approx.16 h) in primary antibodies (CD63 BD Biosciences, 556019 1:1000 dilution, CD9 Biolegend, 312102 1:1000 dilution; Syntenin‐1 Abcam, ab133267 1:1000 dilution; GM‐130 Santa Cruz, sc‐55590 1:500 dilution; and Ago‐2 Abcam 186733 1:1000 dilution). Membranes were washed three times in PBST‐ milk before incubation with species‐specific HRP‐conjugated secondary antibodies (m‐IgGκ BP‐HRP Santa Cruz, 616102 1:10000 dilution; or Mouse anti‐Rb IgG HRP, Santa Cruz 2327 1:10000 dilution). SuperSignal West Pico PLUS Chemiluminescent Substrate (Thermo Scientific, 34580) was used for detection, and blots were visualized with an iBright 1500FL Imager (Thermo Fisher).
4.4. Transmission Electron Microscopy
Extracellular vesicle preparations (10 µL) were imaged as described in Huang et al. (2020) with a Philips CM120 instrument and an 8‐megapixel AMT XR80 charge‐coupled device (Huang et al. 2020).
4.5. RNA Extraction, Library Preparation and Sequencing
RNA extraction and total transcriptome sequencing were conducted as described in Huang et al. (2024). In brief, total RNA was extracted from cells with Trizol (Thermo Fisher, 15596018) or 100 µL EVs with Trizol LS (Thermo Fisher; 10296028). After homogenization, RNA was isolated using miRNeasy solutions (Qiagen, 217004) with Zymo‐Spin columns (Zymo Research, C1003‐50). RNA purity and concentrations were measured using Nanodrop (Thermo Scientific, Waltham, MA, USA, ND‐2000).
RNAs from cells (2,000 ng) and EVs (960 ng) was incubated with 1 U/µg RNase R (Lucigen, RNR07250) at 37°C, 30 min and purified by RNA Clean&Concentrator‐5 (Zymo Research, R1014). cDNA libraries (100 ng RNA, with/without RNase R) were made with “IDT for Illumina RNA UD” indices by Stranded Total RNA Prep Ligation w/Ribo‐Zero Plus (Illumina, 20072063). Yield/size distribution were assessed by Fragment Bioanalyzer (Agilent, DNA 1000, 5067‐1505). Multiplexed libraries were equally pooled to 2.5 nM and sequenced by NovaSeq 6000/S1 Reagent Kit version 1.5 (Illumina, 300 cycles; 20028401).
4.6. RT‐qPCR and Sanger Sequencing
Total RNA was extracted from cells or EVs by lysis in Trizol (Sigma, St. Louis, MO, USA, T9424) using the phenol‐chloroform method, following the manufacturer's protocol. RNA purity and concentrations were measured using Nanodrop (Thermo Scientific, Waltham, MA, USA, ND‐2000). Equal concentrations of RNA from cells and EVs were used for cDNA synthesis using iScript Reverse Transcription Supermix (Bio‐RAD, Hercules, CA, USA, 1708841), and gene expression was analysed using iTaq Universal SYBR Green Supermix (Bio‐RAD, Hercules, CA, USA, 1725124) according to the manufacturer's protocol. All of the experiments were performed in triplicates. CT values were used to calculate fold change (2−ΔΔCT) using Actin (ACTB) RNA as control (Schmittgen and Livak 2008). The p values were obtained using Student's t test. PCR products were visualized by agarose gel electrophoresis to confirm amplification and assess fragment size. Circular GFP (circGFP) amplicons from cellular and EVs fractions were purified using QIAEX II Gel Extraction Kit (Qiagen, Hilden, Germany, 20021) and sent for Sanger sequencing (Azenta Life Sciences, South Plainfield, NJ, USA). All the primer sequences used are provided in Table S1.
4.7. SPIRFISH Imaging
SPIRFISH (single‐particle protein and RNA analysis, combining single particle interferometric reflectance imaging sensor with single‐molecule fluorescence in situ hybridization) was performed as previously described (Troyer et al. 2024). Briefly, 45 uL of EVs diluted to 4E+8 particles/mL (based on NanoFCM measurement, detection range 45–180 nm) was incubated overnight on Leprechaun Exosome Human Tetraspanin Kit (Unchained Laboratories, #251‐1044). The following day, unbound particles were removed, fixed and permeabilized using ExoView Chip washer following cargo protocol with reagents from Unchained Laboratories, Leprechaun exosome cargo upgrade, #251‐1049. Chips were then incubated with fluorescent antibodies against Syntenin‐1 (from Cargo upgrade kit), and CD9 (from Tetraspanin kit), and 4 µL of smFISH probes (from 50 ng/µL smFISH probe stock for 1 h in the dark on a microplate shaker at 430 rpm at 37°C. After incubation, unbound antibodies were removed by additional washes and chips were dried and scanned interferometrically and fluorescently using the ExoView R100 instrument. All the smFISH probes used are provided in Table S2.
4.8. CircRNAs Analysis
For RNA‐Seq data: Quality control of RNA‐Seq data were performed using FastQC and MultiQC (Ewels et al. 2016). Data were aligned to human genome (hg38) using STAR 2.7.10b and circRNAs were identified using CircExplorer2 2.3.8 (Zhang et al. 2016; Dobin et al. 2013). CircRNA exon sequence coordinates were obtained based on all exon sequences in UCSC known gene annotations (v40) that overlap the circRNAs coordinates reported by circExplorer2 using GenomicFeatures 1.54.4 R package (Lawrence et al. 2013). To ensure the accuracy of circRNAs annotations, both start and end positions of circRNAs had to match an exon boundary in the annotations. Next, circRNAs sequences were extracted from human genome (hg38) using BSgenome 1.70.2 R package. When comparing the enrichment of circular and linear RNAs in EVs, Kallisto 0.44.0 was used to align the reads from RNase R‐treated samples to human genome (hg38) and these counts were compared to mRNA counts obtained from mock‐treated samples (Bray et al. 2016). For circRNAs in ExoRBase 2.0 and CircBase, transcripts with no stop codons were first discarded from UCSC known gene annotations (v40) then exons that intersect with circRNAs coordinates were obtained using GenomicFeatures 1.54.4 R package) (Glažar et al. 2014; Lai et al. 2022; Lawrence et al. 2013). Next, sequences were extracted similarly. For circRNAs quantification, number of forward‐splice (fsj) and back‐splice (bsj) junction reads were obtained using CIRIquant 1.1 with default parameters (Zhang et al. 2020). Then, the ratio of circular/linear RNAs were calculated as follows: 2 * bsj/(2 * bsj + fsj). Intron coverage information was obtained using CIRI‐AS 1.2 for all cells and EVs samples. Coverage of circRNAs of two more exons were calculated as follows: First and last exons coordinates were identified from Gencode v32 annotations and then these exons were scaled to 100 regions and mean coverage for each region was calculated. In case of circRNAs with more than 1 intron, all introns within circRNA coordinate were first concatenated, scaled to 100 regions and then processed as mentioned for exons.
4.9. Linear RNA Analysis
For all linear RNA analysis, control (no RNase R treatment) samples were used. First, Gencode v32 annotations was obtained and divided into three categories: mRNAs containing protein‐coding RNAs, lncRNAs containing long non‐coding RNAs and others containing all other transcripts. Next, Gencode v32 annotations were then used to further separate mRNA transcripts into 5’ UTR, CDS, and 3’UTR using GenomicFeatures 1.54.4 R package, and their sequences were obtained from human genome (hg38) using BSgenome 1.70.2 R package (Lawrence et al. 2013). Individual indexes were built for the three linear RNA groups from the extracted sequences using Kallisto 0.44.0 and reads were then aligned to those sequences (Bray et al. 2016). Counts were imported using tximport 1.30.0 R package and analysed for differential expression using DESeq2 1.42.1 R package (Love et al. 2014). ExoRBase sequences were obtained by first matching the gene ID from the database to that in Gencode v32 annotations and then extracting the sequences from human genome (hg38) using BSgenome 1.70.2 R package.
4.10. Differential Expression Analysis
Differential expression was performed using DESeq2 1.42.1 R package with default parameters (Love et al. 2014). RNAs were labelled as EVs‐enriched (EVE) if their adjusted p value (FDR) < 0.05 and fold change > 0, or as cell‐retained (CR) if FDR < 0.05 and fold change < 0, or as not significantly different (NS) otherwise.
4.11. Gene Ontology and KEGG Enrichment
Gene ontology enrichment analysis of EVs enriched mRNAs was performed using DAVID (Sherman et al. 2022), for biological process (BP).
4.12. Structure Parameters Analysis
RNAfold 2.4.13 from ViennaRNA package was used to calculate the minimum free energy (ΔG) of RNAs which was normalized to the length of RNAs (−ΔG/nt) (Lorenz et al. 2011). The “–circ” option was used for circRNAs or to calculate (−ΔG/nt) of linear sequence in circularization experiment. Due to size limitation of RNAfold, sequences bigger than 32,767 nt were not included in the analysis. RNA‐fold output was then used to calculate other parameters including maximum ladder distance (MLD), number of stems (SL), number of multi‐loops of order 3 or higher (ML), number of base pairs (BP) and 90th percentile of base pair distances (BP90). MLD, BP and BP90 were calculated using custom script in python while SL and ML were calculated using bpRNA (Danaee et al. 2018).
4.13. Prediction of RNA Enrichment
Random forest model was implemented using randomForest 4.7‐1.2 R package using default parameters for classification of EVs enrichment of RNAs. All RNA groups were split into training and test sets, with 80% allocated for training and 20% for testing. Synthetic Minority Over‐sampling Technique (SMOTE) was applied to address class imbalance for the EV enriched class (Chawla et al. 2002). Number of variables randomly sampled as candidates at each split (mtry) was optimized using 10‐fold cross validation using caret 7.0‐1 R package. Model's performance was evaluated on the held‐out test set using receiver operating characteristic (ROC) curves and their corresponding Area Under the Curve (AUC) values. AUC curves were generated using ggplot2 3.5.1 R package. Feature importance was assessed using mean decrease in Gini.
4.14. Protein Abundance
Cells were collected and rinsed three times with cold PBS, and then lysed with SDS buffer (5% SDS, 100 mM Tris‐HCl, pH = 8). The lysate was digested using E3filter (CDS Analytical, Oxford, PA, USA) as described previously (Martin et al. 2024). The digests were desalted using C18 based StageTips, dried in SpeedVac, and stored under −80°C before further analysis. The peptides were analyzed on an Ultimate 3000 RSLCnano system in conjunction with an Orbitrap Eclipse mass spectrometer and FAIMS Pro Interface (Thermo Scientific) following a method published previously (Martin et al. 2024). For data‐independent acquisition (DIA) and FAIMS settings, we adapted a protocol reported in a previous paper (Elsayyid et al. 2025). The DIA mass spec data were processed using Spectronaut software (version 19.1) with most of the default settings (Bruderer et al. 2015). Briefly, a library‐free DIA analysis workflow with directDIA+ and an UniProt human protein database (82,861 sequences; version July 2024) were used. The settings for Pulsar and library generation include: Trypsin/P as specific enzyme; peptide length from 7 to 52 amino acids; allowing two missed cleavages; toggle N‐terminal M is true; Carbamidomethyl on C as fixed modification; Oxidation on M and Acetyl at protein N‐terminus as variable modifications; FDRs at PSM, peptide and protein level all set to 0.01. Next, the output intensity‐based absolute quantification (iBAQ) values from the protein quantity report were correlated with TPM values for mRNAs from Kallisto 0.44.0 (Bray et al. 2016).
Author Contributions
Ahmed Abdelgawad: investigation, data curation, formal analysis, methodology, writing – review and editing. Yiyao Huang: resources, methodology, data curation, writing – review and editing. Olesia Gololobova: resources, methodology, data curation, writing – review and editing. Yanbao Yu: resources, methodology, data curation, writing – review and editing. Kenneth W. Witwer: supervision, writing – review and editing. Vijay Parashar: funding acquisition, writing – review and editing. Mona Batish: conceptualization, supervision, formal analysis, funding acquisition, project administration, writing – review and editing
Conflicts of Interest
Y.Y. is a named inventor on a patent application (PCT/US2023/020215) for the E3filters used in this study. K.W.W. is or has been an advisory board member of ShiftBio, Exopharm, NeuroDex, NovaDip, and ReNeuron; holds stock options with NeuroDex; and privately consults as Kenneth Witwer Consulting. The authors declare no conflicts of interest. The funders had no role in the design of the study; in the collection, analyses, or interpretation of data; in the writing of the manuscript; or in the decision to publish the results.
Supporting information
Supplementary Tables: jev270113‐sup‐0001‐TableS1‐S2.docx
Acknowledgements
We would like to thank the members of Batish Laboratory for their discussion and support. We also acknowledge Dr. Shawn Polson and Jaysheel Bhavsar from center for Bioinformatics for their help. We thank the support from the University of Delaware Bioinformatics Data Science Core Facility (RRID:SCR_017696) including use of the BIOMIX and BioStore computational resources that was made possible through funding from Delaware INBRE (NIGMS P20GM103446), NIH Shared Instrumentation Grant (NIH S10OD028725), the State of Delaware, and the Delaware Biotechnology Institute.
Funding: This research was funded by National Science Foundation, grant number 2244127 and Delaware Bioscience Center for Advanced Technology funds to M.B. and V.P. The authors would like to acknowledge support from Ionis Pharmaceuticals (to K.W.W. and M.B.) and the Paul G. Allen Frontiers Foundation (to K.W.W.).
Data Availability Statement
Sequencing data were deposited in GEO (GSE279376).
References
- Abels, E. R. , Maas S. L. N., Nieland L., et al. 2019. “Glioblastoma‐Associated Microglia Reprogramming Is Mediated by Functional Transfer of Extracellular miR‐21.” Cell Reports 28: 3105–3119.e7. [DOI] [PMC free article] [PubMed] [Google Scholar]
- Albanese, M. , Chen Y.‐F. A., Hüls C., et al. 2021. “MicroRNAs Are Minor Constituents of Extracellular Vesicles That Are Rarely Delivered to Target Cells.” PLOS Genetics 17: e1009951. [DOI] [PMC free article] [PubMed] [Google Scholar]
- Allegra, A. , Cicero N., Tonacci A., Musolino C., and Gangemi S.. 2022. “Circular RNA as a Novel Biomarker for Diagnosis and Prognosis and Potential Therapeutic Targets in Multiple Myeloma.” Cancers (Basel) 14: 1700. [DOI] [PMC free article] [PubMed] [Google Scholar]
- Almeida, A. , Gabriel M., Firlej V., et al. 2022. “Urinary Extracellular Vesicles Contain Mature Transcriptome Enriched in Circular and Long Noncoding RNAs With Functional Significance in Prostate Cancer.” Journal of Extracellular Vesicles 11: e12210. [DOI] [PMC free article] [PubMed] [Google Scholar]
- Arora, A. , Castro‐Gutierrez R., Moffatt C., et al. 2022. “High‐Throughput Identification of RNA Localization Elements in Neuronal Cells.” Nucleic Acids Research 50: 10626–10642. [DOI] [PMC free article] [PubMed] [Google Scholar]
- Assmann, S. M. , Chou H.‐L., and Bevilacqua P. C.. 2023. “Rock, Scissors, Paper: How RNA Structure Informs Function.” Plant Cell 35: 1671–1707. [DOI] [PMC free article] [PubMed] [Google Scholar]
- Bao, L. , You B., Shi S., et al. 2018. “Metastasis‐Associated miR‐23a From Nasopharyngeal Carcinoma‐Derived Exosomes Mediates Angiogenesis by Repressing a Novel Target Gene TSGA10.” Oncogene 37: 2873–2889. [DOI] [PMC free article] [PubMed] [Google Scholar]
- Barreiro, K. , Dwivedi O. P., Leparc G., et al. 2020. “Comparison of Urinary Extracellular Vesicle Isolation Methods for Transcriptomic Biomarker Research in Diabetic Kidney Disease.” Journal of Extracellular Vesicles 10: e12038. [DOI] [PMC free article] [PubMed] [Google Scholar]
- Batish, M. , van den Bogaard P., Kramer F. R., and Tyagi S.. 2012. “Neuronal mRNAs Travel Singly Into Dendrites.” PNAS 109: 4645–4650. [DOI] [PMC free article] [PubMed] [Google Scholar]
- Bellaousov, S. , Reuter J. S., Seetin M. G., and Mathews D. H.. 2013. “RNAstructure: Web Servers for RNA Secondary Structure Prediction and Analysis.” Nucleic Acids Research 41: W471–474. [DOI] [PMC free article] [PubMed] [Google Scholar]
- Bolukbasi, M. F. , Mizrak A., Ozdener G. B., et al. 2012. “miR‐1289 and “Zipcode”‐Like Sequence Enrich mRNAs in Microvesicles.” Molecular Therapy—Nucleic Acids 1: e10. [DOI] [PMC free article] [PubMed] [Google Scholar]
- Bray, N. L. , Pimentel H., Melsted P., and Pachter L.. 2016. “Near‐Optimal Probabilistic RNA‐Seq Quantification.” Nature Biotechnology 34: 525–527. [DOI] [PubMed] [Google Scholar]
- Bruderer, R. , Bernhardt O. M., Gandhi T., et al. 2015. “Extending the Limits of Quantitative Proteome Profiling With Data‐Independent Acquisition and Application to Acetaminophen‐Treated Three‐Dimensional Liver Microtissues.” Molecular & Cellular Proteomics 14: 1400–1410. [DOI] [PMC free article] [PubMed] [Google Scholar]
- Busa, V. F. , Favorov A. V., Fertig E. J., and Leung A. K. L.. 2021. “Spatial Correlation Statistics Enable Transcriptome‐Wide Characterization of RNA Structure Binding.” Cell Reports Methods 1, no. 6: 100088. [DOI] [PMC free article] [PubMed] [Google Scholar]
- Bushhouse, D. Z. , Choi E. K., Hertz L. M., and Lucks J. B.. 2022. “How Does RNA Fold Dynamically?” Journal of Molecular Biology 434: 167665. [DOI] [PMC free article] [PubMed] [Google Scholar]
- Cao, X. , Zhang Y., Ding Y., and Wan Y.. 2024. “Identification of RNA Structures and Their Roles in RNA Functions.” Nature Reviews Molecular Cell Biology 25: 784–801. [DOI] [PubMed] [Google Scholar]
- Chawla, N. V. , Bowyer K. W., Hall L. O., and Kegelmeyer W. P.. 2002. “SMOTE: Synthetic Minority Over‐Sampling Technique.” Jair 16: 321–357. [Google Scholar]
- Chekulaeva, M. 2024. “Mechanistic Insights Into the Basis of Widespread RNA Localization.” Nature Cell Biology 26: 1037–1046. [DOI] [PubMed] [Google Scholar]
- Chen, R. , Shi Y., Fang N., et al. 2024. “Bronchoalveolar Lavage Fluid Analysis in Patients With Checkpoint Inhibitor Pneumonitis.” Cancer Immunology, Immunotherapy 73: 235. [DOI] [PMC free article] [PubMed] [Google Scholar]
- Chen, Y. , Yao L., Tang Y., et al. 2022. “CircNet 2.0: An Updated Database for Exploring Circular RNA Regulatory Networks in Cancers.” Nucleic Acids Research 50: D93–D101. [DOI] [PMC free article] [PubMed] [Google Scholar]
- Choudhary, K. , Lai Y.‐H., Tran E. J., and Aviran S.. 2019. “dStruct: Identifying Differentially Reactive Regions From RNA Structurome Profiling Data.” Genome biology 20: 40. [DOI] [PMC free article] [PubMed] [Google Scholar]
- Clote, P. , Ferré F., Kranakis E., and Krizanc D.. 2005. “Structural RNA Has Lower Folding Energy Than Random RNA of the Same Dinucleotide Frequency.” RNA 11: 578–591. [DOI] [PMC free article] [PubMed] [Google Scholar]
- Consortium, E. V.‐T. , Van Deun J., Mestdagh P., et al. 2017. “EV‐TRACK: Transparent Reporting and Centralizing Knowledge in Extracellular Vesicle Research.” Nature Methods 14: 228–232. [DOI] [PubMed] [Google Scholar]
- Danaee, P. , Rouches M., Wiley M., Deng D., Huang L., and Hendrix D.. 2018. “bpRNA: Large‐Scale Automated Annotation and Analysis of RNA Secondary Structure.” Nucleic Acids Research 46: 5381–5394. [DOI] [PMC free article] [PubMed] [Google Scholar]
- Ding, G. , Zhou L., Qian Y., et al. 2015. “Pancreatic Cancer‐Derived Exosomes Transfer miRNAs to Dendritic Cells and Inhibit RFXAP Expression via miR‐212‐3p.” Oncotarget 6: 29877–29888. [DOI] [PMC free article] [PubMed] [Google Scholar]
- Ding, Y. , Ding N., Zhang Y., et al. 2021. “MicroRNA‐222 Transferred From Semen Extracellular Vesicles Inhibits Sperm Apoptosis by Targeting BCL2L11.” Frontiers in Cell and Developmental Biology 9: 736864. [DOI] [PMC free article] [PubMed] [Google Scholar]
- Dobin, A. , Davis C. A., Schlesinger F., et al. 2013. “STAR: Ultrafast Universal RNA‐Seq Aligner.” Bioinformatics 29: 15–21. [DOI] [PMC free article] [PubMed] [Google Scholar]
- Dominguez, D. , Freese P., Alexis M. S., et al. 2018. “Sequence, Structure, and Context Preferences of Human RNA Binding Proteins.” Molecular Cell 70: 854–867.e9. [DOI] [PMC free article] [PubMed] [Google Scholar]
- Elsayyid, M. , Tanis J. E., and Yu Y.. 2025. “ Simple In‐Cell Processing Enables Deep Proteome Analysis of Low‐Input Caenorhabditis elegans .” Analytical Chemistry 97: 9159–9167. [DOI] [PMC free article] [PubMed] [Google Scholar]
- Ewels, P. , Magnusson M., Lundin S., and Käller M.. 2016. “MultiQC: Summarize Analysis Results for Multiple Tools and Samples in a Single Report.” Bioinformatics 32: 3047–3048. [DOI] [PMC free article] [PubMed] [Google Scholar]
- Fabbiano, F. , Corsi J., Gurrieri E., Trevisan C., Notarangelo M., and D'Agostino V. G.. 2020. “RNA Packaging Into Extracellular Vesicles: An Orchestra of RNA‐Binding Proteins?” Journal of Extracellular Vesicles 10: e12043. [DOI] [PMC free article] [PubMed] [Google Scholar]
- Fischer, J. W. , Busa V. F., Shao Y., and Leung A. K. L.. 2020. “Structure‐Mediated RNA Decay by UPF1 and G3BP1.” Molecular Cell 78: 70–84.e6. [DOI] [PMC free article] [PubMed] [Google Scholar]
- Garcia‐Martin, R. , Wang G., Brandão B. B., et al. 2022. “MicroRNA Sequence Codes for Small Extracellular Vesicle Release and Cellular Retention.” Nature 601: 446–451. [DOI] [PMC free article] [PubMed] [Google Scholar]
- Giudice, G. , Sánchez‐Cabo F., Torroja C., and Lara‐Pezzi E.. 2016. “ATtRACT—A Database of RNA‐Binding Proteins and Associated Motifs.” Database 2016: baw035. [DOI] [PMC free article] [PubMed] [Google Scholar]
- Glažar, P. , Papavasileiou P., and Rajewsky N.. 2014. “circBase: A Database for Circular RNAs.” RNA 20: 1666–1670. [DOI] [PMC free article] [PubMed] [Google Scholar]
- Guarnerio, J. , Zhang Y., Cheloni G., et al. 2019. “Intragenic Antagonistic Roles of Protein and circRNA in Tumorigenesis.” Cell Research 29: 628–640. [DOI] [PMC free article] [PubMed] [Google Scholar]
- Guo, Y. , Wei X., and Peng Y.. 2020. “Structure‐Mediated Degradation of CircRNAs.” Trends in Cell Biology 30: 501–503. [DOI] [PubMed] [Google Scholar]
- Gurung, S. , Perocheau D., Touramanidou L., and Baruteau J.. 2021. “The Exosome Journey: From Biogenesis to Uptake and Intracellular Signalling.” Cell Communication and Signaling 19: 47. [DOI] [PMC free article] [PubMed] [Google Scholar]
- Hamilton, R. S. , and Davis I.. 2007. “RNA Localization Signals: Deciphering the Message With Bioinformatics.” Seminars in Cell & Developmental Biology 18: 178–185. [DOI] [PMC free article] [PubMed] [Google Scholar]
- Han, Z. , Chen H., Guo Z., et al. 2022. “Circular RNAs and Their Role in Exosomes.” Frontiers in Oncology 12: 848341. [DOI] [PMC free article] [PubMed] [Google Scholar]
- Harmati, M. , Gyukity‐Sebestyen E., Dobra G., et al. 2019. “Small Extracellular Vesicles Convey the Stress‐Induced Adaptive Responses of Melanoma Cells.” Scientific Reports 9: 15329. [DOI] [PMC free article] [PubMed] [Google Scholar]
- He, L. , Ping F., Fan Z., et al. 2020. “Salivary Exosomal miR‐24‐3p Serves as a Potential Detective Biomarker for Oral Squamous Cell Carcinoma Screening.” Biomedicine & Pharmacotherapy 121: 109553. [DOI] [PubMed] [Google Scholar]
- Huang, Y. , Abdelgawad A., Turchinovich A., et al. 2024. “RNA Landscapes of Brain and Brain‐Derived Extracellular Vesicles in Simian Immunodeficiency Virus Infection and Central Nervous System Pathology.” Journal of Infectious Diseases 229: 1295–1305. [DOI] [PMC free article] [PubMed] [Google Scholar]
- Huang, Y. , Cheng L., Turchinovich A., et al. 2020. “Influence of Species and Processing Parameters on Recovery and Content of Brain Tissue‐Derived Extracellular Vesicles.” Journal of Extracellular Vesicles 9: 1785746. [DOI] [PMC free article] [PubMed] [Google Scholar]
- Jankowsky, E. , and Harris M. E.. 2015. “Specificity and Nonspecificity in RNA‐Protein Interactions.” Nature Reviews Molecular Cell Biology 16: 533–544. [DOI] [PMC free article] [PubMed] [Google Scholar]
- Jarnuczak, A. F. , Najgebauer H., Barzine M., et al. 2021. “An Integrated Landscape of Protein Expression in Human Cancer.” Scientific Data 8: 115. [DOI] [PMC free article] [PubMed] [Google Scholar]
- Jiang, T. , Xia Y., Lv J., et al. 2021. “A Novel Protein Encoded by circMAPK1 Inhibits Progression of Gastric Cancer by Suppressing Activation of MAPK Signaling.” Molecular Cancer 20: 66. [DOI] [PMC free article] [PubMed] [Google Scholar]
- Kenneweg, F. , Bang C., Xiao K., et al. 2019. “Long Noncoding RNA‐Enriched Vesicles Secreted by Hypoxic Cardiomyocytes Drive Cardiac Fibrosis.” Molecular Therapy Nucleic Acids 18: 363–374. [DOI] [PMC free article] [PubMed] [Google Scholar]
- Kontos, C. K. , Karousi P., Artemaki P. I., et al. 2023. “Novel Circular RNAs of the Apoptosis‐Related BAX and BCL2L12 Genes Identified in a Chronic Lymphocytic Leukemia Cell Line Using Nanopore Sequencing.” FEBS Open Bio 13: 1953–1966. [DOI] [PMC free article] [PubMed] [Google Scholar]
- Koppula, A. , Abdelgawad A., Guarnerio J., Batish M., and Parashar V.. 2022. “CircFISH: A Novel Method for the Simultaneous Imaging of Linear and Circular RNAs.” Cancers (Basel) 14: 428. [DOI] [PMC free article] [PubMed] [Google Scholar]
- Kristensen, L. S. , Andersen M. S., Stagsted L. V. W., Ebbesen K. K., Hansen T. B., and Kjems J.. 2019. “The Biogenesis, Biology and Characterization of Circular RNAs.” Nature Reviews Genetics 20: 675–691. [DOI] [PubMed] [Google Scholar]
- Lai, H. , Li Y., Zhang H., et al. 2022. “exoRBase 2.0: An Atlas of mRNA, lncRNA and circRNA in Extracellular Vesicles From Human Biofluids.” Nucleic Acids Research 50: D118–D128. [DOI] [PMC free article] [PubMed] [Google Scholar]
- Lasda, E. , and Parker R.. 2016. “Circular RNAs Co‐Precipitate With Extracellular Vesicles: A Possible Mechanism for circRNA Clearance.” PLOS ONE 11: e0148407. [DOI] [PMC free article] [PubMed] [Google Scholar]
- Lawrence, M. , Huber W., Pagès H., et al. 2013. “Software for Computing and Annotating Genomic Ranges.” PLOS Computational Biology 9: e1003118. [DOI] [PMC free article] [PubMed] [Google Scholar]
- Legnini, I. , Di Timoteo G., Rossi F., et al. 2017. “Circ‐ZNF609 Is a Circular RNA That Can Be Translated and Functions in Myogenesis.” Molecular Cell 66: 22–37.e9. [DOI] [PMC free article] [PubMed] [Google Scholar]
- Leidal, A. M. , and Debnath J.. 2020. “Unraveling the Mechanisms That Specify Molecules for Secretion in Extracellular Vesicles.” Methods (San Diego, Calif.) 177: 15–26. [DOI] [PMC free article] [PubMed] [Google Scholar]
- Li, H. , Xie M., Wang Y., Yang L., Xie Z., and Wang H.. 2021. “riboCIRC: A Comprehensive Database of Translatable circRNAs.” Genome Biology 22: 79. [DOI] [PMC free article] [PubMed] [Google Scholar]
- Li, Y. , Zheng Q., Bao C., et al. 2015. “Circular RNA Is Enriched and Stable in Exosomes: A Promising Biomarker for Cancer Diagnosis.” Cell Research 25: 981–984. [DOI] [PMC free article] [PubMed] [Google Scholar]
- Lin, S. , Xiong W., Liu H., Pei L., Yi H., and Guan Y.. 2020. “Profiling and Integrated Analysis of Differentially Expressed Circular RNAs in Plasma Exosomes as Novel Biomarkers for Advanced‐Stage Lung Adenocarcinoma.” Onco Targets Therapy 13: 12965–12977. [DOI] [PMC free article] [PubMed] [Google Scholar]
- Liu, X.‐M. , Ma L., and Schekman R.. 2021. “Selective Sorting of microRNAs Into Exosomes by Phase‐Separated YBX1 Condensates.” eLife 10: e71982. [DOI] [PMC free article] [PubMed] [Google Scholar]
- Lorenz, R. , Bernhart S. H., Höner Zu Siederdissen C., et al. 2011. “ViennaRNA Package 2.0.” Algorithms for Molecular Biology 6: 26. [DOI] [PMC free article] [PubMed] [Google Scholar]
- Love, M. I. , Huber W., and Anders S.. 2014. “Moderated Estimation of Fold Change and Dispersion for RNA‐seq Data With DESeq2.” Genome Biology 15: 550. [DOI] [PMC free article] [PubMed] [Google Scholar]
- Low, J. T. , and Weeks K. M.. 2010. “SHAPE‐Directed RNA Secondary Structure Prediction.” Methods (San Diego, Calif.) 52: 150–158. [DOI] [PMC free article] [PubMed] [Google Scholar]
- Martin, K. C. , and Ephrussi A.. 2009. “mRNA Localization: Gene Expression in the Spatial Dimension.” Cell 136: 719–730. [DOI] [PMC free article] [PubMed] [Google Scholar]
- Martin, K. R. , Le H. T., Abdelgawad A., et al. 2024. “Development of an Efficient, Effective, and Economical Technology for Proteome Analysis.” Cell Reports Methods 4: 100796. [DOI] [PMC free article] [PubMed] [Google Scholar]
- Mortimer, S. A. , Trapnell C., Aviran S., Pachter L., and Lucks J. B.. 2012. “SHAPE‐Seq: High‐Throughput RNA Structure Analysis.” Current Protocols in Chemical Biology 4: 275–297. [DOI] [PubMed] [Google Scholar]
- Mukherjee, K. , Ghoshal B., Ghosh S., et al. 2016. “Reversible HuR‐microRNA Binding Controls Extracellular Export of miR‐122 and Augments Stress Response.” EMBO Reports 17: 1184–1203. [DOI] [PMC free article] [PubMed] [Google Scholar]
- Ngue, H. , Shrestha J., Kim H., and Vasudevan S.. 2023. “Abstract 3789: Circular RNA Expression Is Enriched in Breast Cancer Extracellular Vesicles and Is Associated With Chemotherapy Resistance.” Cancer Research 83: 3789. [Google Scholar]
- O'Grady, T. , Njock M.‐S., Lion M., et al. 2022. “Sorting and Packaging of RNA Into Extracellular Vesicles Shape Intracellular Transcript Levels.” BMC Biology 20: 72. [DOI] [PMC free article] [PubMed] [Google Scholar]
- Oka, Y. , Tanaka K., and Kawasaki Y.. 2023. “A Novel Sorting Signal for RNA Packaging Into Small Extracellular Vesicles.” Scientific Reports 13: 17436. [DOI] [PMC free article] [PubMed] [Google Scholar]
- Ong, S.‐G. , Lee W. H., Huang M., et al. 2014. “Cross Talk of Combined Gene and Cell Therapy in Ischemic Heart Disease.” Circulation 130: S60–S69. [DOI] [PMC free article] [PubMed] [Google Scholar]
- Pérez‐Boza, J. , Lion M., and Struman I.. 2018. “Exploring the RNA Landscape of Endothelial Exosomes.” RNA 24: 423–435. [DOI] [PMC free article] [PubMed] [Google Scholar]
- Peter, M. R. , Zhao F., Jeyapala R., et al. 2021. “Investigating Urinary Circular RNA Biomarkers for Improved Detection of Renal Cell Carcinoma.” Frontiers in Oncology 11: 814228. [DOI] [PMC free article] [PubMed] [Google Scholar]
- Pitt, J. M. , Kroemer G., and Zitvogel L.. 2016. “Extracellular Vesicles: Masters of Intercellular Communication and Potential Clinical Interventions.” Journal of Clinical Investigation 126: 1139–1143. [DOI] [PMC free article] [PubMed] [Google Scholar]
- Prieto‐Vila, M. , Yoshioka Y., and Ochiya T.. 2021. “Biological Functions Driven by mRNAs Carried by Extracellular Vesicles in Cancer.” Frontiers in Cell and Developmental Biology 9: 620498. [DOI] [PMC free article] [PubMed] [Google Scholar]
- Radecki, P. , Ledda M., and Aviran S.. 2018. “Automated Recognition of RNA Structure Motifs by Their SHAPE Data Signatures.” Genes (Basel) 9: 300. [DOI] [PMC free article] [PubMed] [Google Scholar]
- Raimondo, S. , Urzì O., Conigliaro A., et al. 2020. “Extracellular Vesicle MicroRNAs Contribute to the Osteogenic Inhibition of Mesenchymal Stem Cells in Multiple Myeloma.” Cancers (Basel) 12: 449. [DOI] [PMC free article] [PubMed] [Google Scholar]
- Rodosthenous, R. S. , Hutchins E., Reiman R., et al. 2020. “Profiling Extracellular Long RNA Transcriptome in Human Plasma and Extracellular Vesicles for Biomarker Discovery.” iScience 23: 101182. [DOI] [PMC free article] [PubMed] [Google Scholar]
- Santangelo, L. , Giurato G., Cicchini C., et al. 2016. “The RNA‐Binding Protein SYNCRIP Is a Component of the Hepatocyte Exosomal Machinery Controlling MicroRNA Sorting.” Cell Reports 17: 799–808. [DOI] [PubMed] [Google Scholar]
- Schmittgen, T. D. , and Livak K. J.. 2008. “Analyzing Real‐Time PCR Data by the Comparative C(T) Method.” Nature Protocols 3: 1101–1108. [DOI] [PubMed] [Google Scholar]
- Schwanhäusser, B. , Busse D., Li N., et al. 2011. “Global Quantification of Mammalian Gene Expression Control.” Nature 473: 337–342. [DOI] [PubMed] [Google Scholar]
- Sherman, B. T. , Hao M., Qiu J., et al. 2022. “DAVID: A Web Server for Functional Enrichment Analysis and Functional Annotation of Gene Lists (2021 Update).” Nucleic Acids Research 50: W216–W221. [DOI] [PMC free article] [PubMed] [Google Scholar]
- Shi, H. , Zhou Y., Jia E., Pan M., Bai Y., and Ge Q.. 2021. “Bias in RNA‐seq Library Preparation: Current Challenges and Solutions.” BioMed Research International 2021: 6647597. [DOI] [PMC free article] [PubMed] [Google Scholar]
- Shurtleff, M. J. , Temoche‐Diaz M. M., Karfilis K. V., Ri S., and Schekman R.. 2016. “Y‐Box Protein 1 Is Required to Sort microRNAs Into Exosomes in Cells and in a Cell‐Free Reaction.” eLife 5: e19276. [DOI] [PMC free article] [PubMed] [Google Scholar]
- Strobel, E. J. , Yu A. M., and Lucks J. B.. 2018. “High‐Throughput Determination of RNA Structures.” Nature Reviews Genetics 19: 615–634. [DOI] [PMC free article] [PubMed] [Google Scholar]
- Szostak, N. , Royo F., Rybarczyk A., et al. 2014. “Sorting Signal Targeting mRNA Into Hepatic Extracellular Vesicles.” RNA Biology 11: 836–844. [DOI] [PMC free article] [PubMed] [Google Scholar]
- Tang, Y.‐T. , Huang Y.‐Y., Zheng L., et al. 2017. “Comparison of Isolation Methods of Exosomes and Exosomal RNA From Cell Culture Medium and Serum.” International Journal of Molecular Medicine 40: 834–844. [DOI] [PMC free article] [PubMed] [Google Scholar]
- Théry, C. , Witwer K. W., Aikawa E., et al. 2018. “Minimal Information for Studies of Extracellular Vesicles 2018 (MISEV2018): A Position Statement of the International Society for Extracellular Vesicles and Update of the MISEV2014 Guidelines.” Journal of Extracellular Vesicles 7: 1535750. [DOI] [PMC free article] [PubMed] [Google Scholar]
- Troyer, Z. , Gololobova O., Koppula A., et al. 2024. “Simultaneous Protein and RNA Analysis in Single Extracellular Vesicles, Including Viruses.” ACS Nano 18: 26568–26584. [DOI] [PMC free article] [PubMed] [Google Scholar]
- Vaka, R. , Parent S., Risha Y., et al. 2023. “Extracellular Vesicle microRNA and Protein Cargo Profiling in Three Clinical‐Grade Stem Cell Products Reveals Key Functional Pathways.” Molecular Therapy Nucleic Acids 32: 80–93. [DOI] [PMC free article] [PubMed] [Google Scholar]
- Valadi, H. , Ekström K., Bossios A., Sjöstrand M., Lee J. J., and Lötvall J. O.. 2007. “Exosome‐Mediated Transfer of mRNAs and microRNAs Is a Novel Mechanism of Genetic Exchange Between Cells.” Nature Cell Biology 9: 654–659. [DOI] [PubMed] [Google Scholar]
- van Heesch, S. , Witte F., Schneider‐Lunitz V., et al. 2019. “The Translational Landscape of the Human Heart.” Cell 178: 242–260.e29. [DOI] [PubMed] [Google Scholar]
- Verduci, L. , Tarcitano E., Strano S., Yarden Y., and Blandino G.. 2021. “CircRNAs: Role in Human Diseases and Potential Use as Biomarkers.” Cell Death & Disease 12: 468. [DOI] [PMC free article] [PubMed] [Google Scholar]
- Villarroya‐Beltri, C. , Gutiérrez‐Vázquez C., Sánchez‐Cabo F., et al. 2013. “Sumoylated hnRNPA2B1 Controls the Sorting of miRNAs Into Exosomes Through Binding to Specific Motifs.” Nature Communications 4: 1–10. [DOI] [PMC free article] [PubMed] [Google Scholar]
- Viñas, J. L. , Burger D., Zimpelmann J., et al. 2016. “Transfer of microRNA‐486‐5p From Human Endothelial Colony Forming Cell–Derived Exosomes Reduces Ischemic Kidney Injury.” Kidney International 90: 1238–1250. [DOI] [PubMed] [Google Scholar]
- Vincent, H. A. , and Deutscher M. P.. 2006. “Substrate Recognition and Catalysis by the Exoribonuclease RNase R *.” Journal of Biological Chemistry 281: 29769–29775. [DOI] [PubMed] [Google Scholar]
- Wang, L. , Xu G.‐E., Spanos M., et al. 2023. “Circular RNAs in Cardiovascular Diseases: Regulation and Therapeutic Applications.” Research (Wash D C) 6: 0038. [DOI] [PMC free article] [PubMed] [Google Scholar]
- Wang, M. , Yu F., Li P., and Wang K.. 2020. “Emerging Function and Clinical Significance of Exosomal circRNAs in Cancer.” Molecular Therapy Nucleic Acids 21: 367–383. [DOI] [PMC free article] [PubMed] [Google Scholar]
- Wang, Y. , Liu J., Ma J., et al. 2019. “Exosomal CircRNAs: Biogenesis, Effect and Application in Human Diseases.” Molecular Cancer 18: 116. [DOI] [PMC free article] [PubMed] [Google Scholar]
- Welsh, J. A. , Goberdhan D. C. I., O'Driscoll L., et al. 2024. “Minimal Information for Studies of Extracellular Vesicles (MISEV2023): From Basic to Advanced Approaches.” Journal of Extracellular Vesicles 13: e12404. [DOI] [PMC free article] [PubMed] [Google Scholar]
- Xiao, M.‐S. , and Wilusz J. E.. 2019. “An Improved Method for Circular RNA Purification Using RNase R That Efficiently Removes Linear RNAs Containing G‐Quadruplexes or Structured 3' Ends.” Nucleic Acids Research 47: 8755–8769. [DOI] [PMC free article] [PubMed] [Google Scholar]
- Xin, R. , Gao Y., Gao Y., et al. 2021. “isoCirc Catalogs Full‐Length Circular RNA Isoforms in Human Transcriptomes.” Nature Communications 12: 266. [DOI] [PMC free article] [PubMed] [Google Scholar]
- Yáñez‐Mó, M. , Siljander P. R.‐M., Andreu Z., et al. 2015. “Biological Properties of Extracellular Vesicles and Their Physiological Functions.” Journal of Extracellular Vesicles 4: 27066. [DOI] [PMC free article] [PubMed] [Google Scholar]
- Zhang, J. , Chen S., Yang J., and Zhao F.. 2020. “Accurate Quantification of Circular RNAs Identifies Extensive Circular Isoform Switching Events.” Nature Communications 11: 90. [DOI] [PMC free article] [PubMed] [Google Scholar]
- Zhang, J. , Zhang X., Li C., et al. 2019. “Circular RNA Profiling Provides Insights Into Their Subcellular Distribution and Molecular Characteristics in HepG2 Cells.” RNA Biology 16: 220–232. [DOI] [PMC free article] [PubMed] [Google Scholar]
- Zhang, X.‐O. , Dong R., Zhang Y., et al. 2016. “Diverse Alternative Back‐Splicing and Alternative Splicing Landscape of Circular RNAs.” Genome Research 26: 1277–1287. [DOI] [PMC free article] [PubMed] [Google Scholar]
- Zhang, Y. , Wang J., and Xiao Y.. 2022. “3dRNA: 3D Structure Prediction From Linear to Circular RNAs.” Journal of Molecular Biology 434: 167452. [DOI] [PubMed] [Google Scholar]
- Zhao, J. , Li Q., Hu J., et al. 2024. “Circular RNA Landscape in Extracellular Vesicles From Human Biofluids.” Genome Medicine 16: 126. [DOI] [PMC free article] [PubMed] [Google Scholar]
- Zhou, W.‐Y. , Cai Z.‐R., Liu J., Wang D.‐S., Ju H.‐Q., and Xu R.‐H.. 2020. “Circular RNA: Metabolism, Functions and Interactions With Proteins.” Molecular Cancer 19: 172. [DOI] [PMC free article] [PubMed] [Google Scholar]
- Zhu, K. , Zhan H., Peng Y., et al. 2020. “Plasma hsa_circ_0027089 Is a Diagnostic Biomarker for Hepatitis B Virus‐Related Hepatocellular Carcinoma.” Carcinogenesis 41: 296–302. [DOI] [PMC free article] [PubMed] [Google Scholar]
- Zuker, M. 2003. “Mfold Web Server for Nucleic Acid Folding and Hybridization Prediction.” Nucleic Acids Research 31: 3406–3415. [DOI] [PMC free article] [PubMed] [Google Scholar]
Associated Data
This section collects any data citations, data availability statements, or supplementary materials included in this article.
Supplementary Materials
Supplementary Tables: jev270113‐sup‐0001‐TableS1‐S2.docx
Data Availability Statement
Sequencing data were deposited in GEO (GSE279376).