Abstract
In the primary auditory cortex (AI), the development of tone frequency selectivity and tonotopic organization is influenced by patterns of neural activity. Introduction of synchronous inputs into the auditory pathway achieved by exposing rat pups to pulsed white noise at a moderate intensity during P9–P28 resulted in a disrupted tonotopicity and degraded frequency-response selectivity for neurons in the adult AI. The latter was manifested by broader-than-normal tuning curves, multipeaks, and discontinuous, tone-evoked responses within AI-receptive fields. These effects correlated with the severe impairment of normal, developmental sharpening, and refinement of receptive fields and tonotopicity. In addition, paradoxically weaker than normal temporal correlations between the discharges of nearby AI neurons were recorded in exposed rats. In contrast, noise exposure of rats older than P30 did not cause significant change of auditory cortical maps. Thus, patterned auditory inputs appear to play a crucial role in shaping neuronal processing/decoding circuits in the primary auditory cortex during a critical period.
Spontaneously generated and/or externally driven neuronal activity is believed to play an instructive role in sculpting the intricate circuits of the developing nervous system from initially more imprecise neuronal connections (1–3). The correlations between the spatiotemporal structures of sensory inputs and the development of cortical feature-selective organizations have been examined predominantly in the visual system (4, 5). Rearing kittens with squint (strabismus) leads to striking changes in the binocular-response properties of striate cortex neurons (6, 7). Wave-like, correlated neuronal activity patterns have been recorded along the visual pathway (8), and the blockade of spontaneous waves in the retina results in abnormally segregated, eye-specific layers in the lateral geniculate nucleus (9). Synchronous activation of the optic nerves results in an impairment of the development of orientation selectivity in the primary visual cortex (10), it blocks normal topographic map refinement in the goldfish (11), and it blocks binocular map formation in frogs (12). In addition, in various developing systems, spike timing-dependent synaptic plasticity has been characterized recently (13–15). These modifications theoretically can lead to the formation of the cortical feature-selective structures by “decoding,” through synaptic strength changes, the temporal information within neuronal activities (16, 17).
However, in the primary auditory cortex (AI), where neurons exhibit tonal frequency selectivity and are organized into “tonotopic maps” (18–21), it remains largely unknown whether and how the temporal structures of neuronal activity that are evoked by patterned acoustic inputs during the early postnatal development will affect the formation of a feature-selective, organizational cortical structure (22, 23). An important shaping role of the temporal patterns of competitive acoustic inputs on the establishment of structural organization and neural processing capabilities in the central auditory system and in AI has been indicated by previous studies. Rearing mice in an acoustic environment with click stimuli resulted in reduced frequency tuning of neurons documented at the level of inferior colliculus (24, 25). Correlation between the development of speech-reception abilities and early language-specific speech exposure has been well documented (26–28). Rewiring visual inputs into the AI induces the formation of point-to-point, retinotopic representational topography and visual orientation modules within this field (29–31).
Recently, a correlation between the orderly cortical representation of sound frequencies in the rat AI and the distribution of the frequency power spectrum of environmental sounds to which rat pups have been exposed has been suggested (32, 33). In those studies, the spectral structures of early acoustic environments were demonstrated to have stimulus-specific impacts on the cortical representation of tonal frequencies. In the current study, we examined further whether the normally distributed temporal patterns of sound inputs are required for the development of neuronal frequency-response selectivity and of orderly “tonotopic” maps in rat AI. By exposing rat pups to pulsed white noise during a period of emergent frequency selectivity and tonotopicity, we found that both the progressive development and the ultimate formation of frequency tuning and tonotopicity were greatly impaired and affected. Changes induced in young rats endured into adulthood. In addition, an “early” critical period for experience-dependent modification of developing auditory cortex was revealed. These results are consistent with the hypothesis that the temporal patterns of competitive neuronal activities play an important, instructive role in shaping neural circuits that define the spectrotemporal structures of AI neurons.
Materials and Methods
Mapping the Auditory Cortex.
Female rats (Sprague–Dawley) were anesthetized with pentobarbital (2.6 ml/kg), and the contralateral auditory cortex was surgically exposed. Parylene-coated tungsten microelectrodes (2 mega ohms) were advanced 500–600 μm below the pial surface (layer 4/5), where tone-evoked responses with the shortest onset latencies were recorded. Complete frequency–intensity response areas (receptive fields) were derived at each recording site by presenting 25-ms duration tones (with 3-ms ramps) at 2 pulses per second (pps) with a calibrated sound delivery system (Tucker–Davis Technologies, Gainesville, FL) and a custom-made speaker positioned into the ear. Evoked spikes from a single neuron or small cluster of neurons were recorded at each site and analyzed with brainware software (Tucker–Davis). The frequency–intensity response area (tone-evoked receptive field) was outlined by a “tuning curve.” Its characteristic frequency (CF) was defined as the tone frequency at which responses could be evoked at the lowest stimulus intensity. Tuning curve bandwidths and CFs were defined by a “blind” procedure.
AI responses were mapped by recording tone-evoked neuronal responses from 60–120 microelectrode penetrations introduced into middle layers of the auditory responsive cortical zone in each animal. Penetration locations were relatively evenly located on a highly magnified image, using the cortical surface vasculature as landmarks. For all adult rats in this study, separation of response samples ranged between approximately 175 and 225 μm. For experiments in very young rats, the average electrode separation in each preparation rat was greater (250–300 μm), especially in a large, detuned zone, bordering the presumptive primary auditory cortex, where there was a greater degree of similarity between receptive fields recorded at neighboring sampled sites.
The adult AI was defined in this study by physiological properties such as short-latency (7- to 15-ms) responses and continuous tonotopy (CF increasing from posterior to anterior). Nonresponsive sites with an unusually high threshold or response not distinguishable from basal activity and responsive sites that exhibited clearly discontinuous CFs, long-latency responses, and nonselective receptive fields were considered to be non-A1 sites. To generate CF maps, points on the cortex were assigned CFs of nearest penetrations through Voronoi tessellation. The map was outlined with a line dividing tone-selective-responding from nonresponsive or nonselective recording sites.
In contrast to adult rats, auditory response maps in developing rat pups were defined by selective, tone-evoked responses with a longer latency of 10–30 ms. The tone-responsive region can be separated into the posterior zone and anterior zone (33). In the gray areas, sampled sites normally had receptive fields with flat peaks that spanned more than 1.0 octave range and extended to (and presumably beyond) the highest sound frequencies tested (30 kHz). Frequencies at the center of the response area (square root of the product of the beginning and ending frequencies of flat peaks) were used to estimate (albeit crudely) the frequency preference of these sampled neurons.
Early Exposure of Rat Pups.
Litters of 10–13 9-day-old rats and their mothers were placed in a sound-shielded test chamber from P9 to P28. An 8-h light/16-h dark cycle was established. Fifty-millisecond noise pulses (5-ms ramps) with 65-dB sound pressure level (SPL) were applied from a speaker placed about 15 cm above rats at 6 pps with 1-s intervals to minimize adaptation effects. The total SPL in the animal room was 5–10 dB lower than noise stimuli. No distortion or significant harmonic signal was found in the chamber when a tonal stimulus was delivered. In addition, there was no abnormality in the behavior of either the mother or pups during monotone exposure. The weights of all pups and mothers were monitored continuously. There was no weight loss compared with naïve rats, indicating normal lactation. The activities during awake state and the sleep behavior of the rat exhibited no noticeable stress.
Data Analysis.
We have used an index to quantitatively describe the precision of the tonotopicity. The line connecting the two most anterior and posterior penetrations within AI or presumable AI (33) was used as a reference for tonotopic axis. In naïve rats (but not invariably in exposed rats), the most anterior and posterior parts of AI elicited the lowest and highest CFs. We then rotated each map to orient the tonotopic axis horizontally. After rotation, new x coordinates of penetrations in each rat were normalized to be within a range from 0.0 to 1.0, and penetration sites were plotted according to their CFs and x coordinates. The logarithmic frequency range (1–30 kHz) was converted to a linear range (0–1). We defined the index as the average minimum distance from each data point to the line connecting (0,0) and (1,1). The larger the index, the more unrefined or undifferentiated the tonotopic map.
We examined neuronal correlation by simultaneously recording from three to four sites for 40 3-s epochs of nonstimulus, spontaneous activity. For each recording pair, an “unbiased” cross-correlogram was constructed from −1 s to 1 s by using matlab software. Because no sound stimulus was applied, shuffle correction was not applied to the correlogram. The “correlation index” is the ratio of the peak in the correlogram over the half peak width. Unless otherwise specified in the text or figure legends, statistical significance was assessed by using a two-tailed t test and data are presented as means ± SE.
Results
Distortion of Tonal Receptive Fields.
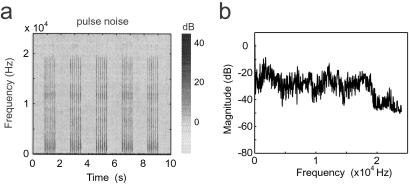
Litters of rat pups were placed in a sound attenuation chamber and exposed to repetitive, pulsed (6-pps) white noise of moderate intensity (Fig. 1a; also see Materials and Methods) from P9 to P28. Each noise pulse synchronously activated the primary auditory pathways responsive to tones within a 0.5- to 30-kHz frequency range. It severely degraded the normal temporal patterns of discharge that could represent different specific inputs and imposed its own, specific, dedifferentiating temporal pattern. Note that the intensity of sound frequency higher than about 18–20 kHz was 20 dB lower than that at lower sound frequencies (Fig. 1b).
Figure 1.
Spectrogram (a) and frequency spectrum (b) of the acoustic environment in the presence of noise stimuli. Colors represent relative dB levels for each frequency. Note that the brief pulsed-noise stimuli were applied at a rate of 6 pps, with 1 s spacing between pulse trains. Noise stimuli had a more or less stable energy level over 1–18 kHz.
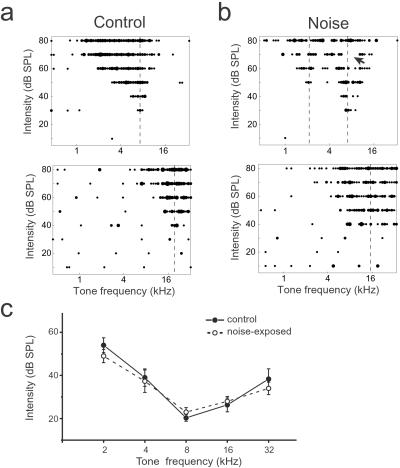
After being reared from P9 to P28 in the presence of this band-limited pulsed noise in a sound chamber, rats were returned to a normal environment and the primary auditory cortex was examined at about P80, using conventional extracellular unit response-recording mapping methods. Representative examples of tone-evoked receptive fields (see Materials and Methods) obtained from the middle layers of the auditory cortex are shown in Fig. 2b for a rat that had experienced noise exposure and in Fig. 2a for a control rat that had been placed in the sound chamber for the same period without noise stimuli. In the control rat, tonal receptive fields were not significantly different from naive animals reared in normal caged conditions. Tuning curves were “V shaped” with a single CF, and neurons responded continuously to the test tones (variable frequencies and intensities) within AI receptive fields.
Figure 2.
Representative examples of tonal receptive fields obtained from adult rats reared in control (a) or a pulsed-noise (b) environment. Responses are represented by dots in the response area, with the size of the dot proportional to the number of spikes evoked by tone stimuli. Dotted lines indicate positions of peaks of the receptive fields (CFs). The arrow indicates a typical “blank” domain in which the neuron does not respond to tonal stimuli within the receptive field. (c) Average stimulus intensity threshold at different CF ranges in control or exposed rats. Bin size = 1 octave. Note that there were no significant differences in response thresholds between experimental and control rats (means ± SE; P > 0.2).
By contrast, receptive fields obtained from the noise-exposed rats were degraded. For an AI site with a CF at around 8 kHz (Fig. 2b Upper), multiple peaks were present in the receptive field, and the bandwidths of the tuning curve 20 dB above the response threshold (BW20) were much broader than in control rats. Responses were not continuous, as indicated by scattered regions lacking spiking responses to some test tones (specific frequency–intensity values) within the neuron's “frequency–intensity response area.” At an AI site with a preference for higher frequencies, this typical “tuning curve” was broad, with a wide, flat peak extending across more than 1.5 octaves (Fig. 2b Lower). In fact, for most (93 of 118) sampled sites in AI in noise-exposed rats, receptive fields could be categorized as these Fig. 2b examples, i.e., as either (i) multipeaked and discontinuous, with CFs within mid- or low-frequency range or (ii) flat-peaked, with a high-frequency preference. No significant difference in sound intensity thresholds was found between control and exposed rats (Fig. 2c).
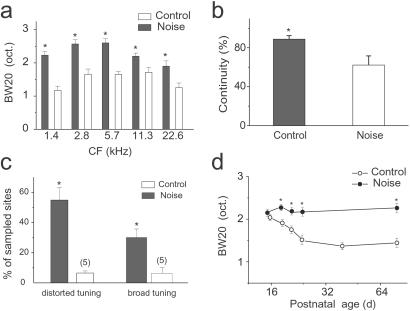
The effects of early noise exposure on the tone-evoked receptive fields in adult AI are summarized in Fig. 3. In early exposed adult rats, the average BW20 in every CF range was significantly broader than that in control rats (Fig. 3a). Here, CFs were defined as the midpoint of the flat peaks for those neurons that responded best to higher frequencies. The average continuity of responses in the receptive field, defined as the percentage of response-evoking tonal stimuli (frequency–intensity combination) within the receptive field, was significantly lower in the exposed rats (Fig. 3b). In addition, in early noise-exposed rats, receptive fields could be categorized into two groups: (i) multipeaked (or discontinuous) or (ii) flat-peaked. Few such receptive fields were observed in control rats (Fig. 3c). Thus, early noise exposure degraded the selective “tuning” of auditory cortical neurons. These effects could be interpreted as reflecting a blocking of the normal progressive sharpening of tuning curves during the postnatal developmental epoch. In normal or control rats, receptive fields initially are broad and then are sharpened between P14 and P23, as indicated by the progressive decrease of BW20 during postnatal development (Fig. 3d; also see ref. 33). In the noise-exposed rats, this sharpening was blocked by pulsed-noise stimulation during the same period, with the average BW20 changed little through the course of development and into adulthood. The dramatic, progressive, developmental change of tone-selective receptive fields in control rats (Fig. 3d) was consistent with our previous results (33).
Figure 3.
Summary of changes of tonal receptive fields. (a) Averaged bandwidths of tuning curves at 20 dB above threshold in control and noise-exposed adult rats for each CF range. Bin size = 1 octave. *, P < 0.02, t test, n > 18 for every group. (b) Average continuity of receptive fields in sampled sites in two groups. Continuity for each sampled site is calculated by the percentage of frequency–intensity combinations within the receptive field area (outlined by the tuning curve) that does not evoke spiking response. Lower continuity resulted from scattered, nonresponsive domains in the frequency–intensity response area (receptive field). *, P < 0.01, n = 118 from noise exposed rats; n = 102 from control rats. (c) Average percentage of sampled sites recorded from four control rats and four noise-exposed rats presenting distorted (multipeaked or discontinuous) or plateau-peaked receptive fields, respectively. *, P < 0.03. (d) Progressive change of tuning-curve bandwidths in two groups of rats during development. BW20s of all sampled sites in the posterior zone in every rat are averaged for each age (three or four rats are examined for each age) in the two groups, respectively. *, P < 0.03, t test.
Disruption of the Refinement of Tonotopicity.
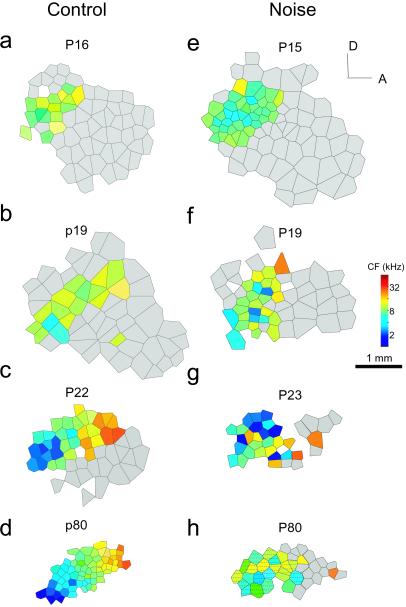
Litters of rats that were exposed to pulsed noise as well as control rats were mapped at different postnatal ages to examine the progressive development of tonotopicity in the auditory cortex when reared under different acoustic environments. In control rats reared with their mothers and littermates in a sound-shielded environment, the development of tonotopicity was similar to normal rats. As shown in Fig. 4 a–d and in our previous study (33), an adult-like tonotopic map of sound frequency in the rat AI was recorded at about P22, arising from two parallel developmental processes involving two cortical zones: (i) the progressive differentiation and refinement of tonotopicity within a posterior zone (Fig. 4, colored regions) defined in the adult as AI and (ii) the progressive loss of tone-evoked responsiveness over an initially large, broadly tuned anterior zone (Fig. 4, gray regions).
Figure 4.
Progressive development of cortical frequency representation in two different groups of rats. Shown are representative maps from rats at different postnatal ages, demonstrating the progressive changes in tonotopicity in the developing rat auditory cortex in control (Left) or noise-exposure condition (Right). The color of each polygon indicates the CF (in kHz) for neurons recorded at that site. Polygons are Voronoi tessellations, generated so that every point on the cortical surface was assumed to have the characteristics of its closest neighbors. Gray areas label nontuned anterior cortical zones in which neurons respond strongly and preferentially to higher-frequency tonal stimuli. A, anterior; D, dorsal. (Bar = 1 mm; color bar = represented sound frequencies, in kHz.) Areas that have distorted receptive fields are hatched, as shown in h.
By contrast, in noise-exposed rats, although the emergence of selective-tone-responsive receptive fields appeared to be facilitated during early development, the progressive refinement of tonotopicity was impaired substantially. At P15 and P19, the auditory cortex was more differentiated than in control rats, as indicated by the appearance of neurons tuned to more various tone frequencies—although no clear gradient of frequency presentation in the posterior region was observed. At P23, neurons that had similar CFs in noise-exposed rats still were scattered, and there was no sharply tuned high-frequency region. In noise-exposed young adult rats, the primary auditory cortex was composed of two sections: (i) neurons tuned to low or mid-frequencies and normally with multiple-peaked and discontinuous receptive fields and (ii) a zone in which neurons responded preferentially to higher frequencies but nonselectively, with flat-peaked receptive fields. There were very few sampling sites tuned sharply to a CF higher than 15 kHz. Even within the region over which neurons exhibited clear CFs, there was no clear tonotopicity (Fig. 4h). The impairment of the tonotopicity in noise-exposed rats likely resulted from the blockade or abnormality of the progressive differentiation of neurons that exhibited mid-frequency CFs at an early developmental age.
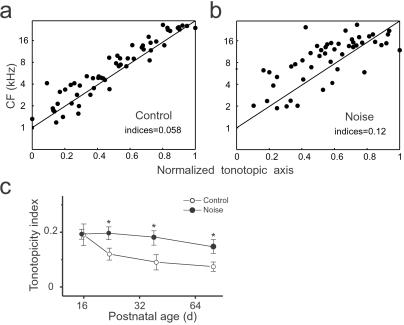
To summarize the effects of noise exposure on the development of tonotopicity in the rat primary cortex, the positions of each recording site in the AI area were normalized to the tonotopic axis and then plotted as a function of its CF (see Materials and Methods). Two examples from control and noise-exposed rats were shown in Fig. 5 a and b, respectively. In control rats, sampling sites were centered along the tonotopic axis, whereas in noise-exposed rats, sites were more scattered around the axis. The average minimum distance from each site to the tonotopic axis was used as an index of the precision (imprecision) in tonotopicity for each rat. As shown in Fig. 5c, the average indices in control rats for every postnatal age decreased over development, manifesting a progressive refinement of tonotopicity. In noise-exposed rats, the average index for each age group remained largely unchanged. Thus, activation of AI with early, synchronous auditory inputs during the selected epoch of postnatal development impaired the formation of normal tonotopicity during a critical epoch for auditory cortex development.
Figure 5.
(a) Disruption of tonotopicity by noise exposure. (b) Distribution of the cortical representation of different CFs along the tonotopic axis of the auditory cortex. Normalized coordinates (see Materials and Methods) from each rat are plotted together as a function of the defined characteristic frequency. Indices (see Materials and Methods) of precision (imprecision) in tonotopicity are shown in each box (mean ± SE). (c) Progressive development of tonotopicity in control or noise-exposed rats. The tonotopicity indices are averaged for each age group (n = 3 or 4). *, P < 0.05, t test.
Reduction in Temporal Correlation.
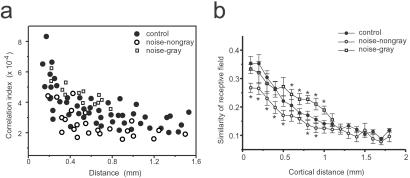
Cortical neurons normally are organized into cooperative neuronal assembles, which are revealed by the synchronization of spontaneous discharges of simultaneously recorded neurons (34). Because early noise exposure substantially changed the tone-evoked response profiles of AI neurons, the interactions between cortical neurons might be affected. Here, in the absence of sound stimulus, correlations of spontaneously active, multiunit responses for pairs of AI neurons were examined in both control (n = 4) and early noise-exposed (n = 3) young adult rats. In control rats, correlation strength decreased as a function of cortical distances within AI, and there were no differences of correlation found within representative cortical regions for high, mid-, or low frequencies. By contrast, in noise-exposed rats, the correlation indices could be separated into two distinct groups: (i) a temporal discharge correlation between neurons within the gray region (Fig. 4h), in which neurons responded preferentially and nonselectively to higher frequencies, was stronger than in controls whereas (ii) in the low-/mid-frequency representative region, correlation between spontaneous discharge for neuronal pairs was significantly lower than in control rats (Fig. 6a). These results were in accordance with higher similarities between the receptive fields recorded in the gray region vs. significantly lower similarities within the low-/mid-frequency representative regions (Fig. 6b). The latter was a result of the discontinuity of responses within the receptive fields, whereas BW20s of tuning curves were significantly larger than control rats. Because synchronization of spontaneous activities between cortical neurons was determined, at least partly, by horizontal cortical connections, these results suggest that the normal, functional development of local cortical circuits also might be impaired by early synchronous inputs.
Figure 6.
Temporal correlations between pairs of sampled recording sites in the absence of sound stimulus. (a) Level of synchronization of spontaneous discharges between cortical neurons with various distances, recorded in adult rats (see Materials and Methods). Empty symbols represent data obtained from noise-exposed rats, with squares for pairs of recordings within the gray regions. The average value of empty circles within a cortical distance of 0.3–1 mm is significantly lower than control, whereas the average value of squares is higher than control (P < 0.05, t test). (b) Average similarity (mean ± SD) of the tonal receptive fields vs. cortical distance. Similarity is the correlation coefficiency of response patterns within response areas for each pair of sampling sites. In the nongray area of AI, the value of similarity within 1 mm of cortical distance is significantly less than that in control animals (*, P < 0.05, t test).
A Critical Period for Experience-Dependent Modification.
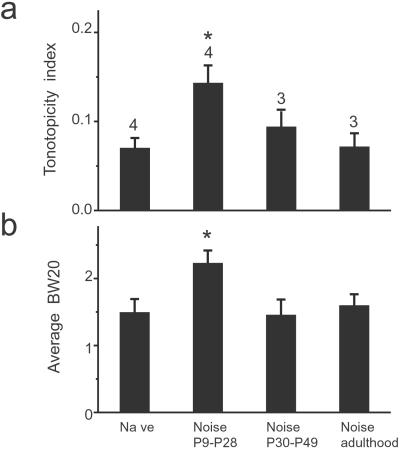
A critical period during which the neural circuit is most susceptible to alteration by abnormal sensory inputs has been observed in developing visual (1) and somatosensory (35) systems and in songbird learning as well as human language acquisition (27). Here, we examined further whether there is a critical period for the development of the primary auditory cortex. Three female rats at P30 were exposed to the pulsed-noise stimuli under similar situations for 20 days, and their primary auditory cortex was examined after the exposure period. In addition, three mother rats of each exposed litter, which experienced the same noise exposure as those rat pups, also were examined. No significant differences in the average tonotopicity index or the average 20-dB bandwidth were found between rat groups that were exposed to the pulsed noise at elder ages and naïve adult control rats (Fig. 7). These results indicate the existence of a critical period, within around P9–P28, for stimulus exposure-dependent modification of the developing primary auditory cortex. Comparing developing somatosensory or visual cortex (1, 35), it is interesting to note that critical periods of different sensory systems vary in their onsets and durations in rats, consistent with a potential role of electrical activity either spontaneously driven or evoked by sensory inputs in setting the beginning and ending of the critical period.
Figure 7.
A critical period for the modification of the developing primary auditory cortex. Four different rat groups (naïve rats, P9–P28 noise-exposed rats, P30–P49 noise-exposed rats, and rats exposed during adulthood) are compared. (a) Average tonotopicity indices (means ± SE) obtained from the above four rat groups. The number of rats for each group was labeled for each bar (*, P < 0.02, comparing naïve rats). (b) Average 20-dB bandwidth of receptive fields recorded from the four rat groups.
Discussion
Our recent studies showed that early exposure of rats to repetitive pure tones also resulted in broader-than-normal receptive fields for AI neurons and in a deteriorated AI tonotopicity (33). It is not clear whether these effects resulted from (i) predominant presentations of pulsed pure tones, which prevented rat pups from receiving normally distributed schedules of environmental sound inputs, or (ii) from the expansion of the representation of the exposed frequencies and the competitive losses of representations of less-activated frequencies. Here, exposing rats to pulsed white noises provided further evidence in support of our hypothesis that the sharpening of frequency-tuning curves and the refinement of the tonotopicity in AI require appropriately patterned input activity during development. Moreover, results suggest that the level and balance of auditory inputs representing different frequencies may contribute to the normal differentiation and sharpening of selective auditory responses (tuning curves), possibly through a mechanism of competition and cooperation. In noise-exposed rats, although a similar cortical region was found to respond preferentially to high-frequency sound inputs, the receptive fields were not well differentiated, as indicated by broad, flat-peaked receptive fields (Fig. 2 b and d). Because high-frequency power in our noise pulse was about 20 dB lower than that of low-/mid-frequency range (Fig. 1), this could result in deprivation of high-frequency sound inputs. However, the effects of sound deprivation on the cortical development must be investigated further.
Broadened tuning curves and the deteriorated tonotopicity resulting from noise rearing were not caused by cochlear damage. In this study, only moderate sound stimuli were applied, and thresholds of AI neurons were not significantly different from those recorded in control rats (Fig. 2c), whereas acoustic trauma induced by high levels (>110-dB SPL) of sound inputs normally is accompanied by elevated sound-intensity thresholds (36, 37). In addition, there was no significant difference between the average response latencies of AI neurons in exposed and control rats (12.3 ± 0.15 ms, n = 131 for control rats; 12.0 ± 0.25 ms, n = 151 for noise-exposed rats). Both observations indicated that the sensitivity of cochlea hair cells was unaffected by this noise exposure.
Although the origin of noise-induced effects remains unclear, changes of neuronal connectivity in either subcortical auditory nuclei or cortex may contribute to it. Earlier findings indicate that experience-dependent changes can be induced in the subcortical central auditory system (24, 25, 38–43). In the mouse inferior colliculus, repetitive click-sound stimuli during development block the normal sharpening of the tonal receptive fields and result in significant broader tuning curves than those recorded in normal animals (24, 25), which is similar to what we observed here. However, whether there is any change of the tonotopicity or tone-evoked responses has not been examined in detail in those studies. On the other hand, evidence suggests that plasticity of cortical neuronal connections also contributes to noise-induced changes. It is well documented that thalamocortical and corticocortical neuronal connections undergo activity-dependent modification during development (2, 3). Modification of neural circuits in the auditory cortex indeed could be induced by abnormal patterns of neuronal activities (29, 30). In addition, changes in strengths of synchronization of spontaneous discharge of cortical neurons could suggest activity-dependent changes in cortical, neuronal connections.
It is commonly hypothesized that selective strengthening and elimination of neuronal connections through activity-dependent synaptic plasticity lead to the establishment of feature-selective cortical response properties. Hebb's postulate (44, 45), which predicts that excitatory synaptic connections can be strengthened cooperatively by synchronous inputs, might be used to explain the broadening of the tonal receptive fields under pulsed-noise stimuli. However, discontinuities of the “tuned” tone-evoked responses within AI and changes of the temporal correlation between cortical neurons suggest that, in addition to a simple correlation rule, several consecutive, potential mechanisms also may be involved in governing activity-dependent changes on synaptic inputs of a cortical pyramidal cell. First, synchronous sensory inputs could strengthen all coactivated thalamic inputs according to the Hebbian process (46, 47). Second, the total strength of thalamic inputs could be controlled and modified subsequently by a homeostatic mechanism (48, 49) that operated through a random process to individually readjust synaptic strength. Third, horizontal cortical inputs on pyramidal cells could undergo spike timing-dependent modification, with a net depression generated by these synchronous inputs (13–15). These processes, which derive from the plasticity of excitatory synapses, eventually will result in abnormal elimination or weakening of the neuronal connection in the auditory cortex during noise exposure. However, inappropriate activity-dependent modifications on inhibitory connections potentially could achieve the same effects and/or contribute cooperatively with excitatory plasticity to generate the effects recorded in our experiments.
In summary, this study shows that the development of AI processing is powerfully affected by the spectrotemporal input structures delivered from the acoustic environment during a critical period of postnatal development. A further understanding of an underlying mechanism and a documentation of the behavioral consequence of such representational distortions should bear great practical and theoretical importance.
Abbreviations
- AI
primary auditory cortex
- CF
characteristic frequency
- pps
pulses per second
- SPL
sound pressure level
- BW20
bandwidth of the tuning curve 20 dB above the response threshold
References
- 1.Wiesel T N. Nature (London) 1982;299:583–591. doi: 10.1038/299583a0. [DOI] [PubMed] [Google Scholar]
- 2.Penn A A, Shatz C J. Pediatr Res. 1999;45:447–458. doi: 10.1203/00006450-199904010-00001. [DOI] [PubMed] [Google Scholar]
- 3.Katz L C, Shatz C J. Science. 1996;274:1133–1138. doi: 10.1126/science.274.5290.1133. [DOI] [PubMed] [Google Scholar]
- 4.Blakemore C, Cooper G F. Nature (London) 1970;228:477–478. doi: 10.1038/228477a0. [DOI] [PubMed] [Google Scholar]
- 5.Sengpiel F, Stawinski P, Bonhoeffer T. Nat Neurosci. 1999;2:727–732. doi: 10.1038/11192. [DOI] [PubMed] [Google Scholar]
- 6.Hubel D H, Wiesel T N. J Neurophysiol. 1965;28:1041–1059. doi: 10.1152/jn.1965.28.6.1041. [DOI] [PubMed] [Google Scholar]
- 7.Lowel S, Singer W. Science. 1992;255:209–212. doi: 10.1126/science.1372754. [DOI] [PubMed] [Google Scholar]
- 8.Meister M, Wong R O, Baylor D A, Shatz C J. Science. 1991;252:939–943. doi: 10.1126/science.2035024. [DOI] [PubMed] [Google Scholar]
- 9.Penn A A, Riquelme P A, Feller M B, Shatz C J. Science. 1998;279:2108–2112. doi: 10.1126/science.279.5359.2108. [DOI] [PubMed] [Google Scholar]
- 10.Weliky M, Katz L C. Nature (London) 1997;386:680–685. doi: 10.1038/386680a0. [DOI] [PubMed] [Google Scholar]
- 11.Schmidt J T, Eisele L E. Neuroscience. 1985;14:535–546. doi: 10.1016/0306-4522(85)90308-2. [DOI] [PubMed] [Google Scholar]
- 12.Brickley S G, Dawes E A, Keating M J, Grant S. J Neurosci. 1998;18:1491–1504. doi: 10.1523/JNEUROSCI.18-04-01491.1998. [DOI] [PMC free article] [PubMed] [Google Scholar]
- 13.Markram H, Lubke J, Frotscher M, Sakmann B. Science. 1997;275:213–215. doi: 10.1126/science.275.5297.213. [DOI] [PubMed] [Google Scholar]
- 14.Zhang L I, Tao H W, Holt C E, Harris W A, Poo M. Nature (London) 1998;395:37–44. doi: 10.1038/25665. [DOI] [PubMed] [Google Scholar]
- 15.Feldman D E. Neuron. 2000;27:45–56. doi: 10.1016/s0896-6273(00)00008-8. [DOI] [PubMed] [Google Scholar]
- 16.Song S, Miller K D, Abbott L F. Nat Neurosci. 2000;3:919–926. doi: 10.1038/78829. [DOI] [PubMed] [Google Scholar]
- 17.Paulsen O, Sejnowski T J. Curr Opin Neurobiol. 2000;10:172–179. doi: 10.1016/s0959-4388(00)00076-3. [DOI] [PMC free article] [PubMed] [Google Scholar]
- 18.Merzenich M M, Knight P L, Roth G L. J Neurophysiol. 1975;38:231–249. doi: 10.1152/jn.1975.38.2.231. [DOI] [PubMed] [Google Scholar]
- 19.Aitkin L M, Merzenich M M, Irvine D R, Clarey J C, Nelson J E. J Comp Neurol. 1986;252:175–185. doi: 10.1002/cne.902520204. [DOI] [PubMed] [Google Scholar]
- 20.Scheich H. Curr Opin Neurobiol. 1991;1:236–247. doi: 10.1016/0959-4388(91)90084-k. [DOI] [PubMed] [Google Scholar]
- 21.Kaas J H, Hackett T A, Tramo M J. Curr Opin Neurobiol. 1999;9:164–170. doi: 10.1016/s0959-4388(99)80022-1. [DOI] [PubMed] [Google Scholar]
- 22.King A J, Moore D R. Trends Neurosci. 1991;14:31–37. doi: 10.1016/0166-2236(91)90181-s. [DOI] [PubMed] [Google Scholar]
- 23.Rauschecker J P. Trends Neurosci. 1999;22:74–80. doi: 10.1016/s0166-2236(98)01303-4. [DOI] [PubMed] [Google Scholar]
- 24.Sanes D H, Constantine-Paton M. Science. 1983;221:1183–1185. doi: 10.1126/science.6612332. [DOI] [PubMed] [Google Scholar]
- 25.Sanes D H, Constantine-Paton M. J Neurosci. 1985;5:1152–1166. doi: 10.1523/JNEUROSCI.05-05-01152.1985. [DOI] [PMC free article] [PubMed] [Google Scholar]
- 26.Kuhl P K, Williams K A, Lacerda F, Stevens K N, Lindblom B. Science. 1992;255:606–608. doi: 10.1126/science.1736364. [DOI] [PubMed] [Google Scholar]
- 27.Doupe A J, Kuhl P K. Annu Rev Neurosci. 1999;22:567–631. doi: 10.1146/annurev.neuro.22.1.567. [DOI] [PubMed] [Google Scholar]
- 28.Tallal P, Miller S L, Bedi G, Byma G, Wang X, Nagarajan S S, Schreiner C, Jenkins W M, Merzenich M M. Science. 1996;271:81–84. doi: 10.1126/science.271.5245.81. [DOI] [PubMed] [Google Scholar]
- 29.Roe A W, Pallas S L, Hahm J O, Sur M. Science. 1990;250:818–820. doi: 10.1126/science.2237432. [DOI] [PubMed] [Google Scholar]
- 30.Sharma J, Angelucci A, Sur M. Nature (London) 2000;404:841–847. doi: 10.1038/35009043. [DOI] [PubMed] [Google Scholar]
- 31.von Melchner L, Pallas S L, Sur M. Nature (London) 2000;404:871–876. doi: 10.1038/35009102. [DOI] [PubMed] [Google Scholar]
- 32.Stanton S G, Harrison R V. Auditory Neurosci. 1996;2:97–107. [Google Scholar]
- 33.Zhang L I, Bao S, Merzenich M M. Nat Neurosci. 2000;4:1123–1130. doi: 10.1038/nn745. [DOI] [PubMed] [Google Scholar]
- 34.Singer W. Neuron. 1999;24:49–25. doi: 10.1016/s0896-6273(00)80821-1. [DOI] [PubMed] [Google Scholar]
- 35.Feldman D E, Nicoll R A, Malenka R C. J Neurobiol. 1999;41:92–101. [PubMed] [Google Scholar]
- 36.Cody A R, Johnstone B M. Hear Res. 1980;3:3–16. doi: 10.1016/0378-5955(80)90004-0. [DOI] [PubMed] [Google Scholar]
- 37.Kimura M, Eggermont J J. Hear Res. 1999;135:146–162. doi: 10.1016/s0378-5955(99)00104-5. [DOI] [PubMed] [Google Scholar]
- 38.Clopton B M, Winfield J A. J Neurophysiol. 1976;39:1081–1089. doi: 10.1152/jn.1976.39.5.1081. [DOI] [PubMed] [Google Scholar]
- 39.King A J, Hutchings M E, Moore D R, Blakemore C. Nature (London) 1988;332:73–76. doi: 10.1038/332073a0. [DOI] [PubMed] [Google Scholar]
- 40.Gao E, Suga N. Proc Natl Acad Sci USA. 1998;95:12663–12670. doi: 10.1073/pnas.95.21.12663. [DOI] [PMC free article] [PubMed] [Google Scholar]
- 41.Poon P W, Chen X. Brain Res. 1992;585:391–394. doi: 10.1016/0006-8993(92)91243-8. [DOI] [PubMed] [Google Scholar]
- 42.Gao E, Suga N. Proc Natl Acad Sci USA. 2000;97:8081–8086. doi: 10.1073/pnas.97.14.8081. [DOI] [PMC free article] [PubMed] [Google Scholar]
- 43.Knudsen E I, Zheng W, DeBello W M. Proc Natl Acad Sci USA. 2000;97:11815–11820. doi: 10.1073/pnas.97.22.11815. [DOI] [PMC free article] [PubMed] [Google Scholar]
- 44.Hebb D O. Organization of Behavior. New York: Wiley; 1949. [Google Scholar]
- 45.Stent G S. Proc Natl Acad Sci USA. 1973;70:997–1001. doi: 10.1073/pnas.70.4.997. [DOI] [PMC free article] [PubMed] [Google Scholar]
- 46.Goodman C S, Shatz C J. Cell. 1993;72,Suppl.:77–98. doi: 10.1016/s0092-8674(05)80030-3. [DOI] [PubMed] [Google Scholar]
- 47.Zhang L I, Tao H W, Poo M. Nat Neurosci. 2000;3:708–715. doi: 10.1038/76665. [DOI] [PubMed] [Google Scholar]
- 48.Turrigiano G G, Nelson S B. Curr Opin Neurobiol. 2000;10:358–364. doi: 10.1016/s0959-4388(00)00091-x. [DOI] [PubMed] [Google Scholar]
- 49.Fregnac Y. Nature (London) 1998;391:845–846. doi: 10.1038/35996. [DOI] [PubMed] [Google Scholar]


