

Abstract
Full-length RNA sequencing methods using long-read technologies can capture complete transcript isoforms, but their throughput is limited. We introduce MAS-ISO-seq, a technique for programmably concatenating cDNAs into molecules optimal for long-read sequencing, increasing the throughput >15 fold to nearly 40 million cDNA reads per run on the Sequel IIe sequencer. Applied to single-cell RNA sequencing of tumor-infiltrating T cells MAS-ISO-seq demonstrated a 12–32-fold increase in discovery of differentially spliced genes.
Editorial summary:
Programmable concatenation of cDNA molecules increases the throughput of of PacBio sequencing about 15-fold.
While RNA sequencing has accelerated our understanding of biology, accurate quantification and discovery of RNA isoforms remains a challenge1. Alternative splicing is a core regulatory process that modulates the coding sequence, translation efficiency, stability, and localization of mRNAs through differential splicing of exons during transcript maturation. Beyond being an integral component of cellular/organismal development and homeostasis, alternative splicing is implicated in a wide range of pathologies with hallmark isoforms being linked to cardiovascular, neurological, and immunological diseases2,3. Additionally, mutated and/or dysregulated splicing factors make up a major class of phenotypic alterations associated with tumor progression and therapeutic resistance4.
High-throughput full-length RNA isoform identification and quantification remain challenging for single-cell and bulk studies as the necessary read lengths (>5 kb) and depths (>2×10⁷ reads) are not easily attainable by existing sequencing platforms. For example, short-read sequencing platforms (e.g. Illumina) achieve more than sufficient throughput (>1×10⁹ reads) but are hindered by limited read lengths (50 – 600 bp) which are inadequate to span the majority of human transcripts (~ 1.6 ± 1.1 kb, Supplementary Fig. 1). As a result, individual short reads often fail to span successive splice sites, impairing efforts to correctly identify alternative transcript isoforms5. A recently developed short-read sequencing approach, Smart-seq3, enhances isoform detection by enabling single-molecule reconstruction via integration of reads from products with the same 5’ unique molecular identifier (UMI)6. However, due to the 5’ coverage bias of Smart-seq3, most transcript molecules are only partially reconstructed, resulting in poor isoform identification and discovery. Conversely, the long-read platforms from Pacific Biosciences (PacBio) and Oxford Nanopore (ONT) enable the full-length RNA isoform sequencing needed for robust isoform identification and discovery but suffer from comparatively low read throughput at high costs, limiting the scope of their application. Early limitations in raw base calling accuracy on long-read platforms (error rates of 10 – 15%) have been mitigated by improvements in pore-based nucleotide reading, circularized consensus sequencing (CCS, or HiFi), and consensus generation strategies for individual library molecules7–9. On the PacBio Sequel IIe platform, consensus base quality reaches Phred-scale quality of Q30 at approximately 10 circular passes, with marginal quality improvement on additional passes. For the current Sequel IIe instrument and SMRT Cell 8M chemistry, the optimal library size for reaching ~10 circular passes is 15 – 20 kb. As transcript lengths typically range substantially shorter (200 bp - 5 kb), CCS of individually circularized cDNA molecules using the standard Iso-Seq protocol (PacBio) yields an excessive number of circular passes (50 – 60) and ineffectively utilizes available sequencing potential of the platform (Supplementary Fig. 2).
To maximize the sequencing throughput on the PacBio platform, we developed a method for the programmable concatenation of DNA fragments into long composite sequence library molecules, Multiplexed Arrays Sequencing (MAS-seq, Fig. 1a). When MAS-seq is used for sequencing transcript isoforms, we term the approach MAS-ISO-seq. The protocol begins by depleting TSO priming artifacts via streptavidin/biotin selection of molecules containing the oligo-dT adapter from the input cDNA library. The purified cDNA library is then split across parallel PCRs, which serve to both increase cDNA yield and append reaction-specific deoxy-uracil (dU) containing barcode adapters. Using dU digestion followed by barcode-directed ligation of cDNAs, MAS-ISO-seq generates long concatenated cDNA arrays assembled deterministically with a narrow length distribution that allow for both accurate consensus sequencing and more optimal capacity utilization of the PacBio long-read platform. To drive accurate and specific hybridization, we designed 15 bp ligation barcode adapters with each having a Hamming distance of 11 from all other barcodes10. In combination with upstream depletion of TSO priming artifacts via streptavidin/biotin selection, MAS-ISO-seq boosts the sequencing throughput to approximately 40 million full-length transcripts per SMRT Cell 8M flow cell, a >15-fold increase over CCS-corrected read counts (Fig. 1b).
Fig. 1: MAS-ISO-seq workflow and experimental validation using synthetic RNA isoforms.
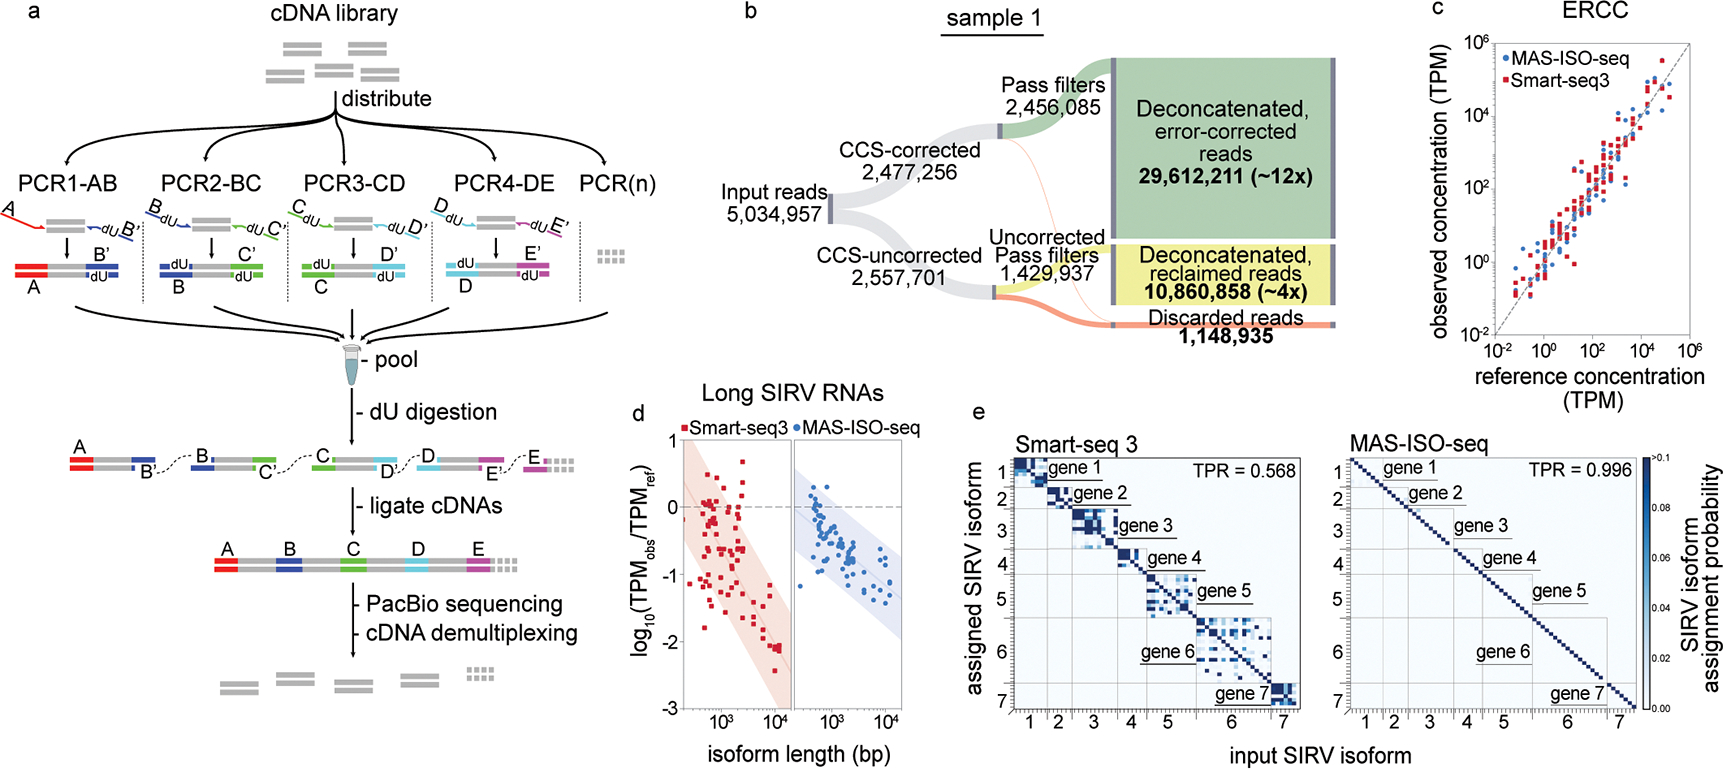
(a) Schematic of the MAS-ISO-seq intramolecular cDNA multiplexing workflow. (b) Sankey diagram reporting MAS-ISO-seq run yield of sample 1 at various stages of processing. (c) Observed ERCC concentrations as measured in MAS-ISO-seq and Smart-seq3 experiments vs. reference concentrations (R-squared > 0.95 for both). (d) Log-ratio of observed to reference concentrations of short and long SIRV isoforms in SIRV-Set 4 vs. transcript length for Smart-seq3 and MAS-ISO-seq. (e) Isoform identification confusion matrix for SIRV isoforms as measured by Smart-seq3 reconstructions and MAS-ISO-seq observations.
To demonstrate MAS-ISO-seq’s performance, we carried out a 15-member cDNA ligation from two 5’ single-cell gene expression cDNA libraries (10x Genomics) of tumor-infiltrating CD8+ T cells. As expected, we observed a ~15-fold increase in cDNA library length after ligation (Supplementary Fig. 3). MAS-ISO-seq libraries underwent standard CCS library preparation and were sequenced on the PacBio Sequel IIe. Sequenced libraries exhibited corrected read length and circular pass count distributions more comparable to whole-genome CCS data than the standard isoform sequencing method, Iso-Seq, as expected due to longer concatenated library lengths (Supplementary Fig. 4).
The programmed sequential pattern of MAS-ISO-seq adapters provide landmarks for effective cDNA segmentation as well as constraints for detecting malformed or otherwise defective array structures. MAS-ISO-seq adapters also enable utilization of CCS-uncorrected reads which are otherwise discarded using standard methods. To exploit these signals, we developed a composite profile hidden Markov model, Longbow, for the probabilistic annotation and optimal segmentation of each MAS-ISO-seq read via maximum a posteriori state path (Methods). Across both single-cell MAS-ISO-seq libraries, 99.01–99.15% of CCS-corrected reads and 54.27–60.72% of CCS-uncorrected reads were found to segment consistently. To maximize precision, segmentation results inconsistent with our expected array structure (i.e. off-subdiagonal elements of the matrices in Supplementary Fig. 5a,b) were filtered out (Supplementary Fig. 5c,d). A plurality of filtered reads (Sample 1: 29.54%, Sample 2: 35.61%) were found to contain fully-formed 15-element arrays. Arrays with fewer than 15 cDNAs were more prevalent in CCS-uncorrected reads than CCS-corrected (Supplementary Fig. 6, 7). Across both libraries, this process yielded 37–40 million cDNA reads for downstream analysis (a gain of 16.34–22.90x compared to the CCS-corrected read yield). (Fig. 1b, Supplementary Fig. 8).
The segmented reads were then filtered again to remove reads that failed to conform to the library structure at the individual cDNA level (Longbow sift command, Methods). The vast majority of sifted, segmented reads from these partial arrays still contained consecutive adapter sequences, a poly(A) tail, and had a high mapping quality to the genome (96.90%, Supplementary Fig. 6,7). After final filtering across both samples, we obtained ~21–28M quantification-ready CCS-corrected transcripts (a ~11–13 fold yield increase over the number of CCS-corrected reads) and ~6–8M quantification-ready CCS-uncorrected transcripts (an additional ~2–5 fold increase) for a total 14–18 fold increase as compared to raw CCS-corrected reads.
To validate the ability of MAS-ISO-seq to faithfully identify RNA isoforms, we performed full-length RNA sequencing of the Lexogen SIRV-Set 4, a synthetic mixture of Spike-In RNA Variants (SIRVs) containing 69 RNA isoforms of varying lengths and equal molarity across 7 “genes”, 15 long 4–12 kb SIRVs, and 92 ERCC RNA standards with concentration spanning 6 orders of magnitude11. Smart-seq3 short-read sequencing of the SIRV-Set 4 library was performed in parallel to compare short-read isoform reconstructions to our high-throughput long-read sequencing approach. While quantification of ERCC standards was broadly similar overall between both protocols (Fig. 1c), long isoforms showed markedly reduced length bias in MAS-ISO-seq and Iso-Seq vs. Smart-seq3 (Fig. 1d, Supplementary Fig. 9). Smart-seq3 isoform reconstructions exhibited substantial ambiguity in assigning reconstructed transcripts to a specific known isoform (~43% error rate) (Fig. 1e). In contrast, MAS-ISO-seq allows direct identification of transcript isoforms without the need for in silico reconstruction, and hence leads to virtually unambiguous isoform assignment (~0.4% error rate, Fig. 1e).
To characterize the performance of MAS-ISO-seq for single-cell RNA sequencing, we performed 10x Genomics 5’ single-cell gene expression on tumor-infiltrating CD8+ T cells. Using the standard 5’ single-cell gene expression protocol, we generated both standard short-read and MAS-ISO-seq long-read libraries from the same full-length cDNA library. To overcome challenges associated to the incompleteness of the available isoform annotations as well as cDNA truncation artifacts, we developed a graph-based algorithm that assigns each read to an isoform equivalence class based on the junction-level relationship between the read, GENCODE reference annotations, and de novo annotations discovered from all reads using StringTie212 (Methods; Supplementary Fig. 10,11). After applying conventional QC filtering steps and separating of primary tumor cells (Methods), we obtained 5,270 CD8+ T cells containing a median of 4,041 UMIs/cell (short-read data) and 1,701 UMIs/cell (long-read data). Sequencing saturation was higher for the short-read run, 1.98 reads/UMI (short) vs. 1.22 reads/UMI (long). We leveraged the presence of a small number of primary tumor cells in our sample and the mutually exclusive expression of several immune and tumor genes to estimate the accuracy of MAS-ISO-seq cell barcode assignments to be in the range 99.0% - 99.7% (Methods; Supplementary Fig. 12). Despite large discrepancies in sequencing depth between short and long-read approaches and quantification methodologies (Methods), cell clustering and gene expression were highly concordant (Fig. 2a, adjusted Rand index = 0.79; Fig. 2b, concordant gene count saturation curves; Supplementary Fig. 12, R-squared = 0.91). A common set of T cell transcriptional states ranging from stem cell-like to terminally differentiated were observed in both datasets.
Fig. 2: Single-cell isoform-resolved sequencing of primary human CD8+ T cells with MAS-ISO-seq.
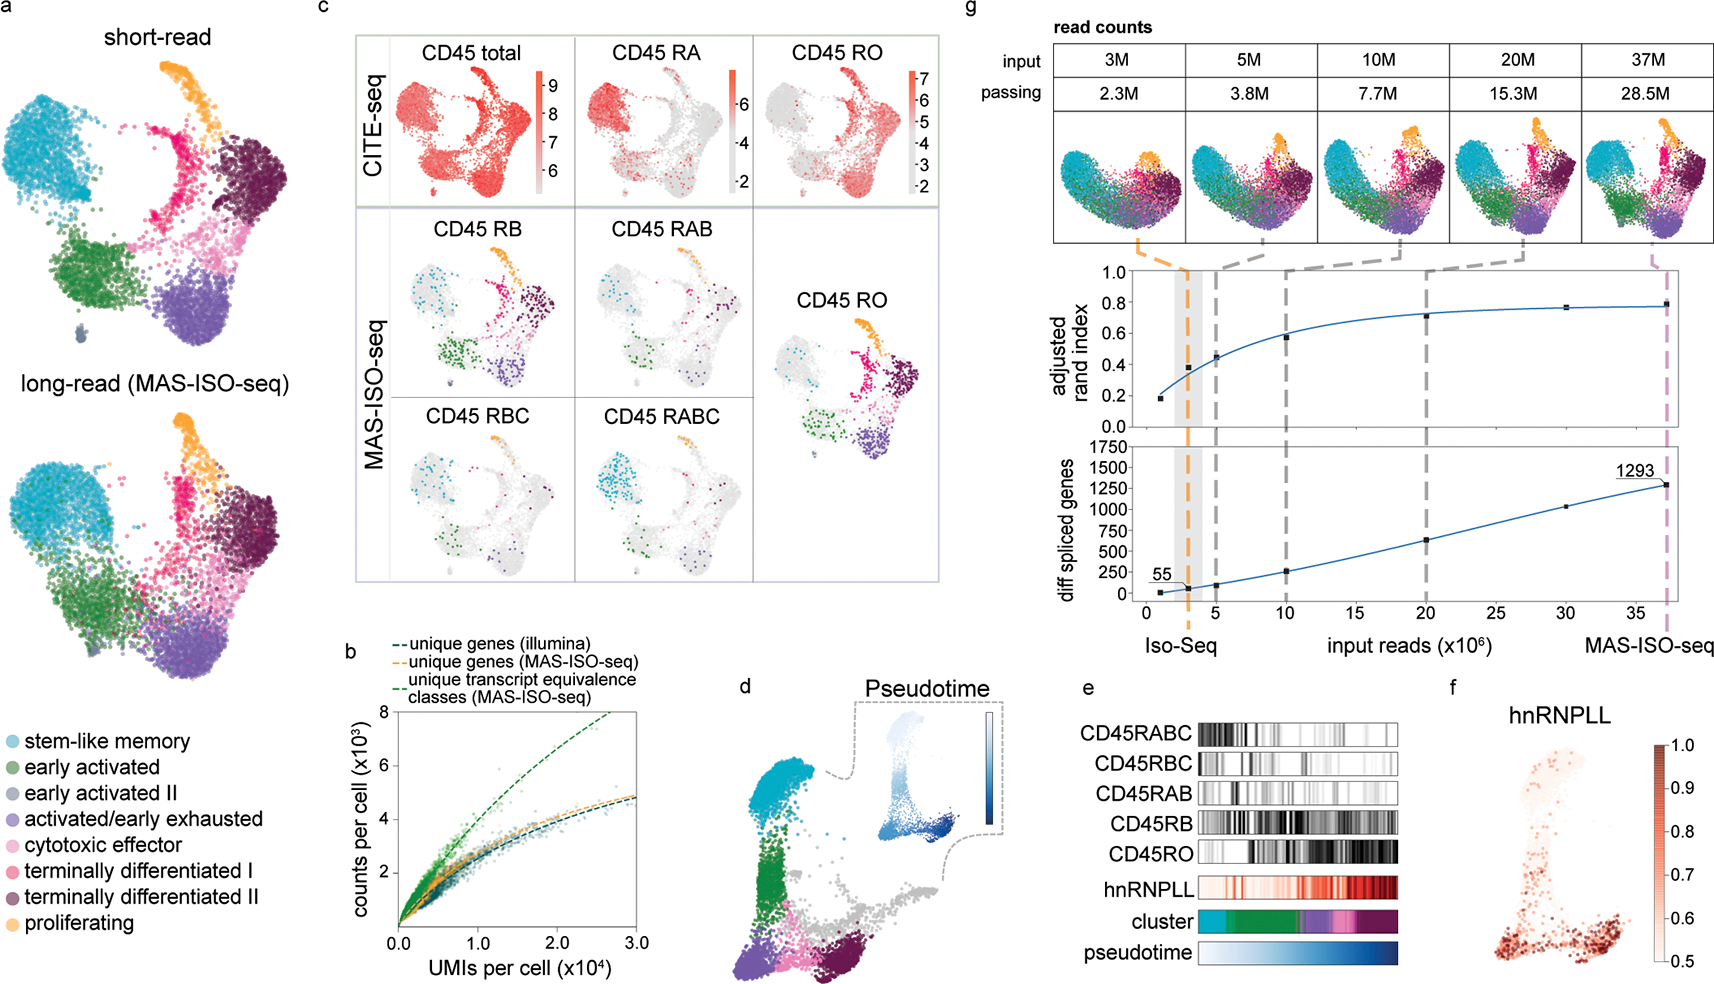
(a) UMAP embedding of single-cell gene expression of 5,270 CD8+ T cells from short or long-read analyses; the long-read UMAP is annotated with the cell identities determined from the short-read data. (b) Scatter plot of unique gene or transcript counts in cells vs. UMI counts per cell for short-read (Illumina) and long-read (MAS-ISO-seq). (c) CD45 (PTPRC) isoform analysis using either CITE-seq or MAS-ISO-seq (natural log raw counts). (d) Force directed graph of CD8+ T cells with insets depicting pseudotime progression and differential CD45 isoform expression along the pseudotime axis. (e) Levels of isoforms along pseudotime and in each cluster. (f) Expression of hnRNPLL along the pseudotime progression (log normalized counts); (g) Downsampling analysis of MAS-ISO-seq reads; (top) evolution of UMAP embedding vs. depth; (middle) adjusted Rand index (ARI) between short-reads reference annotations and downsampled long reads vs. depth; (bottom) number of statistically significant differentially spliced genes vs. depth. Typical Iso-Seq read depths shaded in gray.
Leveraging the distinct splicing patterns of CD45 (PTPRC) over the course of T cell differentiation, we performed orthogonal validations of CD45 isoform expression at the protein level using CITE-seq and compared them to the mRNA levels measured with MAS-ISO-seq13. CD45 isoform expression between these two modalities was highly concordant (Fig. 2c). Notably, mRNA measurements were more granular in their ability to resolve the multiple CD45 isoforms present (RO, RA, RAB, RB, RBC) as compared to the antibody-based CITE-seq approach. This is due to the single epitope specificity of antibodies which limits or does not enable discrimination between closely related isoforms14. For example, the CD45 RA antibody cannot distinguish between CD45 RA and RAB. Pseudotime analysis revealed a continuum of T cell states leading from stem cell-like to activated to terminally differentiated. Canonical CD45 isoform expression and its associated splicing factor, hnRNPLL13, tracked clearly along this differentiation trajectory (Fig. 2d–f).
To quantify the impact of the sequencing depth gained by MAS-ISO-seq on cell typing and identification of differential spliced genes, we performed an in silico downsampling analysis from a single MAS-ISO-seq run. We processed each dataset identically using the same pipeline and computed the adjusted Rand index (ARI) between the cell clustering of the subsampled long-read dataset and the full short-read dataset as reference. We also determined the number of differentially spliced genes across the T cell subtypes for each downsampling run (Methods). Compared to the read depth expected from an Iso-Seq run (2–4M HiFi reads passing filters), the throughput gain afforded by MAS-ISO-seq translates to 34–47% increase and saturation of ARI between short-read and long-read single-cell clustering and a 12–32-fold gain in identifying differentially spliced genes (multiple hypothesis testing correction with FDR < 0.05) (Fig. 2g; cluster-resolved results given in Supplementary Fig. 14). Notably, a plurality of the differentially spliced (DS) genes were distinct from the set of differentially expressed (DE) genes (Supplementary Fig. 15).
In this work, we detailed and validated MAS-ISO-seq, a programmable cDNA concatemerization method that boosts throughput of the PacBio long-read sequencing platform >15-fold to approximately 40 million deconcatenated reads per run. Using synthetic RNA isoforms as a ground truth library, we demonstrate that MAS-ISO-seq is far superior in confidently identifying RNA isoforms as compared to short-read approaches. Further, we leveraged MAS-ISO-seq to perform single-cell RNA isoform sequencing on human tumor-infiltrating CD8+ T cells. We validated our ability to accurately identify isoforms by resolving canonical CD45 isoform expression differences across the range of observed cell states and orthogonal protein isoform-based measurements. Through downsampling analyses, we demonstrate that the additional throughput afforded by MAS-ISO-seq is sufficient to enable robust cell clustering into known T cell differentiation states and substantially boosts the identification of differentially spliced genes. As adequate sequencing depth is, in part, a function of cellular RNA content, deeper sequencing may be necessary to provide adequate power for downstream single-cell analyses. A related approach, HIT-scISOseq, leverages palindromic adapter sequences to drive ligation of an indeterminate number of cDNAs, enabling approximately 10 million transcript reads15. While producing four-fold lower yield as compared to MAS-ISO-seq, HIT-scISOseq additionally lacks the sequential array structure that MAS-ISO-seq exploits for accurate segmentation and identification of malformed arrays. Other concatenation approaches for targeted DNA sequencing use Gibson Assembly or Golden Gate Assembly for array formation. These methods also demonstrate considerably lower throughput and lack the error robustness of MAS-ISO-seq arrays16,17.
Challenges impacting the RNA isoform sequencing field as a whole include cDNA synthesis artifacts, incomplete transcriptome references, and transcriptome assembly software with limited performance. We believe that the read throughput afforded by approaches such as MAS-ISO-seq will lower barriers to data generation and catalyze progress to surmount these challenges. The compatibility of MAS-ISO-seq with archived single-cell cDNA libraries generated in cell atlasing studies poises the field to immediately advance isoform discovery and generate cell type specific isoform-resolved transcriptome references at scale. Furthermore, MAS-ISO-seq will augment a broad range of efforts including gene fusion identification, proteogenomic resolution, neoantigen discovery, TCR/BCR repertoire sequencing. To date, PacBio and ONT have driven transformative advancements in long-read sequencing, releasing new platforms and chemistries with increased base-level accuracy and throughput (e.g. Revio and Q20+). Given the modular and scalable nature of MAS-ISO-seq, the workflow is positioned to co-evolve with compatible long-read sequencing platforms, enabling even greater throughput as read lengths, yield, and per-base accuracy increase.
Methods:
Patients consent and sample collection
Patients CD8+ T cells analyzed in this study were collected under the Dana-Farber/Harvard Cancer Center Institutional Review Board (DF/HCC protocol 11–181), and provided written informed consent prior to tissue collection.
Single-cell and SIRV cDNA library preparation
Sample dissociation and FACS Sorting of CD3+CD8+ T cells:
Using the human tumor dissociation kit (Miltenyi Biotec; Cat# 130–095-929), freshly isolated tumors were digested to obtain a single cell suspension. Tissue was placed into a 1.5mL Eppendorf tube containing 420μL of DMEM with 10% FCS, 42μL of enzyme H, 21μL of enzyme R, and 5μL enzyme A (provided with the kit). The tissue was minced using surgical scissors, and an additional 512μL of DMEM with 10% FCS was added to the tube (total volume of 1ml). Next the tissue was incubated for 15 min at 37°C, 350 rpm in a thermomixer (Eppendorf; F1.5). After incubation, the tissue was further digested using a 1 ml syringe plunger over a 50μm filter (Sysmex; Cat# 04–004-2327), making sure to wash the filter with media. Using ACK buffer (Gibco; Cat# A1049201), RBC lysis was performed and the sample was finally resuspended in DMEM with 10% FCS in order to count and determine the viability of the cells using a manual hemocytometer (Bright-line; Cat# 1492). Cells were then washed twice with cold PBSx1 and the cells were incubated with live/dead Zombie Violet Dye (Biolegend, 423114) for 15 min at RT as suggested by the manufacturer. The cells were then washed and resuspended with 1X PBS containing 1.5% FCS for cell surface labeling using a standard protocol for a 30 min at 4°C. A antibody panel was used to identify and sort the CD3+CD8+ T cell population: Human TrueStain FcX (Biolegend; Cat# 422302), PE anti-human CD45 (Biolegend; Cat# 304008), FITC anti-human CD3 (Biolegend; Cat# 317306), APC/Cyanine7 anti-human CD235a (Biolegend; Cat# 349116), and APC anti-human CD8a (Biolegend; Cat# 300912). Sorting of single live CD3+CD8+ T cells (gating on Zombielow, hCD235a−, hCD45+, hCD3+, hCD8+) was performed using a Sony MA900 cell sorter. Cells were sorted into a 15mL tube containing DMEM with 10% FCS. After sorting, tubes with sorted cells were vortexed briefly, spun down at 1500rpm, 4°C for 5 minutes, resuspended, and counted for yield (Supplementary Fig. 16).
TotalSeq-C staining and Single-cell RNA sequencing procedure.
Sorted CD3+CD8+ T cells were washed and resuspended with staining buffer (PBSx1 + FCS 2.5% + 2mM EDTA). Next TruStain FcX (FC blocker, Biolegend; Cat# 422301) was added and the sample was incubated for 10 min at 4°C. After incubation with FcX blocker, the cells were washed with staining buffer once and spun down at 1500rpm, 4°C for 5 minutes. The cells were then incubated for 20 min at 4°C with the TotalSeq-C antibody mix: TotalSeq - C0048 anti-human CD45 Antibody (Biolegend; Cat# 368545), TotalSeq - C0103 anti-mouse/human CD45R/B220 (Biolegend; Cat# 103273), TotalSeq - C0087 anti-human CD45RO (Biolegend; Cat# 304259), and TotalSeq - C0063 anti-human CD45RA (Biolegend; Cat# 304163). Before adding the surface antibody mix, equal volumes of each antibody were combined and the mix was spun at 14,000rpm for 5min to remove aggregates. After staining the cells were washed twice with staining buffer, and a final wash was completed in DMEM with 10% FCS before counting. Single-cell RNA libraries were generated using the 10x Genomics Chromium Single Cell V(D)J Reagent Kit using 5’ v1 chemistry with Feature Barcode technology for Cell Surface Protein (10x Genomics; Cat# 1000080). After each step, cDNA generation, gene expression libraries, and cell surface protein libraries samples quality was assessed using the Qubit dsDNA high sensitivity kit (Invitrogen; Cat# Q32854) and the high sensitivity BioA DNA kit (Agilent; Cat# 5067–4626). Samples that passed quality control were sequenced on a NextSeq 500 sequencer (Illumina), using pair-end reads, with 26 reads for read 1 and 55 reads for read 2.
Multiplexed array assembly of cDNA libraries.
cDNA libraries were amplified using the following reaction conditions: 34μL of H2O, 25μL of Kapa HiFi Uracil+ ReadyMix (2X) (Roche #7959079001), 5μL of primer AAO272 (10μM, IDT), 5μL of primer AAO273 (10μM, IDT), and 6μL 10× 5’ cDNA library (~3ng/μL) and the following cycling conditions: 98 °C for 3 min, followed by 5 cycles of 98 °C for 20 s, 65 °C for 30 s and 72 °C for 8 min, followed by a final 72 °C extension for 10 min. Amplified libraries were purified using 0.7x SPRIselect (Beckman Coulter B23318) cleanup and quantified using Qubit (Thermo #Q32851). Libraries were further purified using 10μL (100μg) Dynabeads™ kilobaseBINDER™ (Thermo #60101) with final bead reconstitution in 40μL TE (Thermo #AM9849) after binding/washing. After streptavidin purification, 2ul of USER® Enzyme (M5505S) was added and incubated at 37 °C for 2 hours to uncouple the bound cDNAs from the beads. Following USER digestion, the reaction was placed on a magnet for 5 minutes, separating the beads and supernatant containing the cDNAs. The cDNA fraction was moved to a fresh tube and purified using 0.7x SPRIselect (Beckman Coulter B23318) cleanup. After cDNA purification, the following PCR master mix was assembled: 580μL of H2O, 750μL of Kapa HiFi Uracil+ ReadyMix (2X) (Roche #7959079001), and 20μL 10× 5’ cDNA library (~6ng/μL). 90μL of the mastermix was distributed in 15 PCR tubes, each containing 10μL of 5μM MAS-ISO-seq primer pair mix (Supplemental Table 1). The 15 reactions were then thermocycled with the following cycling conditions: 98 °C for 3 min, followed by 8 cycles of 98 °C for 20 s, 65 °C for 30 s and 72 °C for 8 min, followed by a final 72 °C extension for 10 min (optimal cycling number was identified using scaled down qPCR reaction). Reactions were then pooled in a 5 ml tube and purified using a 0.7x SPRIselect (Beckman Coulter B23318) cleanup and eluted in 450μL of TE. In a subsequent reaction, 15μL of USER® Enzyme (M5505S) was added to 435μL of the pooled product and set to incubate at 37 °C for 2 hours. Following USER digestion, 15 μL HiFi Taq DNA Ligase (M0647S) and 51 μL of HiFi Taq DNA Ligase buffer was added to the reaction and incubated in a thermocycler at 42 °C for 2 hours. Following ligation, the reaction was purified using a 0.7x AMPure PB Bead (Pacific Biosciences #100–265-90) cleanup and eluted in 180μL of H2O. Multiplexed array libraries were quantified using Qubit (Thermo #Q32851) and Genomic DNA ScreenTape (Agilent #5067– 5365).
SIRV-Set 4 cDNA generation.
SIRV-Set 4 (Lexogen #141.01) was thawed and aliquoted 1μL into each of 9 PCR tubes on ice. Following primary aliquoting, 2ul of Tris-EDTA pH7.0 was added to each tube and mixed. SIRV stocks were then frozen at −80 °C. For first strand synthesis, the following primary master-mix was set up: 15.5μL of H2O, 3.2μL of Polyethylene glycol 8,000 50% (w/v) (VWR #25322–68-3), 0.24μL Triton X-100 10% solution (Fisher #9002–93-1), 0.32μL SUPERase•In™ RNase Inhibitor (Thermo #AM2696), 1.6μL of dNTP mix 10mM (NEB #N0447S), 0.16μL OligodT primer 100μM (IDT) (SS3_OligodTVN for Smart-seq3 and MAS_OligodTVN for Iso-seq and MAS-ISO-seq) , 3μL of SIRV-Set 4 aliquot. Additionally, the following RT master-mix was assembled: 1.2μL of H2O, 0.8μL of Tris-HCl pH 8.5 (1M), 0.96μL of NaCl (1M), 0.8μL of MgCl2 (100mM), 0.32μL of GTP (100mM), 2.56μL of DTT (100mM), 0.4μL of SUPERase•In™ RNase Inhibitor (Thermo #AM2696), 0.64μL of TSO 100uM (IDT) (SS3_OligodTVN for Smart-seq3 and MAS_OligodTVN for Iso-seq and MAS-ISO-seq), 0.32μL of Maxima H-minus RT enzyme 200U/uL (Thermo #EP0751). Both primary and RT master-mixes were added to the thermocycler with the following conditions: 42 °C for 90 min, followed by 10 cycles of 50 °C for 2 min, 42 °C for 2 min, followed by a final 85 °C 5 min.
Smart-seq3 of SIRV-Set 4.
To amplify the cDNA, the cDNA generation reaction was added to straight into the following PCR mix: 26.5μL of H2O, 16μL of Kapa HiFi HotStart buffer (5X), 2.4μL of dNTP mix 10mM (NEB #N0447S), 0.4μL of MgCl2 (100mM), 0.4μL of fwd_primer 100μM (IDT), 0.8μL of rev_primer 10μM (IDT), 1.6μL of Kapa Hifi DNA polymerase (KK2103). The reaction was amplified using the following conditions: 98 °C for 3 min, followed by 13 cycles of 98 °C for 20 s, 65 °C for 30 s and 72 °C for 8 min, followed by a final 72 °C extension for 10 min. Amplified cDNA libraries were purified using 0.7x SPRIselect (Beckman Coulter B23318) cleanup and quantified using Qubit (Thermo #Q32851). Libraries were normalized to 0.1ng/μL and tagmented using the following reaction conditions: 7.56μL of H2O, 9μL of Tagmentation buffer 4x (Tris-HCl pH 7.5 (40mM), MgCl2 (20mM), DMF (20%)), 1.44μL Amplicon Tagmentation Mix (XYZ), 4μL of normalized cDNA libraries. Tagmentation reaction was mixed, spun down, then added to a thermocycler at 55 °C for 10 min. After tagmentation, 2μL of 2% SDS was immediately added and incubated for 5 min to halt the reaction. To the tagmented cDNA reactions, 6μL of nextera primer pair mixes (0.5μM) were added. Following addition of primers, the following PCR was assembled: 25.38 μL of H2O, 25.2μL of Phusion Buffer 5x (Thermo Scientific #F530L), 2.7μL of dNTP mix 10mM (NEB #N0447S), 0.72μL of Phusion High-Fidelity DNA Polymerase 2 U/μL and added to the thermocycler with the following conditions: 72 °C for 3 min, 98 °C for 3 min, followed by 12ncycles of 98 °C for 10 s, 55 °C for 30 s and 72 °C for 30 s, followed by a final 72 °C extension for 5 min. Amplified final libraries were purified using 0.7x SPRIselect (Beckman Coulter B23318) cleanup and quantified using Qubit (Thermo #Q32851) and Agilent High Sensitivity DNA kit for BioAnalyzer (Agilent #5067–4626). Libraries were sequenced on an Illumina NovaSeq 6000, using paired-end 150 read lengths.
Smart-seq3 short-read processing workflow
Aligning and stitching UMI-containing reads for SIRV isoform reconstruction.
We process Smart-seq3 SIRV Illumina paired-end reads closely following the procedure outlined in Ref. 6. We processed raw non-demultiplexed FASTQ files using zUMIs v2.9.4g and STAR v2.5.4b in order to generate expression profiles for both the 5′ UMI-containing and internal reads. To extract and identify the UMI-containing reads in zUMIs, we specified find_pattern: ATTGCGCAATG for the 5’ read together with base_definition: cDNA (23–150), UMI (12–19) in the configuration YAML file and collapsed UMIs within a Hamming distance of 1. In total, we obtained 3.1 × 10⁸ UMI-containing and 5.6 × 10⁷ internal reads. Next, we proceeded to stitch UMI-containing reads together using stitcher.py18 starting from the <prefix>.filtered.Aligned.GeneTagged.UBcorrected.sorted.bam output from zUMIs. In order to avoid UMI collision, we downsampled the aligned reads down to the 20% level prior to read stitching. We inferred the transcript compatibility set for each 5′ UMI-containing read from the CT tag in the produced BAM file. The most abundant transcript compatibility set was (SIRV201, SIRV202, SIRV205) which contained 7161 unique UMIs, which is still substantially below the UMI space size 48 = 65536, justifying our chosen read downsampling level (Supplementary Fig. 17). In total, stitcher.py reconstructed 1.35 × 10⁶ molecules. The median and interquartile range for reads/molecules were 8 and 24, respectively (Supplementary Fig. 18). Finally, we generated the transcript identification confusion matrix by iterating over all stitched 5’ reads, assuming a flat prior for both source and target transcripts, and accordingly dividing the assignment probability weight equally to all compatible source and target transcripts.
Quantification of SIRV isoforms.
Following the recommendation of Hagemann-Jensen, M. et al.6, we do not use UMIs to quantify isoform abundances. Instead, we used both 5’ UMI-containing and internal reads for quantification To this end, we ran salmon v1.5.1 in quantification mode with additional arguments “--minAssignedFrags 1 -l IU” on the previously obtained <prefix>.filtered.tagged.Aligned.toTranscriptome.out.bam transcriptome alignments from zUMIs without any downsampling. We read the TPM normalized abundances from the salmon_quant/quant.sf output table.
MAS-ISO-seq processing workflow
Error correction.
Error correction was performed on-board the PacBio Sequel IIe with the vendor’s ccs software v5.0.07 and settings “--all --subread-fallback --num-threads 232 --streamed <movie_name>.consensusreadset.xml --bam <movie_name>.reads.bam”. With these settings, all reads from the instrument (including those failing CCS correction) are presented in a single BAM19 file for downstream analysis. Each read is affixed with an auxiliary BAM tag “rq” indicating overall read quality ranging from 0 < rq < 0.99 for CCS-corrected reads with predicted accuracy < Q20, rq ≥ 0.99 for CCS-corrected reads with predicted accuracy ≥ Q20, and rq=−1 for CCS-uncorrected reads20.
Annotation/MAS-ISO-seq array filtration/segmentation/demultiplexing.
We developed a composite hidden Markov model toolkit (“Longbow”) to enable the per-read labeling of all subsequences of interest (annotation), allowing for insertions, deletions, and mismatches in both low and high error rate data. This toolkit is based on the open-source hidden Markov model library, pomegranate21. Our HMM formulation considers a MAS-ISO-seq read to be a mosaic of imperfect (but complete) copies of the various known adapter sequences among which the unknown cDNA sequences of interest are present. Given a predefined array and cDNA structure, we combined several instances of two probabilistic models for pairwise sequence alignment: the Needleman-Wunsch and random alignment models22. Needleman-Wunsch model sections support annotation of sequences known a priori (e.g., MAS-ISO-seq adapters; 10x Genomics single-cell 5’ and 3’ adapters). Two instances of the Needleman-Wunsch models were modified to account for expected sequence length (using duration modeling22) and used to model Poly-A tails and sequences of known length but unknown content (i.e., cell barcodes and unique molecular identifiers), respectively. Random alignment model sections support annotation of unknown interstitial sequences (i.e., cDNA sequences and unexpected nucleotide sequences resulting from sequencing or library construction errors/artifacts). All submodel termini are bi-directionally connected to a secondary random model, which may transition to any other Needleman-Wunsch model. This construction permits the HMM annotation to skip adapters erroneously absent from a read due to errors in array or cDNA synthesis for downstream filtering or examination.
The state transition diagram and default values for transmission and emission probabilities (used for all MAS-ISO-seq processing performed in this work) are provided in Supplementary Fig. 19. These defaults can optionally be refined using Longbow’s train command, which will estimate the parameters of the model using Baum-Welch learning.
Data processing proceeds as follows: Longbow annotations are generated for both the forward and reverse-complement orientations, retaining the result from the model with higher log-likelihood. Given the design expectation that MAS-ISO-seq adapters should be found in sequence along the length of the read, we verify that each read conforms to this expectation and filter out (via Longbow filter) any read with mis-ordered MAS-ISO-seq adapters. We then segment (via Longbow segment) each read between MAS-ISO-seq adapters and the 10x Genomics single-cell 5’ adapter. Finally, we filter (via Longbow sift) individual segmented reads by whether they conform to the structure of the expected library preparation (i.e. the cDNA library itself). Longbow sift enforces that all expected regions in a segmented read are present (i.e. a 10x Genomics single-cell 5’ adapter, a cell barcode, a UMI, the switch oligo leader sequence (“SLS”), cDNA, a poly(A) tail, and a 10x Genomics single-cell 3’ adapter). We apply this model to each segmented read and retain those that match this model (Longbow’s sift command, Supplementary Fig. 19).
For multiplexed libraries (e.g. libraries with different array configurations and run on the same flow cell), the demultiplexing workflow proceeds similarly to the procedure described above with one notable change: annotations are generated for both the forward and reverse-complement read orientations and over each user-specified array design. The annotations from the read orientation and array design that maximize the overall log-likelihood are propagated to subsequent steps.
SIRV isoform alignment.
To assign SIRV isoform to MAS-ISO-seq reads, we took reads (both CCS-corrected and CCS-uncorrected) that had been filtered, annotated, and segmented by Longbow and annotated their UMIs. We then removed the adapter sequences and poly-A tails from these reads. The resulting reads were aligned to the SIRV-Set 4 transcriptome using minimap2 v2.17-r94123 with the HiFi read preset (minimap2 -ayYL --MD --eqx -x asm20).
SIRV confusion matrix construction.
To generate the SIRV confusion matrix we first followed the steps for SIRV isoform alignment. We then generated the transcript identification confusion matrix by iterating over all read alignments, assuming a flat prior for both source and target transcripts, and accordingly dividing the assignment probability weight equally to all compatible source and target transcripts.
Quantification of SIRV isoforms.
To quantify SIRV isoforms, we first followed the steps for SIRV isoform alignment. We then took the primary alignments and removed any in which we could not detect a UMI as a quality control measure. Following Hagemann-Jensen, M. et al.6 we do not use UMIs to quantify isoform abundances and instead, we use salmon v1.5.1 in the long-read quantification mode with arguments “--minAssignedFrags 1 --dumpEqWeights -l U --ont”. The motivation for this choice is two-fold: (1) Here, our goal is to compare MAS-ISO-seq SIRV quantification with the matching Smart-seq3 short-read protocol (see Fig. 1c, d). The authors of Smart-seq3 recommend using salmon for quantification, utilizing both 5’ UMI-containing and internal reads. Indeed we found salmon quantification, compared to UMI-based quantification of stitched 5’ reads, substantially improved Smart-seq3 results. This is likely associated to the utilization of reliable sequencing bias models in salmon and the usage of internal reads; (2) The Smart-seq3 protocol uses a UMI length of 8 bp, which is long enough to avoid collisions when reads are stratified by cell barcodes in single-cell libraries. Our SIRV library, however, is too complex to allow avoiding UMI collision for several abundant ERCC transcripts, diminishing the utility of UMIs for quantifying the SIRV Set 4 data.
Cell Barcode (CBC) and UMI Annotation.
16-bp cell barcode (CBC) and 10-bp unique molecular identifier (UMI) sequence boundaries are approximately determined during read annotation with Longbow in accordance with the MAS-ISO-seq array design (Supplementary Fig. 19e). To ensure accurate boundary annotation for CBC error correction and UMI-based deduplication, additional post-processing considerations were applied as follows. First, putative CBC sequences were error-corrected against a list of expected barcodes (described below). Next, we aligned the error-corrected CBC to either the 80 bp (in the case of CCS-corrected reads) or 120 bp (in the case of CCS-uncorrected reads) on either end of each read using an accelerated Smith-Waterman algorithm, SSW (v1.2.4)24, to determine the 5’ boundary between the CBC and UMI. We then aligned the 13 bp sequence between the UMI and the cDNA, the switch oligo leader sequence (SLS) (TTTCTTATATGGG), to the 46 bp (2 * (UMI length + SLS length)) beyond the end of the CBC alignment read using SSW. The UMI was then identified as the sequence between the end of the CBC and start of the SLS and each read was tagged accordingly. Note that the length of the resulting UMI sequences can deviate from the expected 10 bp due to indel sequencing errors, errors in oligo synthesis, or a missing SLS. To handle the latter, we filtered out reads with SLS Smith-Waterman alignment scores below 10 and UMI lengths deviating from 10 bp by more than 3 bp for CCS-corrected reads and 4 bp for CCS-uncorrected reads.
In the case of SIRV data, no CBC was present in the library and therefore it was not annotated. The SIRV UMIs were similarly identified leveraging the structure of the array design. We first annotated each SIRV read with Longbow then counted bases from the end of the forward adapter to annotate each read with the UMI.
CBC Error Correction.
Correcting for potential CBC errors is a key step in single-cell data analysis, which we performed as follows. We first annotated each long read with a raw CBC as described earlier. We then padded the sequence of this raw CBC to include the adjacent 3 bp on either end. Next, we used a python implementation25 of the SymSpell26 symmetric delete spelling correction algorithm to correct all padded long read CBC sequences to a CBC whitelist identified from short read-data (Sample 1: ~695,000 entries, Sample 2: ~645000 entries). We did so by sliding a 16bp window across the padded CBC sequences and performing a lookup in the 10x CBC whitelist within a Levenshtein distance threshold of 2 for CCS-corrected reads and 3 for CCS-uncorrected reads for each such window. We then corrected the CBC to the 10x CBC sequence that had the lowest Levenshtein distance. In the event that no 10x CBC could be found within that Levenshtein distance or if multiple different 10x CBCs were found with the same minimum Levenshtein distance, the long read CBC was not corrected and the containing read was removed from further processing. We found that 97.2% and 96.3% of CCS-corrected reads and 72.2% and 71.12% of CCS-uncorrected reads (for Sample 1 and Sample 2 respectively) could be unambiguously corrected to a whitelisted CBC sequence. The lower CBC correction rate for CCS-uncorrected reads is expected given the conservative parameters deliberately chosen to minimize misassignment. We implemented this correction mechanism as the correct subcommand in Longbow.
Evaluating the Accuracy of CBC Identification and Error Correction.
Assigning CBC to reads and correcting for potential sequencing or segmentation errors is a multi-stage process involving several parameter choices, as described earlier. The overall “end-to-end” accuracy of CBC assignment can be effectively evaluated using species-mixing experiments27,28. Inspired by such experiments, we leveraged the presence of a small number of primary tumor cells in our sample (attributed to CD3+-CD8+ FACS sorting false positives) to evaluate the overall accuracy of MAS-ISO-seq CBC assignment as follows. First, we used short-read sequencing to identify high-purity tumor and immune cell barcodes. After removing doublets and potentially contaminated cells, we could identify 3336 high-purity immune and 101 high-purity tumor cell barcodes, along with a set of genes exhibiting mutually exclusive expression patterns across immune and tumor cells. Our criterion for mutual exclusivity was TPM < 1 in tumor cells and TPM > 100 in immune cells, or vice versa. We could identify 121 immune-specific and 100 tumor-specific such genes. Our criterion for barcode purity was the sum total of total off-target UMIs to be ≤ 1. The median UMI per cell in our short-read data was ~ 4,000, so the on-target gene expression purity in our selected cell barcodes was > 99.97%. Next, we studied the expression of the same genes in the same cell barcodes but in the MAS-ISO-seq data obtained from the same cDNA library. Cell barcode misidentification, sequencing errors, and inaccurate barcode error correction lead to random shuffling of reads between tumor and immune cells. Therefore, off-target counts of tumor genes in immune cells and vice versa can be used to estimate the rate of CBC misassignment. We note that this strategy is practically similar to the “capture-mark-recapture” method for estimating wildlife population sizes, where “capturing” and “marking” steps are done using high-fidelity short-read data, followed by “recapturing” in MAS-ISO-seq data. Supplementary Fig. 12 shows a scatter plot of total tumor gene expression vs. total immune gene expression in MAS-ISO-seq data for the predetermined set of high-purity barcodes using short-read data. Overall, we found 99.82% and 99.65% of reads assigned to tumor and immune cells to be on-target. These accuracy figures are slightly higher for CCS-corrected reads (99.86% and 99.80%, respectively) and only slightly lower for CCS-uncorrected reads (99.62% and 98.99%, respectively). Assuming that CBC errors occur at random with probability (per read) and independently of transcript identity, the odds of CBC misassignment can be straightforwardly estimated as follows:
where and denote the total number of reads mapping to tumor and immune genes but misassigned to (a predetermined set of) immune and tumor cell barcodes, * and *, respectively; and denote the total number of reads in the library mapping to tumor and immune genes, respectively; and denote the total number of reads assigned to cell barcode sets * and * , respectively; denotes the total number of sequenced reads. Using this formula, we obtain a CBC misassignment rate of 0.3% - 1.0% (or correct CBC assignment rate 99.0% - 99.7%) using either off-target tumor or immune genes as the error estimator.
UMI Error Correction.
Reads were first partitioned into groups, such that reads with the same CBC and transcript equivalence class (described below) were grouped together. UMI correction was then performed separately on each resulting read group. We formulated UMI correction as a minimum vertex cover problem on a bipartite graph G = (T, S, E), where T and S are two disjoint and independent sets of nodes and E is the set of edges, constructed as follows (Supplementary Fig. 20a). Let R be the set of reads in a given group, we defined the set of target nodes T to consist of all unique 3-tuple (UMI, cDNA length, GC content) combinations generated from the reads in R and the set of source nodes S to consist of all the reads in R. We then added an edge (s, t) ∈ E between a source node s and a target node t iff the following three conditions held: (1) the Levenshtein distance between the UMI of s and t was no greater than 2 for CCS-corrected reads and 3 for CCS-uncorrected reads, (2) the difference in cDNA length between s and t was no greater than 50 bp for CCS-corrected reads and 100 bp for CCS-uncorrected reads, and (3) the difference in GC content between s and t was no greater than 0.05 for CCS-corrected reads and 0.15 for CCS-uncorrected reads. The constraint parameters were selected to reflect the rate of indel sequencing errors and the empirical distributions of cDNA lengths and GC content of intra-group reads with identical UMIs. Under these constraints, an edge between a read and a target encoded the possibility that they represent the same molecule. Given the resulting graph, we applied an iterative greedy strategy to select the minimum subset of targets in T that cover all the read nodes in S. In particular, starting with the initial assignment, we iteratively chose the target in T with the highest degree (i.e. the greatest number of supporting reads). The UMIs of the reads assigned to each selected target were then corrected to the UMI with the maximal support in the group (in the case of ties, priority was given to UMIs closer in length to the expected 10 bp). Post correction, reads with UMIs deviating from the expected length of 10 bp by more than 3bp were filtered out. Such reads were found to be primarily missing either the UMI itself or the subsequent 13 bp switch leader sequence (TTTCTTATATGGG). Note this filtering criteria further restricted the admissible UMI lengths as compared to the pre-correction UMI-based filtering. Supplementary Fig. 20b shows the reduction in the number of UMIs before and after correction at each locus.
Quantification of 10x Genomics 5’ CD8+ T cell isoform expression.
To cross-annotate MAS-ISO-seq reads against a reference transcriptome (e.g. GENCODE) and to obtain a single-cell isoform count matrix, we took reads (both CCS-corrected and CCS-uncorrected) that had been annotated, filtered, and segmented by Longbow with CBCs and UMIs properly identified and error-corrected. We then extracted the cDNA bases from each read, thereby removing the library structure and Poly-A sequences (implemented in longbow extract). These resulting extracted reads were aligned to a version of the GRCh38 human reference genome with alternate contigs removed (GCA_000001405.15_GRCh38_no_alt_analysis_set.fa) using minimap2 v2.24-r1122 with the splicing preset (for CCS-corrected reads: minimap2 -ayYL --MD --eqx -x splice:hq, for CCS-uncorrected reads: minimap2 -ayYL --MD --eqx -x splice).
We then filtered these aligned reads, removing unmapped reads, reads with secondary or supplementary alignments, reads with mapping quality of 0, reads with length > 15 kb, and reads with clipping on either end of length > 1 kb. We then processed the resulting reads with StringTie2 v2.2.112 using GENCODE v3729 as baseline transcript annotations to create new transcriptome annotations specific to each of our samples (stringtie -Lv -G gencode.v37.primary_assembly.annotation.gtf -o annotations.gtf -A gene_abund.out).
We developed a graph-based algorithm to accurately characterize and quantify isoform expression. First, we converted the aligned reads to genome interval annotations in gff format using spliced_bam2gff v1.3 (https://github.com/nanoporetech/spliced_bam2gff) (spliced_bam2gff -S -M aligned_reads.bam > aligned_reads.gff). We then performed comparisons between the GENCODE transcriptome annotations, the novel transcriptome annotations, and the aligned read annotations using gffcompare v0.12.630. These comparisons were (base vs query): novel transcriptome vs GENCODE, GENCODE vs novel transcriptome, aligned reads vs GENCODE, aligned reads vs novel transcriptome (gffcompare -V -r base.gff -s base.fasta query_gff_name). These comparisons resulted in relationships between each query interval and the intervals in the given base file.
We assembled a directed multi-graph using the output of these comparisons where each node is a transcript or read. The edges represent the relationships produced by gffcompare between each node (including the gffcompare classification codes) and edge direction is query node to base node. We first assigned gene names to the novel transcriptome reads by traversing edges between the novel transcript nodes and the GENCODE nodes to create a set of gene name / classification code pairs. If this set of pairs contained a single pair with a classification code of `=`, this was used as the gene name for the novel transcript node. Otherwise, we assign a gene equivalence class to the novel transcript node, which is composed of all accumulated gene name / classification code pairs (Algorithm 3 in Supplementary Note 1). Once these gene names / equivalence classes were identified, the novel transcript nodes in the graph were updated with their new gene assignments. To assign gene names to each read, we followed similar steps but traversed edges from read nodes to both novel transcript nodes and GENCODE nodes to create the pair set. To assign transcripts to each read, we performed a traversal similar to the gene assignment process for each read, but created transcript ID / classification code pairs. This resulted in transcript equivalence classes for each read. These equivalence classes either contain no transcript assignment, one transcript assignment (with classification code), or multiple transcript assignments (with classification codes; see Algorithm 4 in Supplementary Note 1). For additional details on the graph construction method, see Supplementary Note 1 and Supplementary Fig. 10.
Following the assignment of a transcript equivalence class to each MAS-ISO-seq read, we created a count matrix by tallying for each transcript equivalence class and CBC combination how many unique UMI occurrences there were. Using this equivalence class formulation enabled improved and automated processing of isoform expression data compared to direct alignment to either GENCODE or StringTie2-derived transcriptomes (Supplementary Fig. 12).
Single cell analysis
Short-read 10x Genomics 5’ gene expression and antibody capture preprocessing.
We quantified the produced 5’ RNA capture and TotalSeq-C antibody capture libraries using Cell Ranger v3.1.0 count workflow. We imported the count data into AnnData format using scanpy v1.7.2 read_10x_h5 command. Our preliminary investigations indicated that the Cell Ranger automatic cell identification algorithm had used an excessively conservative cutoff, leading to the loss of 30%–50% viable non-empty droplets (primarily of stem-like memory T cells origin, a cell type that exhibits relatively lower transcriptional complexity). As a countermeasure, we loaded the raw count data from Cell Ranger count output raw_feature_bc_matrix.h5 and kept every droplet expressing > 500 unique genes and > 80% non-mitochondrial genes. We performed a preliminary round of clustering and differential gene expression analysis using scanpy standard workflow31. We identified and removed non-immune cell clusters of likely primary tumor origin. We additionally identified and removed doublets using scrublet v0.2.3. The estimated doublet rate was 14%, which is the expected figure for loading ~10,000 cells. Finally, we log-transformed the antibody capture counts and treated them as cell-level annotations for the rest of the analysis.
Long-read single-cell MAS-ISO-seq isoform expression preprocessing.
As a first step, we converted the transcript equivalence class-level UMI count matrix produced by the MAS-ISO-seq workflow to an AnnData object. During this conversion, additional metadata was added to the counts. Many of the novel transcripts and genes discovered by StringTie2 could be unambiguously assigned back to a GENCODE annotation. In particular, novel genes were assigned to known genes in GENCODE v37 if the novel genes had transcripts overlapping exactly one unique gene in GENCODE v37. In addition, an interval list containing T cell receptor genes32 was cross-referenced and transcripts found overlapping these intervals were accordingly marked. To harmonize the long- and short-read AnnData objects for joint analyses, we only kept the mutual cell barcodes between the two datasets. We could identify 100% of T cell barcodes identified from the short-read dataset in the MAS-ISO-seq long-read dataset, indicating the high fidelity of our CBC error correction algorithm.
Normalization, clustering, and embedding.
We imported the harmonized short- and long-read AnnData objects to seurat v4.0.3 using SeuratData v0.2.1 and SeuratDisk v0.0.0.9015 helper packages33. We performed a negative binomial (NB) variance-stabilizing transformation (VST) on each count dataset separately using sctransform v0.3.2. We treated transcript equivalence class counts similarly to gene counts, which is justified since transcript equivalence class counts exhibit the same class of technical noise and statistical dropout as gene counts. Given the much larger number of transcript equivalence classes, we found it necessary to increase the number of transcript equivalence classes used for training the NB model from the default value of 2,000 to 10,000. We did not notice any substantial change in the downstream results by increasing this figure any further. The Pearson residuals for all cells and genes were exported to AnnData. We performed clustering and embedding separately for short- and long-read datasets using the same workflow as follows. We selected the top 5,000 genes (or isoforms) sorted in the descending order of total Pearson residual as highly variable features (HVF). The HVFs were z-scored independently to equalize the role of each gene (or isoform). We reduced the feature set down to 30 using PCA and calculated the k=100 nearest neighbor graph for each cell in the PCA space based on the Euclidean distance. The resultant neighbor graph was used for obtaining a 2D embedding using UMAP, and clustering using the Leiden algorithm with resolution parameter set to 1.1. We performed differential gene expression (DE) analysis on the short-read dataset based on t-test, which is an appropriate statistical test for VST counts, as implemented in scanpy rank_genes_groups method. The DE genes were used for annotating the clusters shown in Fig. 2 using known T cell subtype markers.
Diffusion pseudotime analysis.
We performed diffusion pseudotime (DPT) analysis closely following the scanpy hematopoiesis trajectory analysis workflow34 with one notable modification. We noticed that using scaled highly-variable Pearson residuals in place of log-transformed counts resulted in cleaner force-directed graphs. The latter is expected given that Pearson residuals are more Gaussian-like compared to log-transformed counts, and thus, better suited to the assumptions of the DPT model. Accordingly, we substituted the standard preprocessing and normalization step with the sctransform workflow.
Annotating CD45 isoforms.
The GENCODE v37 human transcriptome reference contains a rather extensive set of isoform annotations for CD45, including the RO, RABC, RB, RBC, and RAB. These annotations, however, are frequently incomplete and miss a large portion of the coding sequences. For instance, out of the available annotations for PTPRC (CD45), only two (ENST00000348564: CD45RO and ENST00000442510: CD45RABC) extend all the way to the 3’ UTR (Supplementary Fig. 11a). Given the primarily short-reads origin of currently available transcriptome annotations, we expect this caveat to prevail among most other genes, as also indicated by other authors35,36. Incompleteness and truncation of reference isoform annotations can turn into a source of quantification bias. For instance, when we attempted to directly align MAS-ISO-seq reads to the GENCODE v37 reference, we noticed that the aligner (minimap2) preferred the more complete and longer annotations, ENST00000348564 (CD45RO) and ENST00000442510 (CDRABC), as the primary alignment target for the vast majority of CD45 reads, irrespective of the differential inclusion or exclusion of shorter but biologically relevant exons such as the A, B, and C. This strong alignment bias masks the alternative splicing pattern of CD45 expected in different T cell subtypes (Supplementary Fig. 21). We found utility in refining GENCODE annotations using StringTie2, which resulted in the extension of several incomplete GENCODE annotations and improved the specificity of isoform assignments to different CD8+ T cell subtypes (Supplementary Fig. 11b).
Our proposed transcript annotation and quantification workflow combines the higher fidelity of StringTie2 transcript definitions with the diversity, naming convention, and community consensus of transcript definitions published by the GENCODE consortium. As detailed earlier, we align MAS-ISO-seq reads to the reference genome using the splice-aware minimap2 aligner, cross-reference every read against both GENCODE and StringTie2 transcript definitions, and assign a transcript equivalence class (TEC) to each read. Truncated reads, e.g. due to strand invasion or internal poly-A priming, are typically assigned to richer TECs involving many compatible annotations whereas full-length reads are assigned to narrower classes (Supplementary Fig. 10). Depending on the nature of the desired downstream analysis, TECs involving unambiguous splice junction patterns can be readily identified and ambiguous TECs can be neglected. We applied this strategy to quantify CD45 isoforms and achieved substantially higher isoform assignment specificity compared to direct alignment to either GENCODE or StringTie2-derived annotations (Supplementary Fig. 11c). The results shown in Fig. 2b, c are based on this automated workflow.
Finally, highest specificity in isoform assignment can be achieved by processing the genomic alignment of each read using a decision tree to bucket reads according to presence/absence of manually specified landmark exons, e.g. A, B, and C in CD45 (Supplementary Fig. 11d). This quantification strategy, while achieving slightly higher specificity compared to our automated workflow, is not scalable or suitable for genome-wide studies. In summary, leveraging the increased read depth afforded by MAS-ISO-seq, we find improving algorithms for de novo isoform identification and clustering, and benchmarking the available isoform quantification pipelines (e.g. FLAIR36, TALON37, etc.), and producing more complete transcriptome annotation references to be crucial areas of future method and resource development.
Quantifying the impact of the sequencing depth via downsampling.
We quantify the impact of the sequencing depth gained by MAS-ISO-seq on cell type clustering and identification of differentially expressed and spliced genes by performing a series of in silico downsampling experiments from a single MAS-ISO-seq run. More explicitly, we took the set of all deconcatenated MAS-ISO-seq transcripts from “Sample 2” (37,164,708 full-length transcripts, comprising 22,613,229 CCS-corrected and 14,551,479 CCS-uncorrected reads; see Supplementary Fig. 8) and randomly subsampled this set to obtain 1M, 3M, 5M, 10M, 20M, and 30M transcripts. The standard Iso-Seq protocol yields 2M - 4M HiFi reads (CCS-corrected and rq ≥ 0.99). This read-depth range is indicated in Fig. 2g with gray shading for reference. We processed each subsampled dataset identically using the same quantification, normalization, clustering, and embedding workflow. We computed the adjusted Rand index (ARI) between the cell clustering of each subsampled long-read dataset and the full short-read dataset as follows. Since the appropriate cell clustering resolution is practically chosen in relation to biological considerations and varies with sequencing depth, we determined the cell clustering resolution for each downsampled long-read dataset by sweeping a Leiden clustering resolution range (0.5 to 2.0) and identifying the resolution that maximized ARI concordance with the fixed reference short-read cell clustering. We also determined the number of differentially expressed and differentially spliced genes across the T cell subtypes for each downsampling run. The results of this analysis are shown in Fig. 2g and Supplementary Fig. 15.
Identification of differentially spliced genes.
We consider two types of differential splicing (DS) statistical tests for every expressed gene. (global DS test) First, we wish to determine whether the isoforms of a given gene are differentially expressed in different cell clusters. To this end, we produce a contingency table with transcript equivalence class counts and cell clusters as rows and columns, and with the aggregated isoform expression counts as entries. A non-trivial global DS pattern is equivalent to having a statistical dependence between the columns and rows of this contingency table. The latter can be canonically assessed using Fisher’s exact test generalized to arbitrary contingency tables with . Notably, we found the requirements for fast Chi-squared asymptotic approximation to be out of reach for the majority of cases. Therefore, we use the fisher.test as implemented in R v4.1.1 to perform the test using permutations. (cluster-resolved DS test) We additionally perform a cluster-resolved DS test for every gene, whereby we wish to know whether a gene exhibits differential isoform usage in each of the clusters vs. the rest. Like before, we form a contingency table with two columns (the cluster of interest, and the rest), with aggregated transcript equivalence class counts in rows. We similarly obtained a p-value by performing a permutation-based Fisher’s test for every gene and every cluster. Finally, for both tests, we treat the obtained p-values as a collection of independent hypotheses and adjust the p-values for false discovery rate (FDR) at level using the Benjamini-Hochberg step-up procedure.
Supplementary Material
Acknowledgments:
We thank W. Kretzschmar for helpful discussions. This work was supported by Broad Institute SPARC awards #800353 (A.M.A., K.V.G., N.H., and P.B.) and #800307 (K.V.G.); National Institutes of Health grants U19 AI082630 (N.H.), Adelson Medical Research Foundation (N.H.), National Human Genome Research Institute grants RM1HG006193 (N.H., P.C.B.), with additional support from the Center for Cell Circuits at the Broad Institute (HG006193). M.A.S. is a Cancer Research Institute Irvington Fellow supported by the Cancer Research Institute (CRI Award 4071).
Footnotes
Competing interests statement:
The authors declare the following competing interests:
The following provided funding that contributed to the subject matter of this manuscript: Broad Institute SPARC award, National Institutes of Health grants U19 AI082630, Adelson Medical Research Foundation, National Human Genome Research Institute grants RM1HG006193, support from the Center for Cell Circuits at the Broad Institute (HG006193), and Cancer Research Institute award 4071.
A.M.A., K.V.G., J.S., M.B., P.C.B., and N.H. are inventors on a licensed, pending international patent application, having Serial Number PCT/US2021/037226, filed by Broad Institute of MIT and Havard, Massachusetts General Hospital and Massachusetts Institute of Technology, directed to certain subject matter related to the MAS-seq method described in this manuscript.
Broad Institute of MIT and Harvard and Pacific Biosciences of California Inc. entered into a collaboration agreement relating to this research subsequent to the submission of this manuscript.
A.A.P. is a Venture Partner and Employee of GV. He has received funding from Verily, Microsoft, Illumina, Bayer, Pfizer, Biogen, Abbvie, Intel, and IBM.
M.S.F. receives funding from Bristol-Myers Squibb.
G.M.B. has served on SAB and on the steering committee for Nektar Therapeutics. She has SRAs with Olink proteomics and Palleon Pharmaceuticals. She served on SAB and as a speaker for Novartis.
N.H. holds equity in BioNTech and is a founder and equity holder of Danger Bio.
P.C.B. is a consultant to and/or holds equity in companies that develop or apply genomic or genome editing technologies: 10X Genomics, General Automation Lab Technologies/Isolation Bio, Celsius Therapeutics, Next Gen Diagnostics LLC, Cache DNA, Concerto Biosciences, Stately Bio, Ramona Optics, Bifrost Biosystems, and Amber Bio. P.C.B.’s group receives research funding from industry for unrelated work.
The remaining authors declare no competing interests.
Code Availability:
An online repository of code for the Longbow tool used in this study can be found at https://github.com/broadinstitute/longbow.
Data Availability:
Links to the datasets used in this study can be found at https://github.com/broadinstitute/mas-seq-paper-data. Human tumor-infiltrating CD8+ T cells single-cell RNA sequencing data are available from dbGAP with accession number phs003200.v1.p1.
References:
- 1.Hardwick SA, Joglekar A, Flicek P, Frankish A & Tilgner HU Getting the Entire Message: Progress in Isoform Sequencing. Front. Genet. 10, 709 (2019). [DOI] [PMC free article] [PubMed] [Google Scholar]
- 2.Baralle FE & Giudice J Alternative splicing as a regulator of development and tissue identity. Nat. Rev. Mol. Cell Biol. 18, 437–451 (2017). [DOI] [PMC free article] [PubMed] [Google Scholar]
- 3.Scotti MM & Swanson MS RNA mis-splicing in disease. Nat. Rev. Genet. 17, 19–32 (2015). [DOI] [PMC free article] [PubMed] [Google Scholar]
- 4.Dvinge H, Kim E, Abdel-Wahab O & Bradley RK RNA splicing factors as oncoproteins and tumour suppressors. Nat. Rev. Cancer 16, (2016). [DOI] [PMC free article] [PubMed] [Google Scholar]
- 5.Kanitz A et al. Comparative assessment of methods for the computational inference of transcript isoform abundance from RNA-seq data. Genome Biol. 16, 1–26 (2015). [DOI] [PMC free article] [PubMed] [Google Scholar]
- 6.Hagemann-Jensen M et al. Single-cell RNA counting at allele and isoform resolution using Smart-seq3. Nat. Biotechnol. 38, 708–714 (2020). [DOI] [PubMed] [Google Scholar]
- 7.Wenger AM et al. Accurate circular consensus long-read sequencing improves variant detection and assembly of a human genome. Nat. Biotechnol. 37, 1155–1162 (2019). [DOI] [PMC free article] [PubMed] [Google Scholar]
- 8.Volden R et al. Improving nanopore read accuracy with the R2C2 method enables the sequencing of highly multiplexed full-length single-cell cDNA. Proc. Natl. Acad. Sci. U. S. A. 115, 9726–9731 (2018). [DOI] [PMC free article] [PubMed] [Google Scholar]
- 9.Baid G et al. DeepConsensus improves the accuracy of sequences with a gap-aware sequence transformer. Nat. Biotechnol. (2022) doi: 10.1038/s41587-022-01435-7. [DOI] [PubMed] [Google Scholar]
- 10.Buschmann Tilo <tilo. buschmann. ac@gmail.com>. DNABarcodes. (Bioconductor, 2017). doi: 10.18129/B9.BIOC.DNABARCODES. [DOI] [Google Scholar]
- 11.Paul L et al. SIRVs: Spike-In RNA Variants as External Isoform Controls in RNA-Sequencing. bioRxiv 080747 (2016) doi: 10.1101/080747. [DOI] [Google Scholar]
- 12.Kovaka S et al. Transcriptome assembly from long-read RNA-seq alignments with StringTie2. Genome Biol. 20, 278 (2019). [DOI] [PMC free article] [PubMed] [Google Scholar]
- 13.Oberdoerffer S et al. Regulation of CD45 Alternative Splicing by Heterogeneous Ribonucleoprotein, hnRNPLL. Science 321, 686–691 (2008). [DOI] [PMC free article] [PubMed] [Google Scholar]
- 14.Bio-Rad. CD45 characterization & Isoforms - Mini-review. https://www.bio-rad-antibodies.com/cd45-characterization-isoforms-structure-function-antibodies-minireview.html.
- 15.Zheng Y-F et al. HIT-scISOseq: High-throughput and High-accuracy Single-cell Full-length Isoform Sequencing for Corneal Epithelium. bioRxiv 2020.07.27.222349 (2020) doi: 10.1101/2020.07.27.222349. [DOI] [Google Scholar]
- 16.Schlecht U, Mok J, Dallett C & Berka J ConcatSeq: A method for increasing throughput of single molecule sequencing by concatenating short DNA fragments. Sci. Rep. 7, 1–10 (2017). [DOI] [PMC free article] [PubMed] [Google Scholar]
- 17.Kanwar N, Blanco C, Chen IA & Seelig B PacBio sequencing output increased through uniform and directional fivefold concatenation. Sci. Rep. 11, 1–13 (2021). [DOI] [PMC free article] [PubMed] [Google Scholar]
Methods references:
- 18.Larsson AJM & Sandberg R stitcher.py. (2020). doi: 10.5281/zenodo.3765223. [DOI] [Google Scholar]
- 19.Li H et al. The Sequence Alignment/Map format and SAMtools. Bioinformatics 25, 2078 (2009). [DOI] [PMC free article] [PubMed] [Google Scholar]
- 20.Pacific Biosciences, Inc. What is in the reads.bam? CCS Docs https://ccs.how/faq/reads-bam.html. [Google Scholar]
- 21.Schreiber J Pomegranate: fast and flexible probabilistic modeling in python. arXiv [cs.AI] (2017). [Google Scholar]
- 22.Durbin R, Eddy SR, Krogh A & Mitchison G Biological Sequence Analysis. Preprint at 10.1017/cbo9780511790492 (1998). [DOI] [Google Scholar]
- 23.Li H Minimap2: pairwise alignment for nucleotide sequences. Bioinformatics 34, 3094–3100 (2018). [DOI] [PMC free article] [PubMed] [Google Scholar]
- 24.Zhao M, Lee W-P, Garrison EP & Marth GT SSW Library: An SIMD Smith-Waterman C/C++ Library for Use in Genomic Applications. PLoS One 8, e82138 (2013). [DOI] [PMC free article] [PubMed] [Google Scholar]
- 25.mammothb. symspellpy. (2021).
- 26.Garbe W 1000x Faster Spelling Correction algorithm. (2012).
- 27.Macosko EZ et al. Highly Parallel Genome-wide Expression Profiling of Individual Cells Using Nanoliter Droplets. Cell 161, 1202–1214 (2015). [DOI] [PMC free article] [PubMed] [Google Scholar]
- 28.Klein AM et al. Droplet barcoding for single-cell transcriptomics applied to embryonic stem cells. Cell 161, 1187–1201 (2015). [DOI] [PMC free article] [PubMed] [Google Scholar]
- 29.Frankish A et al. GENCODE 2021. Nucleic Acids Res. 49, D916–D923 (2021). [DOI] [PMC free article] [PubMed] [Google Scholar]
- 30.Pertea G & Pertea M GFF Utilities: GffRead and GffCompare. F1000Res. 9, 304 (2020). [DOI] [PMC free article] [PubMed] [Google Scholar]
- 31.Wolf Alex, Ramirez Fidel, Rybakov Sergei. Preprocessing and clustering 3k PBMCs. Scanpy documentation https://scanpy-tutorials.readthedocs.io/en/latest/pbmc3k.html. [Google Scholar]
- 32.HGNC. Gene group: T cell receptors (TR). HUGO Gene Nomenclature Committee https://www.genenames.org/data/genegroup/#!/group/370. [Google Scholar]
- 33.Hao Y et al. Integrated analysis of multimodal single-cell data. Cell 184, 3573–3587.e29 (2021). [DOI] [PMC free article] [PubMed] [Google Scholar]
- 34.Wolf Alex, Ramirez Fidel, Rybakov Sergei. Trajectory inference for hematopoiesis in mouse. Scanpy documentation https://scanpy-tutorials.readthedocs.io/en/latest/paga-paul15.html. [Google Scholar]
- 35.Glinos DA et al. Transcriptome variation in human tissues revealed by long-read sequencing. bioRxiv 2021.01.22.427687 (2021) doi: 10.1101/2021.01.22.427687. [DOI] [PMC free article] [PubMed] [Google Scholar]
- 36.Tang AD et al. Full-length transcript characterization of SF3B1 mutation in chronic lymphocytic leukemia reveals downregulation of retained introns. Nat. Commun. 11, 1–12 (2020). [DOI] [PMC free article] [PubMed] [Google Scholar]
- 37.Seki M, Oka M, Xu L, Suzuki A & Suzuki Y Transcript Identification Through Long-Read Sequencing. Methods Mol. Biol. 2284, 531–541 (2021). [DOI] [PubMed] [Google Scholar]
Associated Data
This section collects any data citations, data availability statements, or supplementary materials included in this article.
Supplementary Materials
Data Availability Statement
Links to the datasets used in this study can be found at https://github.com/broadinstitute/mas-seq-paper-data. Human tumor-infiltrating CD8+ T cells single-cell RNA sequencing data are available from dbGAP with accession number phs003200.v1.p1.