

Abstract
Objective
To validate the Iranian Brain Imaging Database (IBID) for dementia-free status in middle-aged to older adults (over 55 years old) by comparing dementia probability metrics with Alzheimer’s disease (AD) patients from the Alzheimer’s Disease Neuroimaging Initiative (ADNI).
Methods
This cross-sectional study included 41 cognitively normal participants from IBID (age > 55 years; median (IQR) = 64 (62, 68) years; females = 51.2%) and 41 age/sex-matched AD patients from ADNI (age > 55 years; median (IQR) = 69 (62, 71) years; females = 53.7%). High-resolution 3D T1-weighted MPRAGE MRI data were harmonized across Siemens 3.0 Tesla scanners, preprocessed via the AssemblyNet-AD pipeline (volBrain), and analyzed for grading scores and hippocampal-amygdalo-ventricular atrophy scores (HAVAs), along with hippocampus, amygdala, and inferior lateral ventricle atrophy scores. Non-parametric Mann–Whitney U tests were used to compare group differences, and quantile regression (25th, 50th, and 75th quantiles) model atrophy severity-dependent associations.
Results
IBID participants exhibited minimal dementia probability (median grading score = 0.20% vs. ADNI = 99.93%; U = 84.0, p < 0.0001) and markedly lower atrophy across all regions (HAVAs: 14.76 vs. 86.41; U = 75.0, p < 0.0001), with non-overlapping interquartile ranges. Quantile regression revealed stable hippocampal contributions (q₀.₅ coefficient = 0.311, p < 0.001) and increasing group disparities at higher atrophy severities (q₀.₇₅: IBID vs. ADNI coefficient = − 11.82, p < 0.001).
Conclusion
We provided validated dementia-free IBID neuroimaging data to distinguish normal aging from dementia-AD status.
Graphical Abstract

Keywords: Neuroimaging, MRI, Aging, Alzheimer's disease, Structural atrophy, Dementia-free classification
Introduction
Dementia, particularly Alzheimer’s disease (AD), represents a significant global health challenge, with an estimated 50 million people affected worldwide, and a number projected to triple by 2050 [1]. Neuroimaging, particularly magnetic resonance imaging (MRI), plays a pivotal role in identifying subtle structural brain alterations associated with cognitive decline, enabling the differentiation of pathological atrophy from normal aging [2]. Structural atrophy patterns in regions such as the hippocampus, amygdala, and lateral ventricles are critical biomarkers for early detection and monitoring of AD [3]. However, distinguishing age-related changes from neurodegenerative pathology remains a challenge, especially during the transitional period from middle age to older adulthood (approximately 50–70 years) when early deviations from normative aging may signal preclinical dementia [4, 5].
The Iranian Brain Imaging Database (IBID) [6], initiated in 2017, addresses the scarcity of population-specific neuroimaging reference data for underrepresented regions. Similarly, large-scale initiatives, such as the Alzheimer's Disease Neuroimaging Initiative (ADNI), have advanced our understanding of AD-specific atrophy patterns [7]. However, the generalizability of these findings to diverse populations remains unclear. Standardized novel atrophy metrics, such as the hippocampal-amygdalo-ventricular atrophy score (HAVAs) [3] and The grading score [8], are essential for distinguishing AD pathology from ageingl aging.
This study aimed to rigorously validate the dementia-free status of the IBID cohort by comparing structural atrophy patterns and dementia probability metrics, including grading scores, HAVAs, and subregional atrophy in the hippocampus, amygdala, and inferior lateral ventricles, with those of patients clinically diagnosed with AD from ADNI. By focusing on a middle-aged to older adult cohort, this study addresses the need for validated, population-specific neuroimaging data, providing a crucial step for future research on brain aging in underrepresented populations.
Methods
Sample and ethics approval
A convenience sample was utilized for the IBID cohort. The AssemblyNet-AD approach requires subjects to be over 55 years old; therefore, data from healthy individuals for this study were sourced from the IBID [6], which was approved by the Ethics Committee of the Tehran University of Medical Sciences and the National Institute for Medical Research Development (NIMAD) in Tehran, Iran (Ethical Code: IR.NIMAD.REC.1396.319), in accordance with the Declaration of Helsinki. Furthermore, the data used in the preparation of this article were obtained from the ADNI database (adni.loni.usc.edu). The ADNI was launched in 2003 as a public–private partnership, led by Principal Investigator Michael W. Weiner, MD. The primary goal of ADNI has been to test whether serial MRI, positron emission tomography (PET), other biological markers, and clinical and neuropsychological assessments can be combined to measure the progression of mild cognitive impairment (MCI) and early AD.
Thus, cognitively normal participants were selected from the IBID. Their dementia-free status was established based on the comprehensive neuropsychiatric assessments of the IBID protocol, which is designed to recruit healthy individuals. Patients with a clinical diagnosis of AD were selected from the ADNI database. In addition, the diagnosis of AD in the ADNI cohort is based on rigorous and standardized clinical, cognitive, and neuropsychological assessments established by the initiative's protocols.
Imaging data and image analysis
IBID data at the Iranian National Brain Mapping Laboratory: High-resolution three-dimensional T1-weighted (T1-w) MPRAGE MRI scans were performed using a Siemens Prisma 3.0 Tesla scanner (2016) with a 64-channel head coil. Referring to the comprehensive imaging protocol [6]. The AD T1-w MPRAGE data (participants over 55 years old) used in this study were obtained from the ADNI database. To minimize the impact of scanner variability, including differences in field strength and scanner, between our IBID data and the ADNI data, we utilized only 3.0 Tesla and Siemens data, with a particular focus on Prisma scanners. Detailed protocols for MRI acquisition are publicly available at https://adni.loni.usc.edu/data-samples/adni-data/neuroimaging/mri/mri-scanner-protocols/ and have been extensively described in prior publications [9–11]. The original MRI data were retrieved from the Laboratory of Neuro Imaging Image and Data Archive (https://ida.loni.usc.edu) on February 19, 2024. All data were accessed in compliance with the ADNI’s data usage agreements.
The dcm2nii software, a component of the MRICRON suite (https://www.nitrc.org/projects/dcm2nii/), was used to convert T1-w data from DICOM to NIFTI format while ensuring data anonymization. Subsequently, all T1-w images were meticulously reviewed to confirm the isotropic structure and standardized using FreeSurfer’s mri_convert tool, which resampled the data into 1 mm3 isotropic voxels. This process ensured spatial consistency in subsequent analyses [12, 13]. Then, the AssemblyNet-AD pipeline for predicting AD was executed using the cloud-based volBrain platform (https://volbrain.net/). Neuroanatomical segmentation was performed using AssemblyNet [14], which separates the brain into distinct regions for all T1-w data. To ensure high-quality image-to-template affine registration, we employed a deep quality control process using the RegQCNET [13]. The grading score [8], along with the HAVAs [3], was derived from both normative and AD lifespan models. The grading score provides a general probability of an individual having dementia based on a holistic assessment of brain anatomy, while the HAVAs model specifically quantifies atrophy by integrating the volumes of the most discriminative neuroanatomical structures—namely, the amygdala, hippocampus, and inferior lateral ventricle—to differentiate patients with AD from cognitively normal individuals [3]. Both resulting scores were expressed as the probability of dementia (%), providing a continuous measure of neurodegenerative severity.
Statistical analyses
Data distributions were assessed for normality using the Shapiro–Wilk test, which indicated non-normal distributions (p < 0.05). Consequently, non-parametric Mann–Whitney U tests were used to compare group differences in demographics (age, sex), dementia probability (grading score), and atrophy metrics (HAVAs, hippocampus, amygdala, and inferior lateral ventricular scores) between the IBID and ADNI cohorts. Effect sizes were reported as Z-scores and significance thresholds were established at p < 0.01. To further characterize the relationship between regional atrophy measures and HAVAs across varying severity levels, quantile regression models were fitted at the 25th, 50th (median), and 75th quantiles using the simplex algorithm. These models included hippocampal, amygdalar, and inferior lateral ventricular atrophy scores as covariates, with group membership (IBID vs. ADNI) serving as the primary predictor. Standard errors were estimated via IID (independent and identically distributed) bootstrap resampling with Bofinger bandwidth, and 95% confidence intervals were calculated for parameter estimates. The model fit was evaluated using pseudo R2 and mean absolute error (MAE). All analyses were performed using SPSS (version 27.0).
Results
Overview of results
The AssemblyNet-AD pipeline was applied to IBID and ADNI data (Fig. 1). This study included 41 cognitively normal participants from the IBID cohort and 41 patients diagnosed with AD from the ADNI cohort. Demographic comparisons revealed no statistically significant differences in age (IBID: median = 64 years, IQR = 62–68 years; ADNI: median = 69 years, IQR = 62–71 years; p = 0.055) or sex distribution (IBID: 51.2% female; ADNI: 53.7% female; p = 0.083) between the two groups (Table 1). The dementia probability and structural atrophy metrics for the IBID and ADNI cohorts have been reported (Table 2).
Fig. 1.
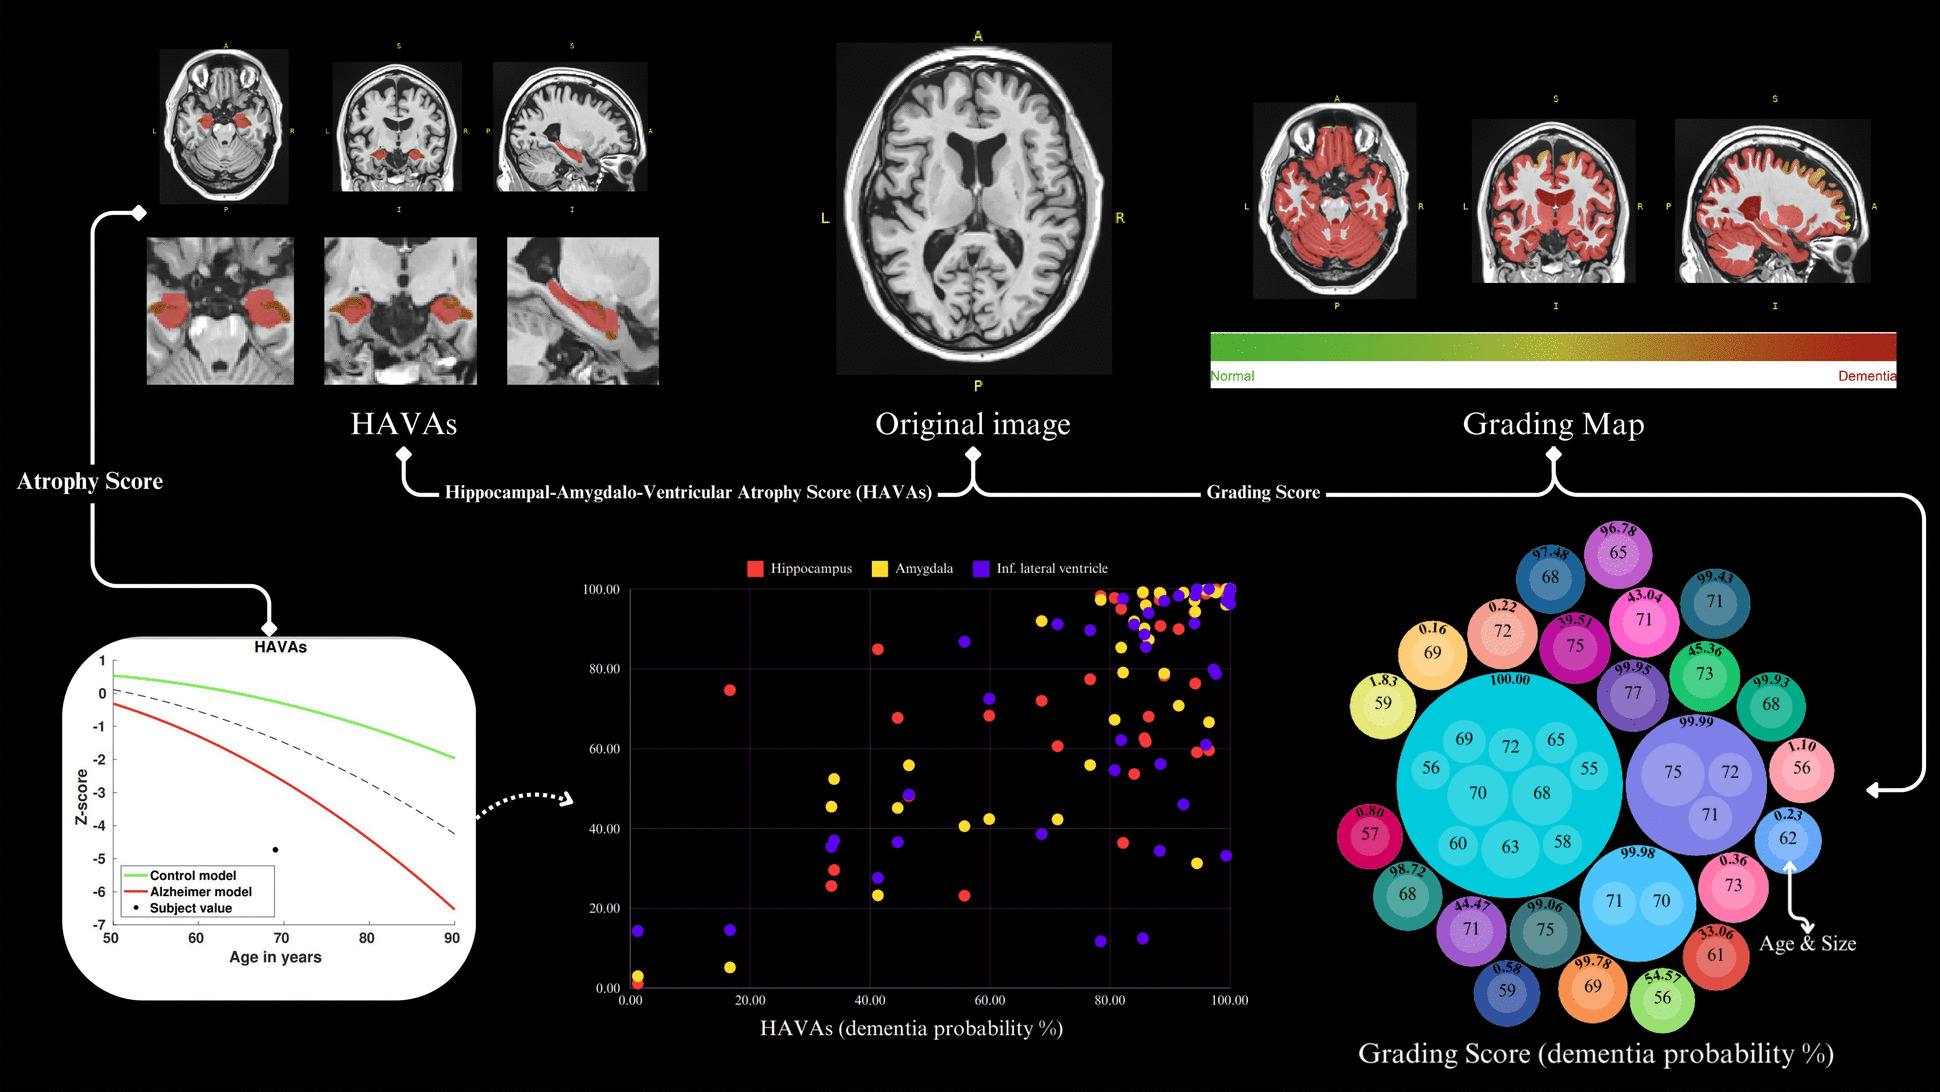
Summary of the AssemblyNet-AD pipeline results (Hippocampal-Amygdalo-Ventricular Atrophy Scores [HAVAs]) featuring a 69-year-old male, along with grading score reports for all participants
Table 1.
Demographic information
| IBID (cognitively normal) (n = 41) |
ADNI (patients with AD) (n = 41) |
p-value | ||
|---|---|---|---|---|
| Age | Median (IQR) | 64 (62, 68) | 69 (62, 71) | 0.055 |
| Sex | Female (%) | 51.2 | 53.7 | 0.083 |
Table 2.
Detailed grading score and atrophy score results for IBID and ADNI data (dementia probability (in %))
| Group | ||||||
|---|---|---|---|---|---|---|
| IBID | ADNI | |||||
| Median | IQR1 | IQR3 | Median | IQR1 | IQR3 | |
| Grading score | 0.20 | 0.14 | 0.32 | 99.93 | 43.04 | 100.00 |
| Atrophy score (hippocampal-amygdalo-ventricular atrophy score (HAVAs)) | 14.76 | 7.26 | 27.64 | 86.41 | 71.23 | 96.46 |
| Hippocampus atropy score | 15.33 | 2.11 | 32.10 | 84.90 | 61.76 | 98.98 |
| Amygdala atropy score | 10.46 | 2.25 | 22.19 | 91.89 | 55.82 | 99.11 |
| Inf. lateral ventricle atropy score | 22.41 | 15.63 | 37.05 | 85.49 | 38.60 | 97.02 |
Group comparisons
Given the non-normal distribution of data, nonparametric tests were used to compare the two groups. The dementia probability metrics diverged starkly: the ADNI cohort exhibited substantially higher grading scores (median = 99.93% vs. IBID = 0.20%; mean rank = 59.95 vs. 23.05; U = 84.00, Z = − 7.032) and HAVAs (Fig. 2) (median = 86.41 vs. 14.76; mean rank = 60.17 vs. 22.83; U = 75.00, Z = − 7.099). Subregional atrophy analyses further differentiated these cohorts. Hippocampal atrophy scores were markedly elevated in ADNI (median = 84.90 vs. IBID = 15.33; mean rank = 59.22 vs. 23.78; U = 114.00, Z = − 6.738), with similar disparities in amygdala atrophy (ADNI median = 91.89 vs. IBID = 10.46; mean rank = 59.15 vs. 23.85; U = 117.00, Z = − 6.710) and inferior lateral ventricular enlargement (ADNI median = 85.49 vs. IBID = 22.41; mean rank = 55.27 vs. 27.73; U = 276.00). All atrophy metrics demonstrated non-overlapping interquartile ranges and extreme effect sizes (Z ≤ − 5.24, all p < 0.0001), confirming the robust separation between dementia-free IBID participants and AD patients (Figs. 2 and 3).
Fig. 2.

The AssemblyNet-AD pipeline for Alzheimer's disease (AD) prediction was implemented using the cloud-based volBrain platform and applied to a sample dataset from ADNI, featuring a 69-year-old male (https://volbrain.net/)
Fig. 3.

Hippocampal-Amygdalo-Ventricular Atrophy Scores (HAVAs) alongside hippocampal, amygdalar, and inferior lateral ventricular atrophy scores for the IBID cohort (a) and ADNI cohort (b)
Quantile regression analysis of atrophy scores
Quantile regression models (q = 0.25, 0.50, 0.75) were fitted to evaluate the association between HAVAs and regional atrophy metrics (the hippocampus, amygdala, and inferior lateral ventricle) across the IBID and ADNI cohorts. The models demonstrated strong explanatory power, with pseudo-R2 values ranging from 0.854 to 0.875 and mean absolute errors (MAE) between 4.07 and 4.78. All regional atrophy measures exhibited significant positive associations with HAVAs across quantiles, as evidenced by t-statistics exceeding 9.5 (all p < 0.001). Hippocampal atrophy showed the most stable contribution (coefficients: q₀.₂₅ = 0.306, q₀.₅₀ = 0.311, q₀.₇₅ = 0.342), while amygdala atrophy displayed a slight decline at higher quantiles (q₀.₂₅ = 0.375 vs. q₀.₇₅ = 0.323). Inferior lateral ventricular enlargement had diminishing effects (q₀.₂₅ = 0.367 vs. q₀.₇₅ = 0.284), suggesting differential regional contributions to atrophy severity.
Group differences across atrophy severity
The IBID cohort exhibited significantly lower HAVAs than the ADNI cohort, with the magnitude of this disparity increasing at higher quantiles. At the median (q = 0.50), IBID participants had 6.97 units lower HAVAs (95% CI: − 11.33, − 2.61, p = 0.002), a difference that intensified at the 75th quantile (q = 0.75; coefficient = − 11.82; 95% CI: − 15.69, − 7.94, p < 0.001). At the 25th quantile, the group effect was marginally nonsignificant (q = 0.25: coefficient = − 3.78, 95% CI: − 8.05, 0.50, p = 0.083). The intercept shifted from nonsignificant at lower quantiles (q = 0.25: − 4.33, p = 0.112) to strongly positive at q = 0.75 (9.98, p < 0.001), reflecting baseline differences in atrophy severity thresholds. Thus, the variation in the intercept across quantiles indicates differing baseline levels of atrophy scores, with the intercept shifting from negative at the lower quantiles to positive at the higher quantiles. This pattern suggests that group differences in atrophy scores are accentuated at higher levels of the outcome variable, thereby providing nuanced insights into the distributional impact of predictors on brain atrophy.
Discussion
This study successfully validated the dementia-free status of IBID by demonstrating significant neuroimaging differences compared with AD patients from the ADNI cohort. Our results revealed that the IBID cohort exhibited markedly lower levels of atrophy across the critical brain regions affected by AD. This was consistently reflected in significantly lower dementia probability metrics, such as grading scores and HAVAs, and supported by non-overlapping interquartile ranges and extreme effect sizes, robustly differentiating IBID participants from ADNI-AD patients. These findings strongly suggest that IBID participants are indeed free from the neurodegenerative changes characteristic of dementia, aligning with the patterns of brain atrophy observed in healthy aging, which are less severe than the hallmark features of AD, such as significant hippocampal atrophy and ventricular enlargement [15–19].
Subregional analyses further confirmed the divergence between cohorts. The ADNI group exhibited marked atrophy in the hippocampus and amygdala—regions central to memory and emotional processing–and was among the earliest affected in AD [20–25]—alongside significant inferior lateral ventricular enlargement, consistent with cortical degeneration [15, 18]. In contrast, the structural integrity of these regions in IBID participants mirrors the profiles of healthy aging, where gradual hippocampal volume loss and ventricular expansion occur without crossing pathological thresholds. Quantile regression provided nuanced insights into the progression of atrophy, revealing severity-dependent associations. Hippocampal atrophy demonstrated stable contributions across quantiles (coefficients: 0.306–0.342), reinforcing its role as a cornerstone biomarker of AD [26–29]. Conversely, the diminishing influence of ventricular enlargement at higher quantiles may reflect ceiling effects in late-stage AD or in differential regional vulnerability. The intensifying group disparities in HAVAs at higher quantiles highlight that normative and pathological ageing trajectories diverge most conspicuously at advanced atrophy levels.
The successful validation of the IBID as a dementia-free control database has several important implications. First, it establishes IBID as a valuable and culturally relevant resource for studying brain aging in the Middle Eastern population, an area currently underrepresented in global neuroimaging research. Second, the comparative approach using ADNI data, the gold standard in the field, strengthens confidence in IBID's utility for future cross-cultural studies examining dementia risk and progression. However, it is important to acknowledge certain limitations. First, the sample size of 41 participants per group, while sufficient to detect the strong effects observed, is relatively small and was dictated by the number of available IBID participants over the age of 55 required for the AssemblyNet-AD pipeline. While our results showed highly significant differences, larger-scale studies are needed to confirm the generalizability of these findings. Furthermore, this study relies on structural MRI measures, and the cross-sectional nature of this validation prevents the analysis of longitudinal changes. Indeed, the current design is sufficient for validating the baseline dementia-free status of the cohort; however, future longitudinal studies are essential to monitor these individuals over time. This would enable the tracking of temporal changes in brain atrophy and help to precisely model the transition from healthy aging to potential cognitive decline. Additionally, our analysis did not include demographic factors beyond age and sex, such as education level or socioeconomic status, as this information was not uniformly available across both databases for the current sample. Future studies incorporating such data would provide a more comprehensive context for understanding population-specific differences in brain aging. Finally, our study was designed to validate the IBID healthy cohort against a definitive disease state and therefore did not include a non-Iranian healthy control group from ADNI for a three-way comparison. Such a comparison would be a valuable future study to investigate potential ethnic differences in normative brain aging, but was beyond the scope of this initial validation project.
Conclusions
This study robustly validated the dementia-free classification of the IBID cohort by demonstrating significant disparities in structural atrophy and dementia probability metrics using grading and HAVAs scores compared with patients with AD from the ADNI database. These findings affirm IBID’s utility of IBID as a reference for dementia-free neuroimaging biomarkers, particularly in middle-aged and older adults, a transitional period in which distinguishing normal aging atrophy from neurodegeneration requires heightened attention. By leveraging the AssemblyNet-AD pipeline to quantify atrophy trajectories, this study aligns with the growing body of literature aimed at refining early detection algorithms and validating neuroimaging biomarkers across diverse population cohorts.
Acknowledgements
Data collection and sharing for this project was funded by the Alzheimer's Disease Neuroimaging Initiative (ADNI) (National Institutes of Health Grant U01 AG024904) and DOD ADNI (Department of Defense award number W81XWH-12-2-0012). ADNI is funded by the National Institute on Aging, the National Institute of Biomedical Imaging and Bioengineering, and through generous contributions from the following: AbbVie, Alzheimer’s Association; Alzheimer’s Drug Discovery Foundation; Araclon Biotech; BioClinica, Inc.; Biogen; Bristol-Myers Squibb Company; CereSpir, Inc.; Cogstate; Eisai Inc.; Elan Pharmaceuticals, Inc.; Eli Lilly and Company; EuroImmun; F. Hoffmann-La Roche Ltd and its affiliated company Genentech, Inc.; Fujirebio; GE Healthcare; IXICO Ltd.; Janssen Alzheimer Immunotherapy Research & Development, LLC.; Johnson & Johnson Pharmaceutical Research & Development LLC.; Lumosity; Lundbeck; Merck & Co., Inc.; Meso Scale Diagnostics, LLC.; NeuroRx Research; Neurotrack Technologies; Novartis Pharmaceuticals Corporation; Pfizer Inc.; Piramal Imaging; Servier; Takeda Pharmaceutical Company; and Transition Therapeutics. The Canadian Institutes of Health Research is providing funds to support ADNI clinical sites in Canada. Private sector contributions are facilitated by the Foundation for the National Institutes of Health (www.fnih.org). The grantee organization is the Northern California Institute for Research and Education, and the study is coordinated by the Alzheimer’s Therapeutic Research Institute at the University of Southern California. ADNI data are disseminated by the Laboratory for Neuro Imaging at the University of Southern California.
Data used in preparation of this article were obtained from the Alzheimer’s Disease Neuroimaging Initiative (ADNI) database (adni.loni.usc.edu). As such, the investigators within the ADNI contributed to the design and implementation of ADNI and/or provided data but did not participate in analysis or writing of this report. A complete listing of ADNI investigators can be found at: http://adni.loni.usc.edu/wp-content/uploads/how_to_apply/ADNI_Acknowledgement_List.pdf.
Authors’ contributions
S.G. and S.M. conceived and designed the study. Material preparation, data collection, and analysis were performed by S.G., F.F., M.S., and S.B.. The first draft of the manuscript was written by S.G. and S.M. All authors have commented on the previous versions of the manuscript. All authors have read and approved the final manuscript.
Funding
The authors declare that no funds, grants, or other support was received during the preparation of this manuscript.
Data availability
This article contains all the data produced or analyzed during this investigation. Further inquiries should be forwarded to the corresponding author.
Declarations
Ethics approval and consent to participate
The Ethics Committee of the National Institute for Medical Research Development (NIMAD) approved this study (Ethical Code: IR.NIMAD.REC.1396.319) in accordance with the Declaration of Helsinki. All individuals and/or their legal representatives gave written informed consent before entering the study.
Consent for publication
Not applicable.
Competing interests
The authors declare no competing interests.
Footnotes
Publisher’s Note
A list of authors and their affiliations appears at the end of the paper.
References
- 1.Nichols E, Steinmetz JD, Vollset SE, Fukutaki K, Chalek J, Abd-Allah F, et al. Estimation of the global prevalence of dementia in 2019 and forecasted prevalence in 2050: an analysis for the Global Burden of Disease Study 2019. The Lancet Public Health. 2022;7:e105–25. [DOI] [PMC free article] [PubMed] [Google Scholar]
- 2.Rittman T. Neurological update: neuroimaging in dementia. J Neurol. 2020;267:3429–35. [DOI] [PMC free article] [PubMed] [Google Scholar]
- 3.Coupé P, Manjón JV, Mansencal B, Tourdias T, Catheline G, Planche V. Hippocampal-amygdalo-ventricular atrophy score: Alzheimer disease detection using normative and pathological lifespan models. Hum Brain Mapp. 2022;43:3270–82. [DOI] [PMC free article] [PubMed] [Google Scholar]
- 4.Korthauer LE, Zhan L, Ajilore O, Leow A, Driscoll I. Disrupted Topology of the Resting State Structural Connectome in Middle-Aged APOE ε4 Carriers. Neuroimage. 2018;178:295–305. [DOI] [PMC free article] [PubMed] [Google Scholar]
- 5.Hennessee JP, Lung T-C, Park DC, Kennedy KM. Age differences in BOLD modulation to task difficulty as a function of amyloid burden. Cereb Cortex. 2024;34:bhae357. [DOI] [PMC free article] [PubMed] [Google Scholar]
- 6.Batouli SAH, Sisakhti M, Haghshenas S, Dehghani H, Sachdev P, Ekhtiari H, et al. Iranian Brain Imaging Database: A Neuropsychiatric Database of Healthy Brain. Basic Clin Neurosci. 2021;12:115–32. [DOI] [PMC free article] [PubMed] [Google Scholar]
- 7.Mueller SG, Weiner MW, Thal LJ, Petersen RC, Jack CR, Jagust W, et al. Ways toward an early diagnosis in Alzheimer’s disease: the Alzheimer’s Disease Neuroimaging Initiative (ADNI). Alzheimers Dement. 2005;1:55–66. [DOI] [PMC free article] [PubMed] [Google Scholar]
- 8.Nguyen H-D, Clément M, Mansencal B, Coupé P. Towards better interpretable and generalizable AD detection using collective artificial intelligence. Comput Med Imaging Graph. 2023;104: 102171. [DOI] [PubMed] [Google Scholar]
- 9.Jack CR, Bernstein MA, Fox NC, Thompson P, Alexander G, Harvey D, et al. The Alzheimer’s Disease Neuroimaging Initiative (ADNI): MRI Methods. J Magn Reson Imaging. 2008;27:685–91. [DOI] [PMC free article] [PubMed] [Google Scholar]
- 10.Wyman BT, Harvey DJ, Crawford K, Bernstein MA, Carmichael O, Cole PE, et al. Standardization of analysis sets for reporting results from ADNI MRI data. Alzheimers Dement. 2013;9:332–7. [DOI] [PMC free article] [PubMed] [Google Scholar]
- 11.Jack CR, Bernstein MA, Borowski BJ, Gunter JL, Fox NC, Thompson PM, et al. Update on the MRI Core of the Alzheimer’s Disease Neuroimaging Initiative. Alzheimers Dement. 2010;6:212–20. [DOI] [PMC free article] [PubMed] [Google Scholar]
- 12.Nguyen H, Clément M, Mansencal B, Coupé P. Brain structure ages—A new biomarker for multi-disease classification. Hum Brain Mapp. 2024;45: e26558. [DOI] [PMC free article] [PubMed] [Google Scholar]
- 13.de Senneville BD, Manjón JV, Coupé P. RegQCNET: Deep quality control for image-to-template brain MRI affine registration. Phys Med Biol. 2020;65: 225022. [DOI] [PubMed] [Google Scholar]
- 14.Coupé P, Mansencal B, Clément M, Giraud R, Denis de Senneville B, Ta VT, et al. AssemblyNet: A large ensemble of CNNs for 3D whole brain MRI segmentation. Neuroimage. 2020;219:117026. [DOI] [PubMed]
- 15.Apostolova LG, Green AE, Babakchanian S, Hwang KS, Chou Y-Y, Toga AW, et al. Hippocampal atrophy and ventricular enlargement in normal aging, mild cognitive impairment (MCI), and Alzheimer Disease. Alzheimer Dis Assoc Disord. 2012;26:17–27. [DOI] [PMC free article] [PubMed] [Google Scholar]
- 16.Coupé P, Manjón JV, Lanuza E, Catheline G. Lifespan Changes of the Human Brain In Alzheimer’s Disease. Sci Rep. 2019;9:3998. [DOI] [PMC free article] [PubMed] [Google Scholar]
- 17.Nestor SM, Rupsingh R, Borrie M, Smith M, Accomazzi V, Wells JL, et al. Ventricular enlargement as a possible measure of Alzheimer’s disease progression validated using the Alzheimer’s disease neuroimaging initiative database. Brain. 2008;131:2443–54. [DOI] [PMC free article] [PubMed] [Google Scholar]
- 18.Blinkouskaya Y, Weickenmeier J. Brain Shape Changes Associated With Cerebral Atrophy in Healthy Aging and Alzheimer’s Disease. Front Mech Eng. 2021;7: 705653. [DOI] [PMC free article] [PubMed] [Google Scholar]
- 19.Leung KK, Bartlett JW, Barnes J, Manning EN, Ourselin S, Fox NC. Cerebral atrophy in mild cognitive impairment and Alzheimer disease. Neurology. 2013;80:648–54. [DOI] [PMC free article] [PubMed] [Google Scholar]
- 20.Song J. Amygdala activity and amygdala-hippocampus connectivity: Metabolic diseases, dementia, and neuropsychiatric issues. Biomed Pharmacother. 2023;162: 114647. [DOI] [PubMed] [Google Scholar]
- 21.Chaudhary S, Zhornitsky S, Chao HH, van Dyck CH, Li C-SR. Emotion Processing Dysfunction in Alzheimer’s Disease: An Overview of Behavioral Findings, Systems Neural Correlates, and Underlying Neural Biology. Am J Alzheimers Dis Other Demen. 2022;37:15333175221082834. [DOI] [PMC free article] [PubMed]
- 22.Punzi M, Sestieri C, Picerni E, Chiarelli AM, Padulo C, Delli Pizzi A, et al. Atrophy of hippocampal subfields and amygdala nuclei in subjects with mild cognitive impairment progressing to Alzheimer’s disease. Heliyon. 2024;10: e27429. [DOI] [PMC free article] [PubMed] [Google Scholar]
- 23.Poulin SP, Dautoff R, Morris JC, Barrett LF, Dickerson BC. Amygdala atrophy is prominent in early Alzheimer’s disease and relates to symptom severity. Psychiatry Res. 2011;194:7–13. [DOI] [PMC free article] [PubMed] [Google Scholar]
- 24.Prieto del Val L, Cantero JL, Atienza M. Atrophy of amygdala and abnormal memory-related alpha oscillations over posterior cingulate predict conversion to Alzheimer’s disease. Sci Rep. 2016;6:31859. [DOI] [PMC free article] [PubMed]
- 25.Göschel L, Kurz L, Dell’Orco A, Köbe T, Körtvélyessy P, Fillmer A, et al. 7T amygdala and hippocampus subfields in volumetry-based associations with memory: A 3-year follow-up study of early Alzheimer’s disease. Neuroimage Clin. 2023;38: 103439. [DOI] [PMC free article] [PubMed] [Google Scholar]
- 26.Henneman WJP, Sluimer JD, Barnes J, van der Flier WM, Sluimer IC, Fox NC, et al. Hippocampal atrophy rates in Alzheimer disease. Neurology. 2009;72:999–1007. [DOI] [PMC free article] [PubMed] [Google Scholar]
- 27.Barnes J, Bartlett JW, van de Pol LA, Loy CT, Scahill RI, Frost C, et al. A meta-analysis of hippocampal atrophy rates in Alzheimer’s disease. Neurobiol Aging. 2009;30:1711–23. [DOI] [PMC free article] [PubMed] [Google Scholar]
- 28.Ferreira D, Verhagen C, Hernández-Cabrera JA, Cavallin L, Guo C-J, Ekman U, et al. Distinct subtypes of Alzheimer’s disease based on patterns of brain atrophy: longitudinal trajectories and clinical applications. Sci Rep. 2017;7:46263. [DOI] [PMC free article] [PubMed] [Google Scholar]
- 29.Xiao Y, Hu Y, Huang K, Alzheimer’s Disease Neuroimaging Initiative. Atrophy of hippocampal subfields relates to memory decline during the pathological progression of Alzheimer’s disease. Front Aging Neurosci. 2023;15:1287122. [DOI] [PMC free article] [PubMed]
Associated Data
This section collects any data citations, data availability statements, or supplementary materials included in this article.
Data Availability Statement
This article contains all the data produced or analyzed during this investigation. Further inquiries should be forwarded to the corresponding author.