Abstract
Studies presented here show that the expression of CD4, MHC class II (Ia,) and B220 cleanly resolves a major and a minor subset within the earliest pro-B cell population (germ-line pro-B) in adult bone marrow (BM). The major subset expresses intermediate B220 and low CD4 levels. The minor subset, which constitutes roughly 20% of the adult germ-line pro-B, expresses very low B220 levels and does not express CD4. Ia is clearly detectable at low levels on the major germ-line pro-B subset, both in wild-type adult mice and in gene-targeted mice (RAG2−/− and μMT), in which B cell development terminates before the pre-B cell stage. A small proportion of cells in the more mature pro-B cell subsets (Hardy Fractions B and C) also express Ia at this level. In contrast, Ia levels on the minor subset are barely above (or equal to) background. Surprisingly, the major germ-line pro-B cell subset found in adults is missing in fetal and neonatal animals. All of the germ-line pro-B in these immature animals express a phenotype (very low B220, no CD4, or Ia) similar to that of the minor pro-B cell subset in adult BM. Because B cell development in fetal/neonatal animals principally results in B-1 cells, these findings demonstrate that the B-1 development pathway does not include the major germ-line pro-B subset found in adult BM and hence identify a very early difference between the B-1 and -2 development pathways.
B cell development occurs in fetal and neonatal liver and in adult bone marrow (BM) by the orderly progression of B-lineage precursor cells through a series of genetically and phenotypically defined stages of differentiation (1–8). These stages (pre-pro-B, early pro-B, late pro-B, pre-B, immature B, and mature B cells) are each characterized by a distinct surface phenotype (8) and by the progressive status of Ig heavy and Ig light chain gene rearrangement and expression.
The earliest phase of B cell development from stem cells proceeds in two steps: the commitment to common lymphoid progenitor cells and the subsequent differentiation of the common lymphoid progenitor cells to the earliest cells in the B-lineage pathway (pro-B) (7), defined as cells that express the B220 surface marker and give rise to B lineage but not T lineage cells (6). Pro-B can be divided into three stages [designated Fractions (Fr.) A, B, and C by Hardy and colleagues (2)]. Fr. A contains the earliest (germ-line) pro-B cells, in which the initial Ig rearrangement (DHJH) has not yet been completed. Cells in Frs. B and C have completed this rearrangement and some cells, notably in Fr. C′, have also completed VHDHJH rearrangement.
In adult BM, the surface markers that distinguish pro-B cells from cells at later stages of B cell development include B220 levels, CD4, CD43, BP-1, CD24, IgM, IgD, and MHC class II (Ia). Of these, only B220 and CD4 are expressed on germ-line pro-B cells. B220 is expressed at low or intermediate levels on all of these cells, whereas CD4 is expressed on a major subset (which expresses B220 at intermediate levels). The ability of the CD4+ subset to give rise to B cells has recently been brought into question by evidence showing that these cells fail to develop into B cells in vitro under conditions that readily allow B cell development from germ-line pro-B that do not express CD4 (9, 10). Studies here, however, show that both subsets express roughly equal amounts of mRNA encoding traditional pro-B cell markers—i.e., sterile μ, TdT, Igβ (CD79b)—and hence indicate that both subsets contain B cell progenitors.
Studies here also show that MHC Class II (Ia) marks most of the cells in the CD4+ germ-line pro-B cells subset and is marginally detectable (very low levels) on CD4− germ-line pro-B cells. These findings confirm and extend earlier work documenting Ia expression during B cell development. Fluorescence-activated cell sorter (FACS) studies completed shortly after monoclonal anti-Ia reagents were developed initially indicated that Ia is expressed only on mature B cells (11). However, more recent studies show that Ia is also expressed on pre-B cells in adult BM, albeit at roughly 30% the level expressed on mature splenic B cells (12, 13). In addition, evidence from functional studies indicates that Ia expression begins even earlier in B cell development, because the generation of pre-B cells from progenitor cells in adult BM is blocked either by culturing progenitors in the presence of anti-Ia monoclonal antibody or by expressing antisense RNA in the progenitors (14).
These findings with adult BM contrast with evidence demonstrating that Ia is not expressed on pre-B cells in fetal and neonatal animals (1, 12, 13). In fact, several studies show that Ia expression cells in the B cell development pathway in fetal and neonatal mice only begins when cells reach the immature B cell stage, identifiable by the expression of surface IgM in the absence of IgD (12, 13). Our findings confirm these earlier findings and add that Ia is not expressed on germ-line pro-B in the fetal and neonatal animals. In addition, we explain these findings by showing that the CD4+ germ-line pro-B subset that contains the Ia+ pro-B cells in adults is not present in the fetal/neonatal animals. In essence, we show that the only germ-line pro-B cells present in fetal/neonatal animals express essentially the same phenotype as the minor subset of germ-line pro-B cells in adults—i.e., very low levels of B220, no detectable CD4, and marginal or undetectable Ia.
We discuss this key difference between the adult and fetal/neonatal B cell development pathways in the context of whether B-1 cells, which primarily develop in fetal and neonatal animals, arise from the same progenitors as B-2 cells, which primarily develop in adult BM. Basically, our findings distinguish the fetal/neonatal and adult B cell developmental pathways at a very early stage and thus favor distinctive origins for B-1 and B-2 cells.
Materials and Methods
Mice and Cell Preparation.
BALB/c, C57BL/6, gene targeted disruption of μ chain (μMT) mice (15) from The Jackson Laboratory, RAG2-deficient mice (RAG2−/−) (16) obtained from Weissman laboratory at Stanford, and C3H and GFP-Tg mice were bred and maintained at the Animal Facility at Stanford University. BM and spleen cells were harvested from adults (8–12 weeks of age; liver cells were harvested from mouse fetus at timed points (the appearance of the vaginal plug was designed as day 0 of gestation) and from neonates day 2–10 after birth. Single-cell suspensions were prepared in “staining medium” (biotin- and flavin-deficient RPMI medium 1640, supplemented with 5% FCS).
11-Color Flow Cytometry and Cell Sorting.
Single-cell suspensions from adult bone marrow, spleen, fetal, and neonatal liver were stained with cocktails of fluorochrome-conjugated antibodies CD3 (2C11), CD8a (53–6.7), F4/80 (F4/80), GR-1 (RB6–8C5), IgM (331), IgD (1126), CD11b (M1/70), CD4 (GK1.5); BP-1 (6C3), CD24 (30F1.2), I-Ad (AMS-32), I-Ab (AF6–120); and I-Ad/I-Ed (2G9), I-Ak (11–5.2), CD43 (S7). Antibodies and fluorochrome conjugates were either prepared at Stanford or obtained from PharMingen. Streptavidin-Cy5-PE and streptavidin-Texas red (TR) from BD PharMingen were used as second-step reagents. Noncommercial conjugates and tandem dyes were prepared as described (17). FITC, Alexa-594, Cascade Blue, and Cascade Yellow were obtained from Molecular Probes. Cy5, Cy5.5, and Cy7 were obtained from Amersham Pharmacia Life Science (Pittsburgh).
To determine the level of nonspecific staining and autofluorescence associated with cells in each fluorescence channel, cells were stained with each mixture of reagents with one reagent omitted at a time to create a “standard staining control” for each channel. Cell samples were also stained with single fluorochrome-coupled reagents to obtain data for fluorescence compensation for each fluorochrome. Propidium iodide (PI) was added to all samples before data collection to enable identification of dead cells. Data were collected on Hi-D FACS, a modified triple laser FACStarPlus (Becton Dickinson) connected to MoFlo electronics (Cytomation/Becton Dickinson hybrid FACS, Cytomation, Fort Collins, CO) by FACS/DESK software as described (17, 18). Finally, data cataloged and stored with FACS/DESK (Stanford) were transferred to Flowjo (Tree Star, San Carlos, CA) for fluorescence compensation and analysis. Hi-D FACS was also used to sort cells stained as above. Sorted cells were reanalyzed immediately after sorting; purities were >99%.
Reverse Transcription (RT)-PCR Analyses.
MHC class II (Ia).
Total RNA was extracted from FACS-sorted B-lineage subsets (for definition, see Figs. 1 and 7) and CD4+ T lymphocytes by using TRI-Reagent (Molecular Research Center, Cincinnati) according to the procedures recommended by the manufacturer. First-strand cDNA was synthesized from 1 μg of total RNA by using Superscript RT and random hexamers (Life Technologies and GIBCO). The resulting cDNA was amplified with gene-specific primers for β-actin, I-Aα, I-Aβ, I-Eα, and I-Eβ (synthesized by The Protein and Nucleic Acid Facility at Stanford University) as reported (9) and subjected to 30 PCR cycles (2400 Gene Amp Thermal Cycler, Perkin–Elmer). Each cycle consisted of denaturing at 95°C for 30 s, annealing at 58°C for 30 s, and polymerizing at 72°C for 45 s. Amplification of the β-actin gene was used throughout as a control for template intensity and for normalization of data to a constitutively expressed transcripts.
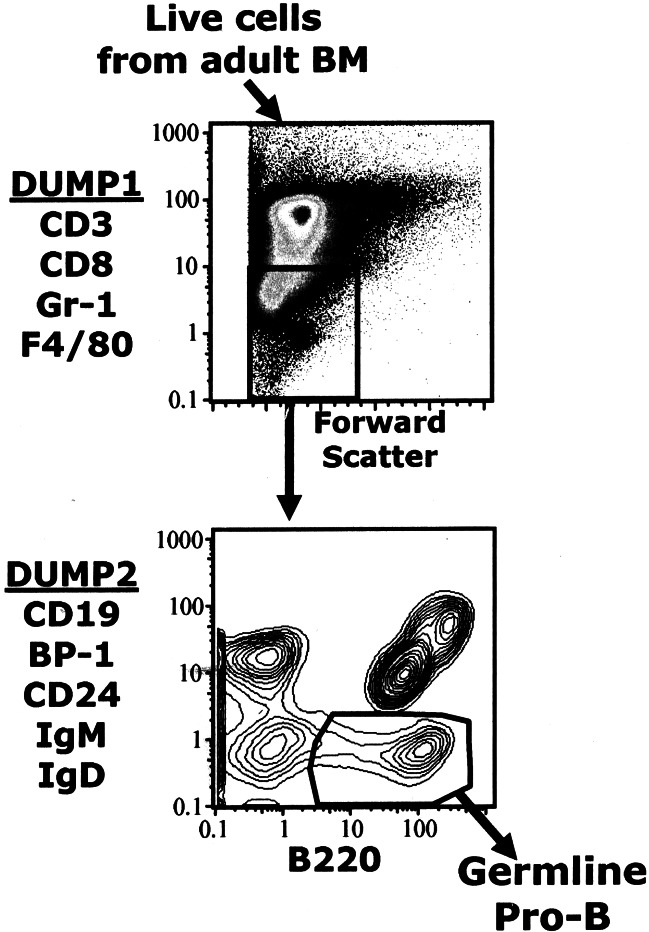
Figure 1.
Sequential gating for germ-line pro-B cells. The germ-line pro-B fraction includes B220+ cells that do not express any of the markers detected by dump1 or dump2.
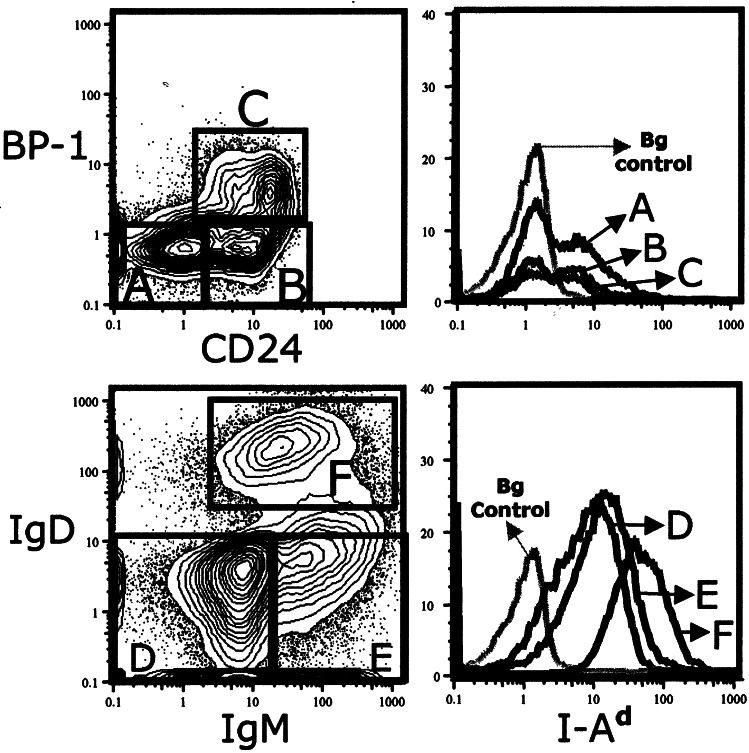
Figure 7.
FACS analyses for Ia expression in Hardy Frs. A-F. B220+ live cells from BALB/c BM were gated to include CD43+ cells (Frs. A-C; Upper Left) and CD43- (Frs. D-F; Lower Left). Histograms show Ia expression for cells in gates shown in Left. Background (Bg) control is shown in gray (for description, see legend for Fig. 6).
TdT, Igβ, sterile μ(μ0), and Iaβ.
Τhe RT-PCR protocols described above, with the following modifications, were used to obtain data in Fig. 5. Total RNA was extracted from 4.5 × 10⁴ sorted cells by using TRI-Reagent. After ethanol precipitation, the RNA pellet was resuspended in 5 μl of diethyl pyrocarbonate (DEPC)-treated water and used for first-strand cDNA synthesis. After addition of 1 μl of 50 ng/ml of random hexamers and 1 μl of 10 mM dNTP in a 10-μl volume, the reaction was incubated at 65°C for 2 min and placed on ice. The following reagents were then added: 2 μl of 10× RT buffer (GIBCO/BRL); 4 μl of 25 mM MgCL2; 2 μl of 0.1 M DTT; 1 μl of RNase inhibitor (Promega); and 1 μl of 200 units/μl Superscript RTII (GIBCO/BRL). The reaction was incubated at 42°C for 2 h and heated at 72°C for 10 min. The reactions were stored at −20°C until PCR amplification.
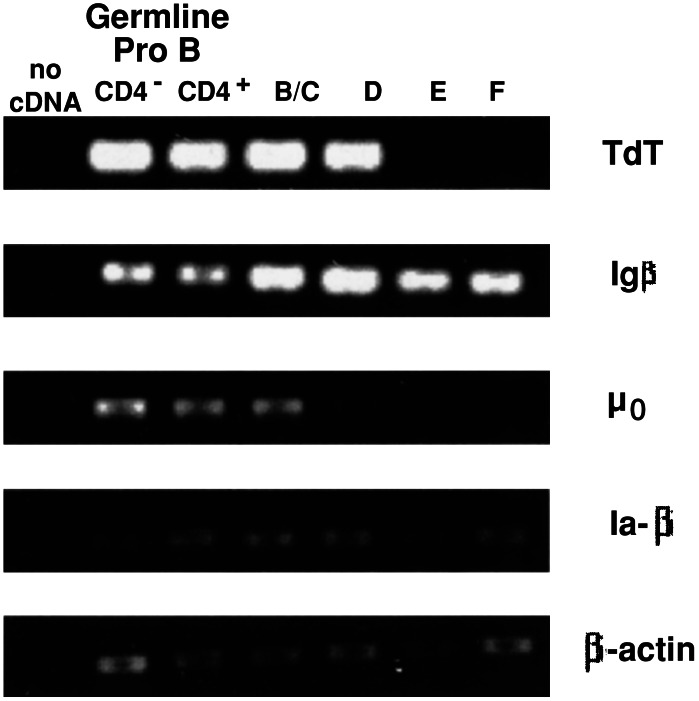
Figure 5.
Representative RT-PCR analysis of gene expression in B lineage fractions. PCR samples were visualized on a UV transilluminator by ethidium bromide staining. The two BM germ-line pro-B populations were sorted as in Fig. 3. Hardy Frs. B–F were sorted as in Fig. 7. Frs. B and C were combined for this analysis. PCR reactions were carried out between 36 and 40 cycles; data are shown for the cycle number with which the PCR amplification was in linear range.
cDNA was amplified using different sets of gene-specific PCR primers (kindly supplied by R. R. Hardy, Fox Chase Cancer Center, Philadelphia) (4). PCR analyses were performed in a 50-μl volume containing 1 μl of cDNA sample, 1× PCR reaction buffer, 200 μM of dNTP, 1 μM of primer sets, and 5 units of Taq polymerase (GIBCO/BRL). The PCR reactions were carried out using the following conditions: 94°C for 40 s; annealing at 62°C for 40 s for the first five cycles and at 60°C for 40 s for the following cycles; polymerization at 72°C for 40 s. Aliquots were withdrawn between 36 and 40 cycles to ensure that the amplification is within the linear range. The housekeeping gene, β-actin, was also amplified as positive controls. Five microliters of the PCR products was separated by 1.2% agarose gel electrophoresis and visualized using ethidium bromide.
PCR Assay for Detection of IgH Gene Rearrangements.
For PCR analysis of Ig gene DHJH rearrangement, the genomic DNA was extracted from the same FACS-sorted populations and FLST2 cells as those described above by using TRI-reagent (Molecular Research Center, Cincinnati) according to the manufacturer's instructions. DNA quantity and quality were determined by OD scanning. One microgram of DNA from each sample was amplified for detection of Ig heavy-chain DHJH and VHDHJH rearrangement by PCR. Gene-specific primers, including the primer for the β-actin gene, have been described (19). PCRs consist of 30 cycles (1 min at 94°C, 1 min at 60°C, and 1.5 min at 72°C). Each PCR was followed by 10-min incubation at 72°C.
Results
Identification of Germ-Line Pro-B Cells.
The Hardy Fr. A (defined as CD43+ cells with B220 below that of mature B cells and no detectable CD19, CD24, BP-1, IgD, or IgM) contains the earliest cells in the B cell development pathway (2). Based on this phenotype, we have established an 11-color (Hi-D) FACS method that identifies germ-line pro-B cells and allows detection of cell surface markers that subdivide this population.
In essence, we sequentially exclude most of the cells in BM by using propidium iodide to exclude dead cells and a mixture of reagents (dump1: CD3, CD8, F4/80, and Gr-1 marked with Cascade blue) to identify and gate out cells that do not belong to the B cell lineage. Next, we use a second mixture (dump2: BP-1, IgM, IgD, CD19, and CD24 marked with FITC) to identify all B lineage cells that have matured to Hardy Fr. B or beyond—i.e., that express markers indicative of progression to IgH rearrangement. We then plot dump2 versus B220 and display the resulting figure as a contour plot (Fig. 1) and draw a gate that includes the B220+ dump2− population.
This gating scheme enables unambiguous exclusion of the more mature (dump2+) B lineage cells and thereby makes it possible to obtain a discrete population of germ-line pro-B cells (Fig. 1). Importantly, it allows the B220 gate to be set to include cells that express very low B220 levels. As studies that follow demonstrate, these cells belong to an important germ-line pro-B subset that is poorly represented in adults but constitutes the only pro-B subset detectable in neonatal animals.
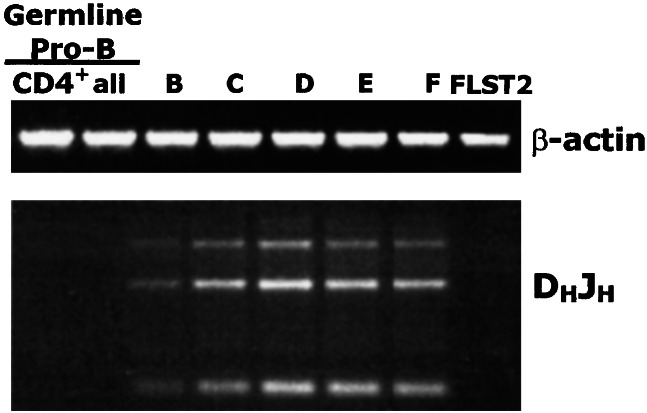
PCR analysis of IgH rearrangement status in FACS-sorted germ-line pro-B identified as above confirms the lack of IgH rearrangement in cells in this fraction. To assess DHJH rearrangement, we used a set of primers that amplifies a ladder of rearranged DHJH fragments—i.e., an oligonucleotide primer pair that can amplify 10/12 of the DH segments and a primer complementary to a segment of DNA 3′ of JH4. Using these primers, PCR analyses of DNA prepared from FACS-sorted germ-line pro-B and from Hardy Frs. A–F, show that the IgH genes in the germ-line pro-B and the Hardy Fr. A are in germ-line configuration whereas the IgH loci in Frs. B and C have significant DHJH recombination (Fig. 2).
Figure 2.
Germ-line pro-B cells have not rearranged DHJH. PCR analysis of genomic DNA isolated from the indicated FACS-sorted B cell development populations (CD4+ and all germ-line pro-B; Hardy Frs. B–F). FLST2 is a murine bone marrow stromal cell line.
CD4 and B220 Expression Distinguish Two Subsets Within the Germ-Line Pro-B Cell Population in Adult BM.
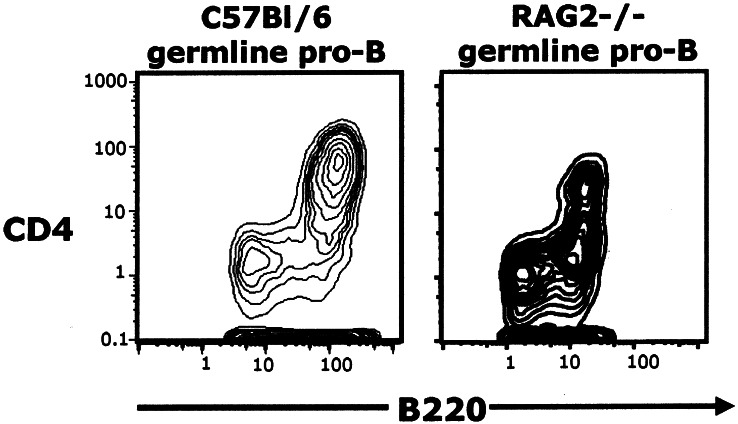
The germ-line pro-B population is readily subdivided in Hi-D FACS analyses by plotting CD4 expression versus B220 expression (Fig. 3). Two major subsets appear: a CD4+ subset that expresses relatively higher levels of B220 (although not as high as the levels on mature B cells); and a CD4− subset that expresses very low B220 levels. By ignoring the small percentage of cells that fall into the overlapping region between the subsets (CD4−, relatively bright B220), boundaries for each of the two clearly distinguishable subsets can be drawn to include nearly all of the cells in the subset with little contamination from the other (Fig. 3).
Figure 3.
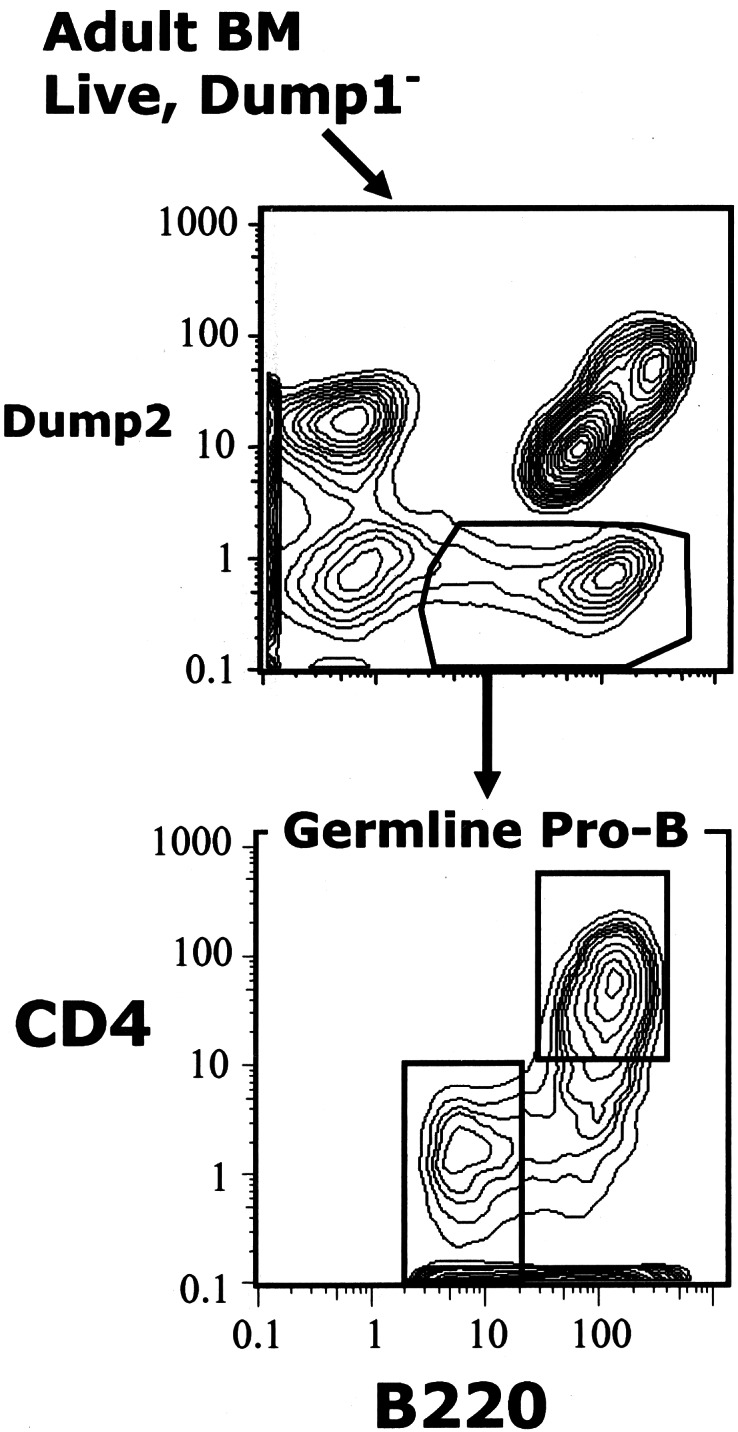
CD4+ and CD4− subsets in the germ-line pro-B population. Germ-line pro-B were identified as in Fig. 1. Analysis of cells in the overlapping region between the subsets indicates that it contains a mixture of cells belonging to one or the other subset.
The pro-B subsets visualized in Fig. 3 are present both in wild-type mice and in gene-targeted mice in which B cell development terminates at the pro-B cell stage (RAG2−/−) (Fig. 4) (15, 16). However, the RAG2 CD4+ population appears to be further subdivided, suggesting that the differentiation block in these animals results in the accumulation of cells that are not visible as a separate subset when differentiation proceeds normally. This subdivision of the CD4+ pro-B cells in the RAG2 mice merits further study. Of importance here, the data in the figure demonstrate clearly that RAG2 mice have CD4+ pro-B cells.
Figure 4.
Germ-line pro-B populations in wild-type mice are found in gene-targeted mice (RAG2−/−) in which B cell development is disrupted before DHJH rearrangement. Differences in staining patterns are attributable to the use of different fluorochromes on the anti-CD4 and anti-B220 reagents.
The expression of CD4 on a subset of the Hardy Fr. A (pro-B) cells has been well documented in previous studies (4, 6, 9). However, questions have been raised as to whether these CD4+ cells in Fr. A represent a contaminating population that does not belong to the B cell development pathway. In support of this argument, the CD4+ cells have been shown to be incapable of giving rise to B cells when FACS-sorted and tested in an in vitro clonal development assay (9, 10). Nevertheless, as the RT-PCR studies of FACS-sorted cells presented here show (Fig. 5), CD4+ cells germ-line pro-B contain roughly the same amount of mRNA encoding typical germ-line pro-B markers [sterile μ, Igβ (CD79b), and TdT] as the CD4− germ-line pro-B population. Thus, the behavior of the CD4+ pro-B cells in the in vitro development assay notwithstanding, there is strong reason to consider them valid germ-line pro-B cells.
The CD4+ and CD4− Germ-Line Pro-B Cell Subsets Differ for Ia Expression.
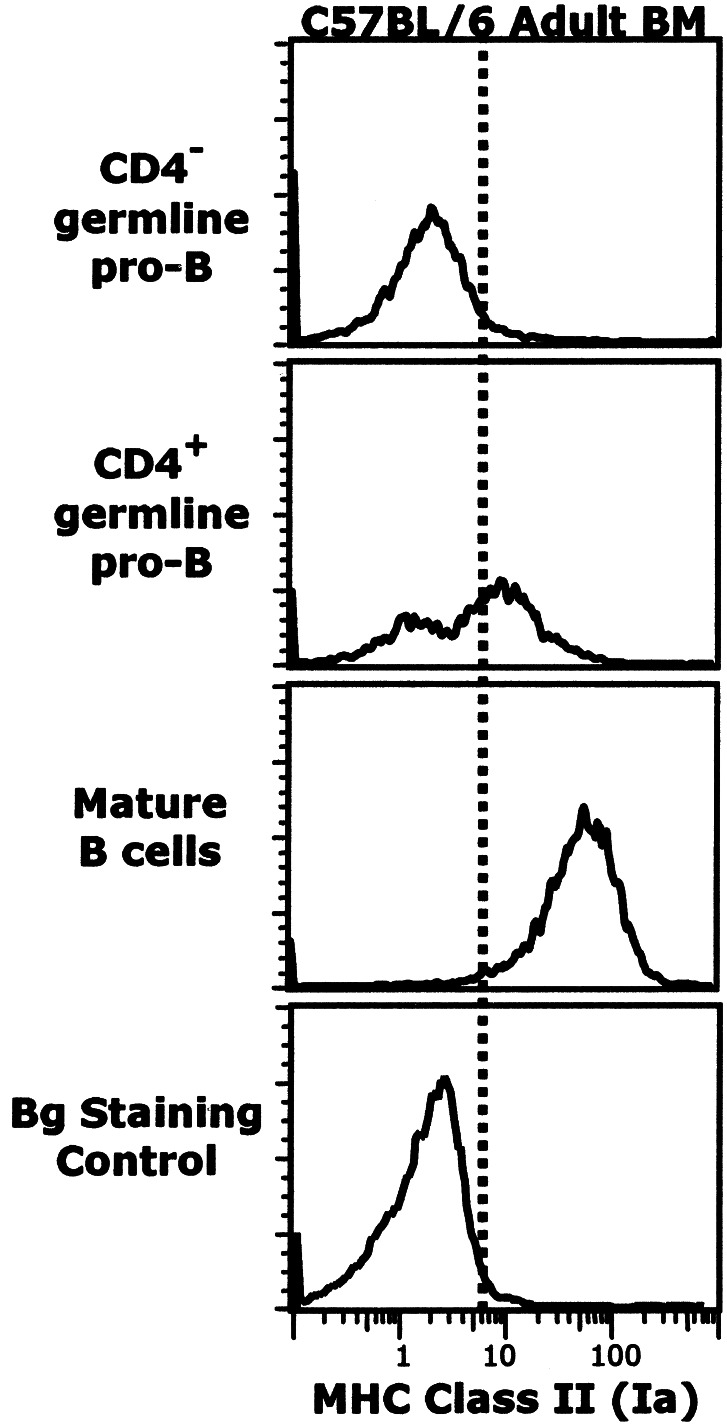
In previous studies, pre-B cells in adult BM were shown to express Ia whereas Ia was not detected on pro-B cells (12, 13). However, the increased discrimination enabled by Hi-D FACS analysis enables detection of Ia expression at low levels on cells in the CD4+ germ-line pro-B subset (Fig. 6). Roughly half of the cells in this subset express Ia, whereas there is only marginal Ia expression on cells in the CD4− subset. In contrast, the CD4− subset includes 10–15% of cells that express CD11b, whereas this marker is not detectable on the CD4+ subset (Hi-D FACS data not shown). Several other early pro-B cell markers are expressed equally in both subsets—i.e., CD117 (c-kit), CD127 (IL-7Rα), and AA4.1 (Hi-D FACS data not shown).
Figure 6.
Ia expression on CD4+ germ-line pro-B cells. Subsets of germ-line pro-B cells were gated as shown in previous figures. Background (Bg) staining control represents signal from cells that were stained with the entire reagent mixture except for anti-Ia (see Materials and Methods).
Interestingly, the quantitative expression of Ia changes dramatically during B cell development. The median Ia expression level detected by Hi-D FACS on CD4+ pro-B cells is roughly 3-fold lower than the Ia level on pre-B cells and fully 10-fold lower than the Ia level on mature B cells (Fig. 7). Nevertheless, the amount of Ia expressed on CD4+ pro-B cells is clearly above controls levels, defined as the background fluorescence detected for cells stained with all reagents except the anti-Ia (see Materials and Methods). The “marginal” Ia expression on the CD4− subset, in contrast, is barely above background and difficult to ascertain. Although we detect a small amount of Ia mRNA in the sorted CD4− pro-B cell fraction, we cannot rule out contaminating cells (Fig. 5). Therefore, we define the Ia expression in this fraction as marginal an await further studies to resolve this issue.
Ia Expression Continues Past the Germ-Line Pro-B Cell Stage.
When the overall population of pro-B cells in adult BM are subdivided into the Hardy Fr. A–C (2), the cells expressing Ia constitute 20 to 30% of Fr. A (which includes both the CD4+ and CD4− germ-line pro-B), and progressively smaller percentages of Frs. B (5–10%) and C (2–5%). In the most mature pro-B cell fraction (Fr. C), in which all cells have rearranged DHJH and some have even rearranged VHDHJH, Ia+ cells represent less than 5% of the cells in the fraction. Thus, the frequency of Ia+ cells decreases progressively as cells mature through the pro-B cell stages.
This trend is reversed later in development (Frs. D–F). Our data (not shown) confirm previous findings (12) demonstrating that the majority of pre-B cells express Ia and the frequency of Ia+ cells increases progressively, from 60 to 100%, as cells develop from pre-B to mature B cells. In addition, we confirm that the amount of Ia expressed per cell increases during maturation from pre-B to B. Thus, overall, Ia levels increase from the low levels detectable on pro-B cells to intermediate levels on pre-B cells and finally to the full Ia expression level on mature B cells in the periphery.
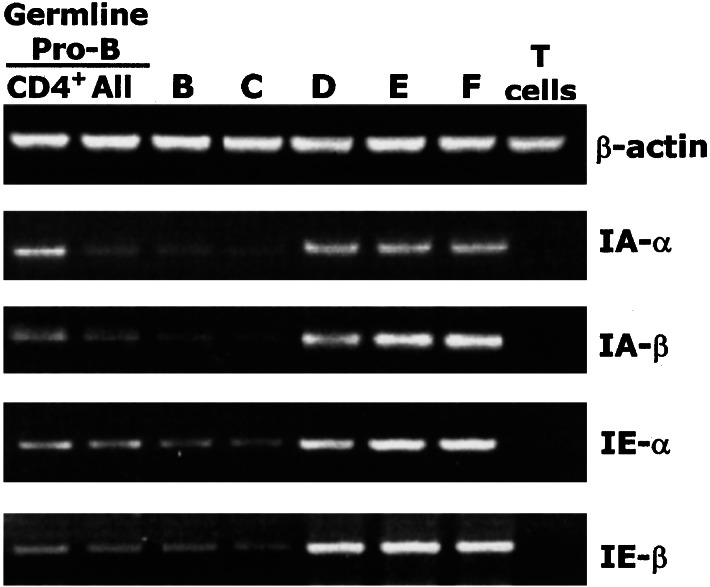
The following studies confirm the expression of Ia on pro-B cells: (i) FACS analyses such as those described above detect Ia+ cells at similar frequencies in the germ-line pro-B cell fraction in adult BM from C57BL/6J (I-Ab), BALB/c, and BALB/c GFP transgenic (I-Ad and I-Ed), and C3H (I-Ak), when the BM cells from these various “normal” strains are stained with antibodies reactive with the appropriate MHC haplotype (data not shown). Thus, the detection of the Ia+ cells is not a property of the anti-Ia reagent used for staining nor of the MHC haplotype or genetic background. (ii) RT-PCR analysis shows that mRNA encoding all four class II genes, I-Aα, I-Aβ, I-Eα and I-Eβ, is detectable in extracts from FACS-sorted populations of CD4+ germ-line pro-B, total germ-line pro-B and Frs. B and C (Fig. 8). Furthermore, these analyses show that the amounts of I-A and I-E transcripts in the pro-B cells and in cells at later differentiation stages correlate with the surface expression levels measured by FACS. (iii) Ia+ cells are present at similar frequencies in germ-line pro-B from μMT and RAG2−/− gene targeted mice (Hi-D FACS data not shown). Thus, the detection of Ia+ cells in pro-B cells in normal adult BM does not reflect contamination with pre-B or mature B cells.
Figure 8.
RT-PCR analyses of Ia expression in germ-line pro-B cells and Hardy Frs. B–F. BALB/c BM was sorted with the gates shown in Figs. 3 and 7 to obtain the listed fractions.
The Germ-Line Pro-B Population in Fetal and Neonatal Animals Differs from the Germ-Line Pro-B Population in Adults.
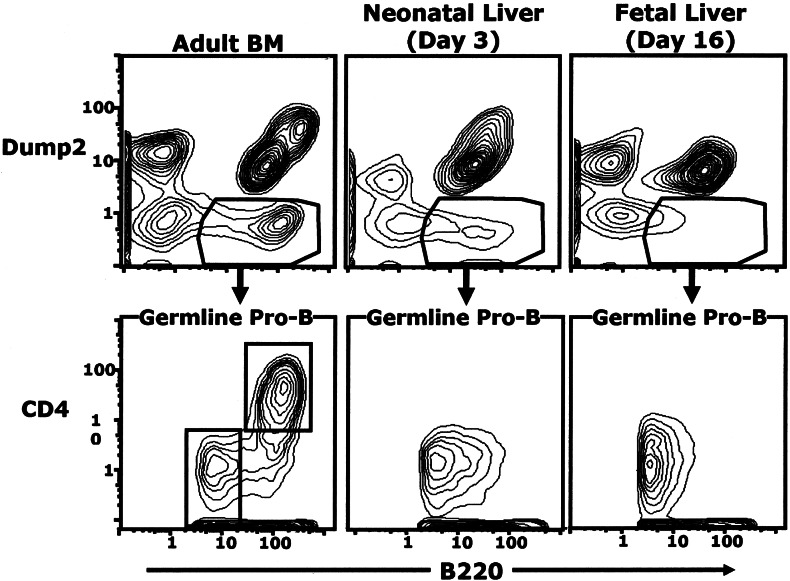
Although the CD4+ germ-line pro-B subset constitutes the majority subset (>60%) of the germ-line pro-B cells in mice over 8 weeks of age, it surprisingly is not detectable in fetal and neonatal animals (Fig. 9). All of the germ-line pro-B in these animals are CD4− and express the low B220 levels characteristic of the adult CD4− subset. Thus, the CD4− germ-line pro-B cell subset is the only germ-line pro-B subset during the fetal and neonatal period.
Figure 9.
The CD4+ germ-line pro-B subset is not present during fetal/neonatal B cell development. Plots show data for live Dump1− cells from BALB/c animals at the ages listed. Dump2+ cells include Hardy Frs. B–F. Brightest dump2+ B220+ cells (Upper Right) include mature B-2 cells.
The CD4− germ-line pro-B cells in the fetal/neonatal animals may not, however, be identical to their counterparts in adults. Careful comparison of Ia expression by the fetal/neonatal germ-line pro-B cells indicates that they do not express any detectable Ia whereas the CD4− germ-line pro-B cell subset in adult BM may express Ia levels that are marginally detectable by FACS and RT-PCR but apparently higher than those expressed by the fetal/neonatal cells (data not shown).
Discussion
Studies here confirm the previous CD4-based subdivision of the earliest stage in the B cell development pathway [after hematopoietic stem cells become committed to B lymphoid lineage (6) but before Ig rearrangement to DHJH occurs] and surprisingly demonstrate a sharp developmental distinction between the subsets defined by the expression of this (and other) markers. In essence, 11-color (Hi-D) FACS studies presented here demonstrate that the expression of CD4 and B220 defines two subsets of germ-line pro-B in adults and show that one of these subsets (CD4+ and B220 intermediate) is only detectable in adults. The other subset (CD4− and B220 low) represents only a minority of germ-line pro-B in adults whereas it, or a phenotypically similar population, constitutes the entire germ-line pro-B population in fetal and neonatal mice.
Studies here also show that the majority of the CD4+ germ-line pro-B cells express MHC class II (Ia). Previous FACS studies have detected Ia expression on pre-B cells but failed to detect expression of this marker on earlier cells in the B cell development pathway. However, the greater precision enabled by Hi-D FACS analysis shows that, in adults, Ia expression during B cell development begins at the germ-line pro-B stage and that the level of Ia that is expressed increases in stages as the B cell development proceeds.
These findings, confirmed by RT-PCR analysis, are consistent with evidence from previous functional studies showing that differentiation of pro-B cells to pre-B cells is impaired in mice expressing antisense Ia beta chain DNA (14). In addition, findings from this previous study shows that adding anti-Ia monoclonal antibody to adult bone marrow cultures does not inhibit the maturation of pre-B cells to IgM+ B cells but completely blocks the generation of pre-B cells from B cell progenitors (pro-B cells) in the same culture (14). Thus, although previous FACS studies failed to detect Ia expression before the pre-B cell stage of B cell development, evidence from these antisense and anti-Ia inhibition studies complements our findings to firmly establish the expression of Ia on functional CD4+ pro-B cells.
Questions have been raised as to whether CD4+ cells with a germ-line pro-B cell phenotype are capable of giving rise to cells further along the B cell development pathway (10). Indeed, these cells are not responsive in in vitro single-cell cultures in which CD4− cells readily differentiate further toward B cells (9). Nevertheless, we have shown here that the cells we have designated CD4+ germ-line pro-B cells express a series of internal markers, including sterile μ and Igβ, that are characteristic of cells in the B cell development pathway. In addition, as indicated above, earlier studies link Ia expression to the differentiation of pro-B cells to pre-B cells. Because we have shown that the Ia+ cells are largely contained within the CD4+ population, these earlier data are interpretable as validating the functional capabilities of the CD4+ germ-line pro-B defined here.
The absence of the CD4+ germ-line pro-B subset in fetal/neonatal animals suggests an interesting distinction between the developmental commitment of these pro-B and the CD4− pro-B that are present in adult BM. Cotransfer studies conducted some time ago (20) demonstrated that early (uncommitted) progenitors for B-1 and -2 cells are distinct by showing that B220− progenitors from adult BM fail to give rise to B-1 cells in the same lethally irradiated animals in which B220− progenitors from fetal or neonatal sources readily reconstitute the B-1 population. Findings presented here add that the CD4+ pro-B cell subset found in adults is not represented in the B cell development pathway in fetal and neonatal animals—i.e., the germ-line pro-B cell population in these animals consists entirely of CD4− cells.
Ia expression has also been shown to distinguish later stages of B cell development in neonates and adults. That is, Ia is detectable on pre-B and later stages in the adult B cell development pathway but is not detectable on B lineage cells in fetal and neonatal animals until developing B cells express surface Ig and are close to maturity (12, 13). Our data extend these earlier findings by showing that Ia is expressed at lower but clearly detectable levels on the CD4+ subset of adult pro-B cells, beginning at the earliest stage of pro-B cells development, but that this subset is missing in neonates.
These findings are consistent with a two-lineage B cell development model, because B-1 cells (mainly B-1a) are the principal outcome of B cell development in fetal and neonatal animals, whereas B-2 cells and some B-1 cells (mainly B-1b) are the products of B cell development in adults. In a simple model consistent with this evidence, the CD4+ germ-line pro-B could be seen as progenitors of B-2 cells, whereas the CD4− germ-line pro-B could be seen as progenitors of B-1a cells in neonates and of B-1b and perhaps marginal zone cells in adults.
Acknowledgments
We thank Yang Yang for PCR assistance, Shaun Kunnavatana for help in making conjugations, and the Stanford FACS development group for their efforts in developing and optimizing the 11-color, Hi-D FACS. Brian Devlin provided useful insights during many discussions of the work presented here. We also thank Dr. R. R. Hardy (Fox Chase Cancer Center, Philadelphia), both for supplying PCR primer sets for several of the markers studied here and for critical review of this manuscript. This work was supported in part by National Institute of Health Grants LM04836 and HL68522 (to L.A.H.).
Abbreviations
- RT
reverse transcription
- BM
bone marrow
- Fr.
Fraction
- FACS
fluorescence-activated cell sorter
References
- 1.Kearney J F, Cooper M D, Klein J, Abney E R, Parkhouse R M, Lawton A R. J Exp Med. 1977;146:297–301. doi: 10.1084/jem.146.1.297. [DOI] [PMC free article] [PubMed] [Google Scholar]
- 2.Hardy R R, Carmack C E, Shinton S A, Kemp J D, Hayakawa K. J Exp Med. 1991;173:1213–1225. doi: 10.1084/jem.173.5.1213. [DOI] [PMC free article] [PubMed] [Google Scholar]
- 3.Rolink A, Melchers F. Adv Immunol. 1993;53:123–156. doi: 10.1016/s0065-2776(08)60499-x. [DOI] [PubMed] [Google Scholar]
- 4.Li Y S, Wasserman R, Hayakawa K, Hardy R R. Immunity. 1996;5:527–535. doi: 10.1016/s1074-7613(00)80268-x. [DOI] [PubMed] [Google Scholar]
- 5.Rolink A, ten Boekel E, Melchers F, Fearon D T, Krop I, Andersson J. J Exp Med. 1996;183:187–194. doi: 10.1084/jem.183.1.187. [DOI] [PMC free article] [PubMed] [Google Scholar]
- 6.Allman D, Li J, Hardy R R. J Exp Med. 1999;189:735–740. doi: 10.1084/jem.189.4.735. [DOI] [PMC free article] [PubMed] [Google Scholar]
- 7.Busslinger M, Nutt S L, Rolink A G. Curr Opin Immunol. 2000;12:151–158. doi: 10.1016/s0952-7915(99)00065-5. [DOI] [PubMed] [Google Scholar]
- 8.Hardy R R, Li Y S, Allman D, Asano M, Gui M, Hayakawa K. Immunol Rev. 2000;175:23–32. [PubMed] [Google Scholar]
- 9.Wineman J P, Gilmore G L, Gritzmacher C, Torbett B E, Muller-Sieburg C E. Blood. 1992;80:1717–1724. [PubMed] [Google Scholar]
- 10.Kouro T, Medina K L, Oritani K, Kincade P W. Blood. 2001;97:2708–2715. doi: 10.1182/blood.v97.9.2708. [DOI] [PubMed] [Google Scholar]
- 11.Dasch J R, Jones P P. J Exp Med. 1986;163:938–951. doi: 10.1084/jem.163.4.938. [DOI] [PMC free article] [PubMed] [Google Scholar]
- 12.Hayakawa K, Tarlinton D, Hardy R R. J Immunol. 1994;152:4801–4807. [PubMed] [Google Scholar]
- 13.Lam K P, Stall A M. J Exp Med. 1994;180:507–516. doi: 10.1084/jem.180.2.507. [DOI] [PMC free article] [PubMed] [Google Scholar]
- 14.Miki N, Hatano M, Wakita K, Imoto S, Nishikawa S, Tokuhisa T. J Immunol. 1992;149:801–807. [PubMed] [Google Scholar]
- 15.Kitamura D, Roes J, Kuhn R, Rajewsky K. Nature (London) 1991;350:423–426. doi: 10.1038/350423a0. [DOI] [PubMed] [Google Scholar]
- 16.Shinkai Y, Rathbun G, Lam K P, Oltz E M, Stewart V, Mendelsohn M, Charron J, Datta M, Young F, Stall A M, et al. Cell. 1992;68:855–867. doi: 10.1016/0092-8674(92)90029-c. [DOI] [PubMed] [Google Scholar]
- 17.Roederer M, Kantor A B, Parks D R, Herzenberg L A. Cytometry. 1996;24:191–197. doi: 10.1002/(SICI)1097-0320(19960701)24:3<191::AID-CYTO1>3.0.CO;2-L. [DOI] [PubMed] [Google Scholar]
- 18.Bigos M, Baumgarth N, Jager G C, Herman O C, Nozaki T, Stovel R T, Parks D R, Herzenberg L A. Cytometry. 1999;36:36–45. doi: 10.1002/(sici)1097-0320(19990501)36:1<36::aid-cyto5>3.3.co;2-0. [DOI] [PubMed] [Google Scholar]
- 19.Lu L S, Auerbach R. J Immunol. 1998;161:1284–1291. [PubMed] [Google Scholar]
- 20.Hayakawa K, Hardy R R, Herzenberg L A. J Exp Med. 1985;161:1554–1568. doi: 10.1084/jem.161.6.1554. [DOI] [PMC free article] [PubMed] [Google Scholar]


