Abstract
By combining dynamic mechanical and optical measurements in probing the internal structure of a biopolymer network (gelatin gel), we studied the quasi-equilibrium evolution of helical content as a function of the applied stress. Assuming that the net optical activity is proportional to the concentration of secondary helices of collagen chains, and assuming that affine mechanical deformation, we find a nonmonotonic relationship between the helical domains and an imposed deformation. The results are in qualitative agreement with theoretical predictions of α-helices induced by chain end-to-end stretching, and give a consistent picture of mechanically stimulated helix-coil transition in networks of denatured polypeptides.
Keywords: collagen, helix, optical rotation, gelatin, chirality
In recent years, a new field has emerged at the interface of physics and biology, aiming to explore structure and responses at molecular-length scales. Many single-molecule experiments have been performed to measure forces generated by biopolymers and their response to applied extension forces. The now classical work on DNA stretching (1) is just one of a number of significant recent advances in this field. By monitoring the response of a single molecule to pulling and twisting its ends [using atomic force microscopy (AFM), and magnetic trap and optical tweezer methods (2, 3)], one can probe the question of how chiral biopolymers are held in their native state, and their pathways of folding and unfolding. However, although the current techniques used in single-molecule force experiments reveal spectacular force-extension curves, they give little direct information about the structural transitions that occur on extension of these chains. Theoretical modeling of the behavior of single biopolymer molecules on extension has been hampered by this lack of information concerning structural changes. Using a new macroscopic approach of combining mechanical and optical methods in probing the internal structure of the biopolymer network, we found a direct relationship between helical domains and an externally imposed end-to-end distance of chains.
Certain homopolypeptides form regular α-helices under appropriate conditions. In this case, the molecular configurations are well understood and are described according to the Zimm-Bragg model (4) [and its many modifications (5)], which assumes that each chain segment has access to only two conformational states, the random-coil state and the helical state. The average helical fraction of the chain can then be calculated for any number of model interactions between these two states. Although the two-state model of polypeptides has a lot of support, especially revealed in the Ramachandran plots, showing that peptide backbone has two well separated states corresponding to the α-helix and the β-sheet (the high-temperature denatured coil being the random mixing between the two), from the field-theoretical point of view, it is desirable to have a continuum model of chain conformation, as a function of interaction potentials, temperature, and external fields.
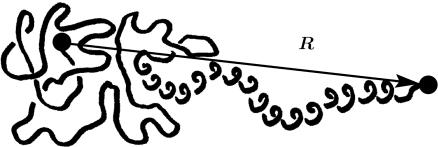
In recent work of Tamashiro and Pincus (6) and of Buhot and Halperin (7), it is shown that imposing an extension on a chain, which is above but close to the spontaneous helix-coil transition, one can stimulate the helical state (which corresponds to a natural enthalpy well Δh) by reducing the randomizing effect of chain entropy (Δs < 0) by stretching its ends. The problem can be simplified by neglecting the mixing entropy, without changing the outcome qualitatively, by assuming that the helical and coil domains are separated into two blocks with a fixed interface energy Δft (Fig. 1). The free energy of the chain in this case is then given by
 |
[1] |
Fig. 1.
The sketch of the chain with helical and coil fractions, at constrained end-to-end distance R.
where Δf = Δh - TΔs > 0, N is the total number of monomers of length a. The entropic free energy describes the coil fraction with an end-to-end distance R, reduced by the distance bridged by the helical part of the chain, and the contour length available to the coil, (1 - χ)N. Here, χ ∈ (0,1) is the helical content and γ the geometric factor accounting for the helix length, per monomer. For certain parameters, this model predicts that the helical content of the chain, χ(R), may increase on stretching (with or without a threshold), until eventually all of the chain is in the α-helix; on further extension, one would of course force the helix to unwind.
This model of a single helix-forming chain was extended to predict the stimulated helix-coil transition occurring in networked systems under stress (8). Within a basic network theory, assuming the affine deformation of random strands through their endpoints and performing the quenched average over the network topology, the mean helical content (per chain) is given by
 |
[2] |
where  is the affine volume-conserving network strain and the quenched probability distribution P(R) ∝ exp(-Fch/kBT). In a random network, depending on their orientation, some strands are extended and some are compressed; the average helical content
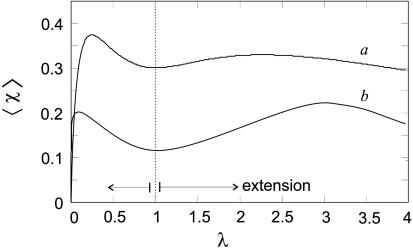
  , however, remains a nonmonotonic function of uniaxial extension as long as the chains are “slightly denatured” (above but close to their natural helix-coil transition: Δf positive but small). Fig. 2 shows an example of the predictions of this model.
Fig. 2.
The mean helical fraction of a network stretched by a factor λ, according to ref. 8 for n = 100 and βΔf = 0.05 (curve a), βΔf = 0.1 (curve b, for chains further away from the helix-coil transition).
Experimentally, to have access to the relationship between the helical ordering and the end-to-end distance of individual chains, one needs to be able to control the distance R and simultaneously measure the helical content. Transparent biopolymer gels are good candidates because they can be stretched and their optical activity simultaneously measured. Due to the coherent chiral ordering, helical domains rotate the polarization of light much more strongly than the individual chiral monomers in the coil state. This finding has been verified by many independent tests, including a study of artificially made helices of copper wire spirals, when the material itself possesses no chirality, but the helical structure imposes the optical activity (9). Thus, the measure of optical activity gives a direct indication of the fraction of monomers in the helical states, and has been extensively used to characterize the helix-coil transition before the advent of modern circular-dichroism (CD) techniques. We mention, as an aside, that there are many arguments in favor of pure optical rotation in the nonabsorbing region of wavelengths as the method of choice for capturing the “phase chirality,” the helical coherence in monomer positions and orientations (as opposed to the CD, based on subtle changes in photon absorption on various molecular bonds, which is very hard to unambiguously interpret).
Experimental Details
We used gelatin as a model system of helix-forming polymer networks. Gelatin gels are well described in the literature (10, 11) and are by far the most studied functional biopolymer, because of their intensive industrial use. The gelatin network is held together by effective crosslinks made of right handed (tertiary) superhelices stabilized by hydrogen bonds, resulting from the wrapping of three left-handed helical segments of otherwise denatured collagen chains. For practical reasons, in this model study, gels were made by dissolving gelatin powder (16% wt/wt, Sigma) in ethylene glycol instead of water, to minimize mass reduction due to evaporation.
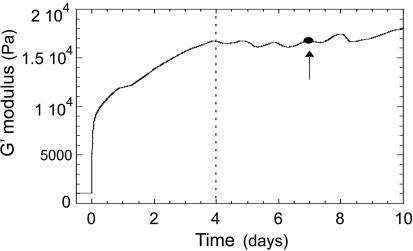
The mixture was kept at T = 65°C, above the gel transition temperature and stirred continuously until homogeneity was assured. After cooling to room temperature, a cross-linked gel sheet of typical dimensions 1.5 × 7 × 20 mm was obtained. The elastic properties of a 16% sample were separately measured by the dynamic stress rheometer (Rheometrics DSR). Fig. 3 shows the evolution in storage modulus, G′, over 10 days after quenching: G′ rises initially, reaching an approximately constant value of 1.7 × 10⁴ Pa after 4 days, as indicated on the plot, at which point we assume the equilibrium crosslinking is completed (leaving aside delicate issues of slow drift of collagen toward its natural state, irrelevant on our time scales). All experiments were performed after 7 days, when the storage modulus G′ had reached this quasi-equilibrium state.
Fig. 3.
Elastic modulus (G′) of a gelatin gel (16% wt/wt in ethylene glycol) as a function of the time after quenching. All opto-mechanical experiments were performed after 7 days, as shown by the arrow.
The opto-mechanical experiments were carried out by combining a dynamical method for the optical rotation and a stretching apparatus (Fig. 4). The sample is mounted between clamps controlled by a stepper motor (providing the uniaxial extension λ) and linked to a dynamometer. The imposed strain rate was typically of the order of 0.001 s-1 (we shall see below that the results are fully reversible at this rate). Simultaneously, the optical rotation Ψ of the gel was determined by measuring the phase difference between the split parts of a linearly polarized laser beam (He-Ne laser, Λ = 633 nm, 30 mW; Melles-Griot, Irvine, CA), one passing through the sample and the rotating analyzer (fixed frequency ≈16 Hz), the other through the optical chopper (providing the reference signal to lock on to). The phase difference ΔΘ between the two beams is measured with a lock-in amplifier (Stanford Research, Sunnyvale, CA) and gives directly the total rotation angle Ψ. The helix content is a material function proportional to the rate of optical rotation ∂Ψ/∂z, so, to evaluate it, we need to take into account the change of path length d (along z) as a function of the imposed uniaxial extension λ = λxx. Assuming volume conservation λxxλyyλzz = 1 so that  , and the total optical rotation is corrected to give
  . The true stress σ also needs to be adjusted from the measured nominal stress for decrease of the the (yz) area on stretching, giving σ′ = σλ.
Fig. 4.
Schematic of the apparatus, which combined optical rotation rate ∂Ψ/∂z and stress-strain σ = f(λ) measurements.
Results and Discussion
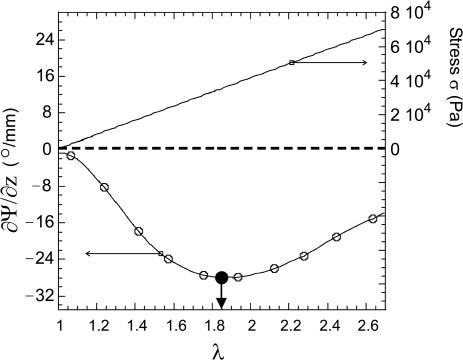
Figure 5 shows the result of a typical stretching experiment. The initial optical rotation of the network is negative, ∂Ψ/∂z (λ = 1) ≈-0.63°/mm, which in our setup corresponds to left-handed rotation. This result suggests a number of left-handed helices present in the equilibrium unstretched sample, some of which associate to form triple helical junction zones. The optical rotation measurement is mainly sensitive to the left-handed helical conformation of individual chains. Triple helix association marginally distorts the chains and has little effect on their rotatory properties (12). This is, in fact, expected because of the different length scale of this tertiary winding and its weaker interaction with light. On stretching, the magnitude of (negative) optical rotation increases as a function of imposed extension λ, and soon becomes very large. Its variation with extension is distinctly nonmonotonic, with a maximum of ∂Ψ/∂z ≈ -44.4°/mm achieved for λ ∼ 1.85, as shown by the arrow. On the corresponding stress-strain curve, no mechanical anomalies are detected: σ′ varies linearly with λ. This is a very important observation, indicating that the Young modulus E (given by the amount and configuration of network crosslinks) remains constant throughout the stretching. This Young modulus was determined from the slope of σ′(λ) line and matches well with the G′ data from the dynamical rheometer (E = 3G for an incompressible gel).
Fig. 5.
Evolution of the rotation rate ∂Ψ/∂z (left axis) and stress σ′ (right axis) as functions of imposed λ.
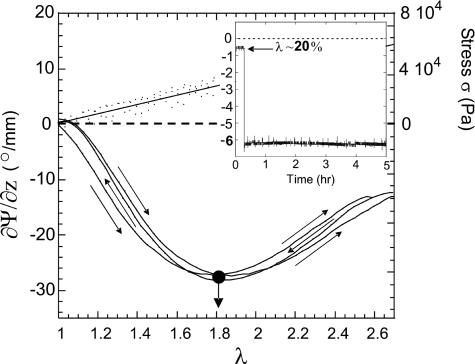
The change in average helical content on stretching might have been due to topological rearrangement of triple-helical junction zones. However, Fig. 6 shows the result of a repeated stretching-contracting cycle experiment. The crosslinked gel is initially extended up to λ = 2.5; the direction of strain is then reversed to return the sample to its unstretched length at the same (slow) rate as it was extended. The sample is then stretched again. For both ∂Ψ/∂z and σ, the differences on cycling the deformation are slight, implying that the hysteresis of the gel is small and quasi-equilibrium effects are being seen. This finding, and the consistently linear stress-strain variation, suggest that the density and the conformation of triple-helical crosslinks in the gel are preserved, even at high extensions. To test the equilibrium in a different way, an unstretched sample was extended instantaneously to λ = 1.2. The optical rotation and stress on the sample were measured over the next 14 h (Fig. 6 Inset). Because there was a only very slow decrease in both Ψ and σ, the effects observed, while stretching the sample at a rate of 10-3 s-1 are close to equilibrium.
Fig. 6.
Evolution of the rotation rate ∂Ψ/∂z and stress σ with deformation, for a cycle of loading and unloading, showing a high degree of reversibility. (Inset) Evolution of rotation rate with time after a strain step of 20%, illustrating stability of the microstructure.
Another question might be whether the changes observed in optical rotation are due to the birefringence induced in the samples by stretching. The gel is initially isotropic, but on stretching the statistical distribution of the polymer is deformed from the isotropic state. The birefringence, Δn, is defined as Δn = nSD - nND, where nSD and nND are the refractive indices in the stretching and normal directions. It can be shown (13) that the induced birefringence is proportional to the difference in normal stress, Δn = C(σzz - σxx), where C is the stress-optical coefficient, which depends only on the local structure of the polymer. This effect was measured separately, with the aid of a quarter wave-plate inserted in the beam path of our apparatus, by using a method based on phase differences of coherent light and therefore was insensitive to the intensity changes due to, for example, scattering. The resulting value of stress-optical coefficient C ≈ 1.6 × 10⁻⁶ cm2/N agrees well with the literature data on a variety of polymer networks, from dry rubber to highly swollen gels (14, 15). If the sample did not generate additional helices, we would then measure the rotation of polarization by an angle Θ, related to the induced birefringence Δn: at an oblique angle of polarization Θ ∼ πΔn λzzd/Λ, where Λ is the laser wavelength and d sample thickness. This value of Θmax ∼ 6° at our highest extension has very little effect on our main results (in fact, the effect is much smaller because our incident polarization is aligned with the axes of deformation).
From the analysis above, it seems unambiguous that the nonmonotonic variation of ∂Ψ/∂z observed in the gelatin network under deformation is not due to stress birefringence, nor to structural changes of the triple helical junction zones. Therefore, the observed changes in optical rotation on stretching are caused by changes in the gelatin network strands. The imposed strain provokes the transition of the denatured chains, which form the rubbery network, to the left-handed α-helical state, i.e., forces them some way toward the natural folding. The coherent chiral ordering in the helical domains results in the increasing left-handed rotation signal obtained. As the extension increases, the rotation signal reaches a maximum at λ ≈ 1.85, corresponding to the maximum content of helices in the network. At a very high strain λ > 2, these induced helices start to unwind under the increasing force provided to each strand, whereas the junction zones seem to be still intact (from the linear stress-strain relation). This crossover is a consequence of the change in the nature of the helix coil transition, which becomes a helix-extended coil transition for strong forces (16).
Conclusions
We applied the theoretical analysis of model (8) to our specific case of gelatin network by performing a numerical integration of Eq. 2 for the mean helical fraction. This result is shown in Fig. 2. The average strand length N is not easy to estimate, because the crosslinks are self-assembled. The distance between crosslinks ξ is estimated from (unentangled) rubber-elasticity value G ∼ kBT/ξ3. For a 16% 7-day-old gel, this relation gives ξ ∼ 6 nm, or N ∼ 100 for our networks. Fig. 2 shows simulation results for the cases βΔf = 0.05 and βΔf = 0.1 (the distance, in dimensionless energy terms, from the natural helix-coil transition). As the optical rotation linearly increases with helical content, this model shows qualitatively the same variation with extension as the reported experiment. The curve (a) is chosen because of its maximum around λ ∼ 2.
In summary, we demonstrated experimentally the relationship of the average helical content in a network of helix-forming biopolymer and the deformation imposed on this network. The spectacular, large, and nonmonotonic response is observed in quasi-equilibrium conditions. We do not propose that the theoretical model explains the findings in any detail, but the qualitative agreement of the results with the theoretical predictions for βΔf = 0.05 and N ∼ 100 gives a consistent picture of induced helix-coil transition occurring in polymer networks under stress. It remains to be seen that these values of βΔf and N are suitable for gelatin. Detailed analysis is complicated by the fact that the helices formed in collagen chains are not regular α-helices. Sequences of -(Gly-X-Pro)- and -(Gly-X-Hypro)- are often repeated along the collagen polypeptide chain. The rigid lateral pyrrolidine rings of the proline and hydroxyproline residues have important steric hindrances. The presence of these residues enhances rigidity, and hydroxyproline further stabilizes the structure through additional hydrogen bonds. Therefore, the model of the free energy given in Eq. 1 may need to be modified. It may be important to repeat these experiments with a gel composed of polypeptides that form regular α-helices, such as fibrin. An extension to these experiments would be to examine the optical activity of a natural collagen network.
Acknowledgments
Discussions with R. Colby, A. Craig, and S. Kutter, and the help of K. Lim with many of the measurements are gratefully appreciated. We thank the Engineering and Physical Sciences Research Council (U.K.) for financial support.
References
- 1.Smith, S. B., Finzi, L. & Bustamante, C. (1992) Science 258, 1122-1126. [DOI] [PubMed] [Google Scholar]
- 2.Wang, M. D., Yin, H., Landick, R., Gelles, J. & Block, S. M. (1997) Biophys. J. 72, 1335-1346. [DOI] [PMC free article] [PubMed] [Google Scholar]
- 3.Smith, D. A. & Radford, S. E. (2000) Curr. Biol. 10, R662-R664. [DOI] [PubMed] [Google Scholar]
- 4.Zimm, B. H. & Bragg, J. K. (1959) J. Chem. Phys. 31, 526-535. [Google Scholar]
- 5.Grosberg, A. Y. & Khokhlov, A. R. (1994) Statistical Physics of Macromolecules (AIP Press, New York).
- 6.Tamashiro, M. N. & Pincus, P. (2001) Phys. Rev. E 63, 021909. [DOI] [PubMed] [Google Scholar]
- 7.Buhot, A. & Halperin, A. (2002) Macromolecules 35, 3238-3252. [Google Scholar]
- 8.Kutter, S. & Terentjev, E. M. (2002) Eur. Phys. J. E 8, 539-547. [DOI] [PubMed] [Google Scholar]
- 9.Tinoco, I. & Freeman, M. P. (1957) J. Phys. Chem. 61, 1196-1200. [Google Scholar]
- 10.Joly-Duhamel, C.& Hellio, D. (2002) Langmuir 18, 7208-7217. [Google Scholar]
- 11.Guenet, J.-M. (1992) Thermoreversible Gelation of Polymers and Biopolymers (Academic, London).
- 12.Djabourov, M., Leblond, J. & Papon, P. (1988) J. Phys. France 49, 319-332. [Google Scholar]
- 13.Doi, M. & Edwards, S. F. (1986) The Theory of Polymer Dynamics (Oxford Univ. Press, Oxford).
- 14.Rennar, N. (1998) Phys. Chem. Chem. Phys. 102, 1665-1671. [Google Scholar]
- 15.Hahn, O. & Woermann, D. (1997) Phys. Chem. Chem. Phys. 101, 703-707. [Google Scholar]
- 16.Varshney, V. & Carri, G. A. (2005) Macromolecules 38, 780-787. [Google Scholar]


