

Abstract
Regulation of gene expression underlies cell differentiation and organogenesis. Both transcription factors and chromatin modifiers are crucial for this process. To study the role of the ATP-dependent SWI/SNF chromatin-remodeling complex in cell differentiation, we inactivated the gene encoding the core complex subunit SNF5/INI1 in the developing liver. Hepatic SNF5 deletion caused neonatal death due to severe hypoglycemia; mutant animals fail to store glycogen and have impaired energetic metabolism. The formation of a hepatic epithelium is also affected in SNF5-deficient livers. Transcriptome analyses showed that SNF5 inactivation is accompanied by defective transcriptional activation of 70% of the genes that are normally upregulated during liver development. These include genes involved in glycogen synthesis, gluconeogenesis and cell–cell adhesion. A fraction of hepatic developmentally activated genes were normally expressed, suggesting that cell differentiation was not completely blocked. Moreover, SNF5-deleted cells showed increased proliferation and we identified several misexpressed genes that may contribute to cell cycle deregulation in these cells. Our results emphasize the role of chromatin remodeling in the activation of cell-type-specific genetic programs and driving cell differentiation.
Keywords: cell differentiation, Cre-loxP, INI1, proliferation, transcriptome
Introduction
During the past decade, it has become clear that modulation of the chromatin state plays a major role in the regulation of gene expression in eukaryotes (see Khorasanizadeh, 2004). The chromatin state is affected by covalent modification of histone tails which are associated with either activated or repressed transcription (see Fischle et al, 2003). Such modifications can influence both the accessibility of nucleosomal DNA and the recruitment of regulatory proteins. Chromatin structure can also be affected by large remodeling complexes that are well conserved between eukaryotes, such as the SWI/SNF (switching defective/sucrose nonfermenting) complex (see Becker and Horz, 2002; Martens and Winston, 2003). First described in the yeast Saccharomyces cerevisiae, the 2 MDa SWI/SNF complex includes a DNA-dependent ATPase subunit, SNF2, that functions as the motor of the complex. Yeast contains a single SNF2 gene, whereas two homologous genes have been characterized in mammals, Brm/SNF2α and Brg1/SNF2β. These two subunits are mutually exclusive in mammalian complexes. In addition to the catalytic subunit, two other proteins form the core complex: SNF5/INI1/BAF47 and SWI3 (BAF170 or BAF155 in mammals) (Phelan et al, 1999). These core subunits are thought to be present in all SWI/SNF complexes that contain in addition roughly 10 distinct subunits.
The SWI/SNF complex plays an important role in transcriptional regulation in the yeast S. cerevisiae. Whole-genome transcription analysis revealed that roughly 6% of the genes are SWI/SNF-dependent (Holstege et al, 1998; Sudarsanam et al, 2000). Several studies suggest that the SWI/SNF complex does not only act as a transcriptional activator, but can also be a repressor (Sif et al, 2001; Martens and Winston, 2002).
In multicellular organisms, cell differentiation requires extensive reprogramming of gene transcription. In addition to cell type-specific transcription factors, chromatin modifiers are thought to be involved in this process. Nevertheless, few studies have addressed the in vivo role of chromatin-remodeling complexes in cell differentiation. The first evidence for such a role in mammalian cells came from the use of homologous recombination in mice: targeted inactivation of several core subunits of the SWI/SNF complex, namely Brg1, SNF5 and BAF155, results in embryonic lethality at the peri-implantation stage (Bultman et al, 2000; Klochendler-Yeivin et al, 2000; Roberts et al, 2000; Guidi et al, 2001; Kim et al, 2001). In all the three knockout mice, inner cell mass development is altered, and Brg1 and SNF5 inactivation also affect the trophectoderm lineage. However, the transcriptional targets of SWI/SNF activity at this early stage are unknown. Using cell-specific inactivation systems, Brg1 has recently been shown to be required for T-cell development (Chi et al, 2003; Gebuhr et al, 2003). These studies suggest that Brg1 (and therefore the SWI/SNF complex) is essential to allow gene activation in response to signaling pathways that drive successive steps of T-cell differentiation. The use of in vitro models of cell differentiation has also provided some insights into the role of SWI/SNF complex. For example, SWI/SNF activity is required for the activation of several muscle-specific genes upon MyoD induction (de la Serna et al, 2001). However, the consequences of SWI/SNF inactivation on global genome reprogramming have not been investigated in these systems.
Here, we studied the role of the SWI/SNF complex in cell differentiation using the hepatoblast–hepatocyte lineage as a model. We conducted specific inactivation of the complex core subunit SNF5 in these cells and evaluated its impact at the cellular and molecular levels. We show that liver-specific SNF5 inactivation impairs glycogen storage and epithelial morphogenesis, which are characteristics of hepatocyte differentiation. Transcriptome analyses revealed that these defects are associated with defective transcriptional activation of 70% of the genes that are normally upregulated during liver development. Our results provide a link between chromatin remodeling and development and show that SWI/SNF-dependent chromatin remodeling is required for the genetic programming of differentiated cells.
Results
Liver-specific inactivation of SNF5 in SNF5flox/− mice results in perinatal lethality
We generated a SNF5 conditional allele in which two loxP sites flanked exons 1 and 2 of the gene (SNF5flox). Cre-mediated recombination results in deletion of the two first exons of SNF5, including the initiation ATG codon, and generates a null allele. SNF5 was inactivated in the developing liver using the AlfpCre transgene. AlfpCre-driven recombination begins at the onset of liver bud formation and leads to complete recombination in liver cells of endodermal origin: hepatocytes and cholangiocytes (Kellendonk et al, 2000; Coffinier et al, 2002). Our breeding strategy (AlfpCre; SNF5+/− × SNF5flox/flox) generated embryos with deleted SNF5 in Cre-expressing cells (AlfpCre; SNF5flox/− refered to as ‘mutants'), and wild-type or heterozygous embryos ((SNF5flox/+), (SNF5flox/−) and (AlfpCre; SNF5flox/+), collectively referred to as ‘controls'). At postnatal day 10, no mutant mice were found (n=65), while at embryonic day (E) 18.5, mutants were present at normal Mendelian ratios (n=27). Close examination revealed that mutant mice were born normally, but died within the first 12 h after birth (n=26). Nonetheless, neither growth retardation nor macroscopic liver defects were observed at birth.
PCR analysis confirmed that the predicted SNF5deleted allele was detected in livers expressing Cre recombinase (Figure 1A). SNF5flox deletion was not complete. This was expected as hematopoietic cells represent more than 50% of total liver cells during fetal life (Paul et al, 1969) and these cells do not express the AlfpCre recombinase. Quantitative RT–PCR carried out on total liver RNAs showed that SNF5 mRNA level was reduced by 2.2-fold in mutant livers (Figure 1B).
Figure 1.
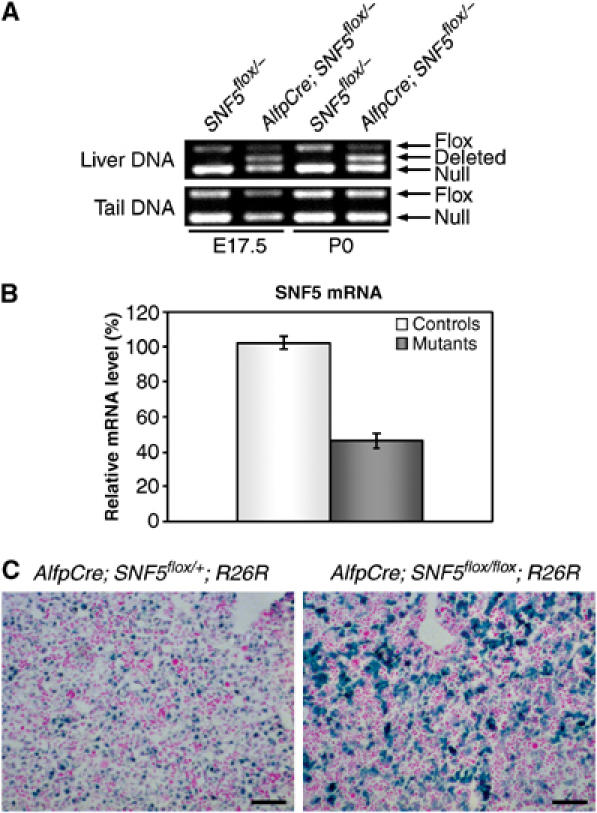
Liver-specific inactivation of SNF5. (A) Detection of Cre-mediated SNF5 deletion in the liver. PCR analysis using primers that amplify the null, flox and deleted alleles. Mice genotypes are indicated on the top. The deleted allele was detectable in the livers expressing Cre recombinase both before (E17.5) and after (P0) birth. (B) Quantitative RT–PCR analysis of SNF5 expression. SNF5 mRNA level was reduced by 2.2-fold in mutant livers at E18.5. Error bars represent standard error of the mean (ncontrol=4, nmutant=4). (C) AlfpCre-mediated recombination is specific of liver parenchymal cells. X-gal staining on liver sections of control AlfpCre; SNF5flox/+; ROSA26R (left panel) and mutant AlfpCre; SNF5flox/flox; ROSA26R (right panel) at E18.5. β-gal activity is an indicator of Cre-driven recombination on the ROSA26 locus. In both controls and mutants, most parenchymal cells were β-gal-positive and hematopoietic cells were β-gal-negative. For unclear reasons, the staining intensity of control parenchymal cells was weaker than that of mutant cells. Scale bars: 200 μm.
To confirm the cell specificity and efficiency of AlfpCre-driven recombination, we also generated mice that included the ROSA26R reporter allele in addition to the floxed SNF5 allele (AlfpCre; SNF5flox/flox; ROSA26R). This allele contains a lacZ gene, whose activity is induced by the Cre-driven recombination (Soriano, 1999). These mice had the same phenotype as AlfpCre; SNF5flox/− animals (data not shown). SNF5 heterozygous littermates (AlfpCre; SNF5flox/+; ROSA26R) were also obtained. X-gal-stained liver sections revealed that in both mutants and controls over 95% of the parenchymal cells were β-galactosidase (β-gal)-positive at E18.5 (Figure 1C). As expected, hematopoietic cells were β-gal-negative. These data indicate that most liver parenchymal cells underwent Cre-mediated recombination.
Glucose metabolism is strongly impaired in SNF5-deleted livers
To unravel the cause of the early postnatal morbidity of mutant mice, we followed the glycemia within hours of birth (P0) and found that mutant mice were strongly hypoglycemic (Table I). The average glycemia of control mice was 58 mg/dl, while all 13 mutants tested presented a glycemia lower than 10 mg/dl. This defect was not linked to a feeding problem, as mutant and control mice digestive tracts both contained milk. Hypoglycemia was also seen in E18.5 mutant mice 2 h after caesarian delivery (data not shown). As these levels of glycemia are not compatible with survival, we conclude that hypoglycemia is the likely cause of perinatal lethality of mutant mice.
Table 1.
Liver-specific inactivation of SNF5 leads to decreased glycemia and hepatic glucose production
| Hepatic glucose production (μmol min−1 g−1) |
||||
|---|---|---|---|---|
| Genotype | Glycemia (mg dl−1) | Total | Gluconeogenesis | Glycogenolysis |
| Control | 58±13 (n=19) | 2.5±0.5 (n=5) | 0.56±0.14 (n=5) | 1.9±0.5 (n=5) |
| Mutant | <10 (n=13) | 0.8±0.2 (n=8) | 0.27±0.08 (n=8) | 0.6±0.3 (n=8) |
Glycogen synthesized from maternal glucose in the liver during gestation is essential to support life during the first hours after birth. To determine if hypoglycemia was linked to a glycogen storage defect, we stained liver sections for glycogen using the Periodic Acid-Schiff (PAS) reaction. Glycogen-specific staining was decreased in mutants at E17.5, E18.5 and P0 (Figure 2A and data not shown). To quantify this defect, we measured glycogen levels in E18.5 and P0 control and mutant livers. Glycogen levels were strongly reduced in mutant livers both before and after birth (Figure 2B).
Figure 2.
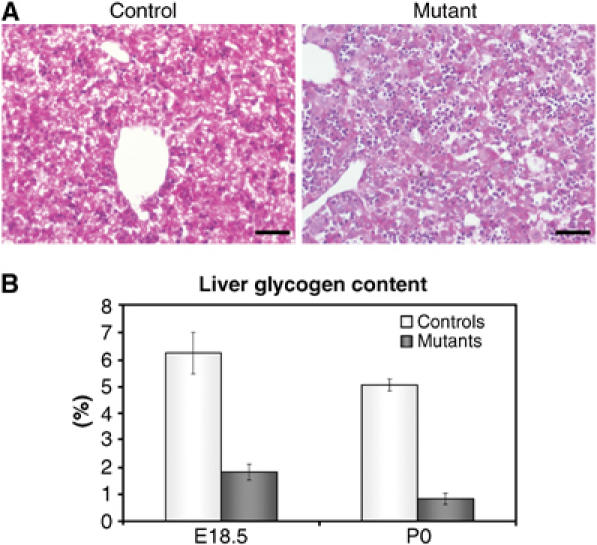
Mice carrying a liver-specific inactivation of SNF5 fail to store glycogen. (A) PAS staining for the presence of glycogen in control (left panel) and mutant (right panel) liver sections at E18.5. Control livers showed extensive glycogen deposition. Staining was almost absent in mutant livers. Scale bars: 200 μm. (B) Glycogen content of mutant livers (w/w) was significantly reduced (P<0.05) when compared to control livers. Error bars represent standard error of the mean (E18.5: ncontrol=5, nmutant=4; P0: ncontrol=5, nmutant=3).
In order to evaluate the actual capacity of mutant livers to synthesize glucose, we measured the hepatic glucose production in newborn liver slices. We found a three-fold reduction (P<0.05) of total glucose production in mutant livers (Table I). Interestingly, this defect was due to a combined significant reduction of both glycogenolysis and gluconeogenesis rates, respectively by three- and two-fold (P<0.05) (Table I). These results suggest that mutant hypoglycemia is the consequence of reduced glycogenolysis due to lower glycogen accumulation, but also to a concomitant decreased in gluconeogenesis, indicating that both pathways supporting liver glucose production are impaired upon SNF5 inactivation.
To gain more insights on the defects in glucose metabolism and on other potential functions of SNF5, we conducted a comparative transcriptome analysis of control versus mutant liver RNAs (see Materials and methods). The data obtained unravel the molecular basis of the drastic reduction in liver glycogen storage. First, expression of the liver glycogen synthase (Gys2) was downregulated by 2.1-fold. Second, a regulatory subunit of protein phosphatase 1 (PP1), Ppp1rc3 (PP1 regulatory subunit 3C, also known as PTG for protein targeting to glycogen), was also expressed at lower levels in mutant livers. This protein targets PP1 to the glycogen particle, and allows it to activate glycogen synthesis and inhibit glycogen breakdown (see Brady and Saltiel, 2001). Finally, we observed a downregulation of the glucose transporter Slc2a2 (Glut2), which should affect glucose uptake from maternal sources before birth (Figure 3).
Figure 3.
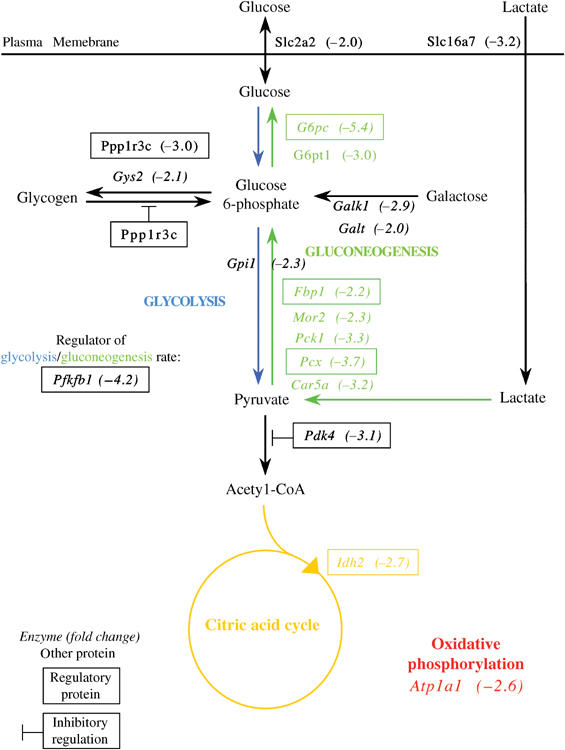
Impaired glucose metabolism upon loss of SNF5 in fetal livers. The scheme shows genes involved in energy metabolism that were significantly downregulated (P<0.05) more than two-fold in E18.75 mutant livers. Key enzymes of gluconeogenesis (Gpc, Fbp1, Pcx) and glycogen synthesis (Gys2) were strongly downregulated. For each gene, the mutant versus control fold change is indicated. Genes encoding enzymes are italicized. Boxed names represent genes encoding regulatory proteins. Gene products involved in gluconeogenesis, citric acid cycle and oxidative phosphorylation are represented in green, yellow and red, respectively.
Hydrolysis of glucose 6-phosphate (G6P) into glucose and phosphate is a common and important step in both glycogenolysis and gluconeogenesis. It is accomplished by two proteins: the G6P ER translocator (G6pt1) and the phosphatase (G6pc) (see van Schaftingen and Gerin, 2002). Both genes were strongly downregulated in mutant livers (Figure 3). Five additional genes involved in gluconeogenesis were also downregulated. This should result in the inactivation of the two irreversible reactions that allow pyruvate to be converted back to G6P: the pyruvate carboxylase (Pcx) step and the fructose-1,6-bisphosphatase 1 (Fbp1) step (Figure 3) (see Hers and Hue, 1983).
Other genes involved in energy metabolism were also affected in mutant livers (Figure 3). The downregulation of the two first enzymes involved in galactose catabolism (galactokinase (Glk) and galactose-1-phosphate uridyl transferase (Galt)) probably affects galactose usage as an energy source. Consequences of downregulation of three other genes, glucose phosphate isomerase 1 (Gpi1), 6-phosphofructo-2-kinase/fructose-2,6-biphosphatase 1 (Pfkfb1) and pyruvate dehydrogenase kinase, isoenzyme 4 (Pdk4), are difficult to predict. Finally, isocitrate dehydrogenase 2 (Idh2) and ATPase, Na+/K+transporting, alpha 1 polypeptide (Atp1a1) downregulation could reduce ATP synthesis in mutant hepatocytes (Figure 3).
Taken together, these data show that SNF5 is essential for glycogen synthesis, glycogenolysis and gluconeogenesis in the liver.
SNF5 is essential for epithelial differentiation of hepatocytes
Establishment of cell–cell junctions is one of the most important steps during terminal hepatocyte differentiation (Feracci et al, 1987). To explore this process, we performed immunodetection of proteins that participate to these junctions. The Zonula occludens 1 (ZO-1) protein is normally localized to tight junctions (Stevenson et al, 1986), as observed in control animals (Figure 4A). In contrast, almost no ZO-1 protein was detected in mutants (Figure 4B), suggesting that tight junctions were absent. E-cadherin is also involved in cell–cell interactions and is normally localized at both adherens junctions and desmosomes (Johnson et al, 1993). The expression of this protein was also downregulated in mutant livers (Figure 4C and D). Furthermore, mutant livers presented ultrastructure abnormalities. Electron microscopy observations showed that intermembrane space between adjacent cells was larger than in controls and that cell–cell junctions were disrupted (Figure 4E and F). Mutant cells also showed abnormal cytoplasms with lower organelle and mitochondria content, again suggesting a defect in terminal hepatocyte differentiation (Figure 4F).
Figure 4.
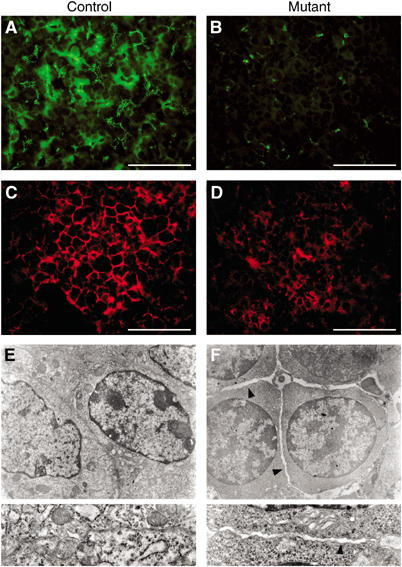
SNF5 inactivation results in the disruption of epithelial architecture of liver parenchyma. (A, B) ZO-1 immunodetection (green) on liver sections in control (A) and mutant (B) mice at E18.5. Tight junctions are stained in control livers. In mutants, almost no signal is detected. (C, D) Loss of E-cadherin (red) in mutant livers (D) when compared to controls (C). Scale bars (A–D): 75 μm. (E, F) Electron micrographs of control (E) and mutant (F) livers at E18.5. Gaps in between cells were observed in mutant livers (arrowheads). Insets show details of cell–cell contacts.
Transcriptome data are consistent with a defect in cell–cell junction formation in mutant livers (Table II). The gene encoding E-cadherin, Cadherin 1, was downregulated 1.8-fold in mutant livers. Furthermore, genes encoding proteins of desmosomes (Desmocollin 2 and Desmoglein 2), gap junctions (Gjb1/Connexin-32 and Gjb2/Connexin-26) and adherens junctions (Ceacam1) were also downregulated. Interestingly, Tjp1, the gene encoding ZO-1, was normally expressed at the mRNA level.
Table 2.
Genes involved in cell–cell adhesion that were significantly downregulated (P<0.05) in E18.75 mutant livers
| UniGene cluster | Gene symbol | Gene name | Alternate name | Type of junction | Fold change |
|---|---|---|---|---|---|
| 280547 | Dsc2 | Desmocollin 2 | Desmosome | −2.5 | |
| 21198 | Gjb1 | Gap junction membrane channel protein beta 1 | Connexin-32 | Gap junction | −2.0 |
| 34118 | Gjb2 | Gap junction membrane channel protein beta 2 | Connexin-26 | Gap junction | −1.9 |
| 360512 | Ceacam1 | CEA-related cell adhesion molecule 1 | Adherens junction | −1.8 | |
| 345891 | Dsg2 | Desmoglein 2 | Desmosome | −1.8 | |
| 35605 | Cdh1 | Cadherin 1 | E-cadherin | Adherens junction | −1.8 |
Taken together, these data show that SNF5 is essential for the assembly of all types of epithelial cell–cell junctions, namely tight junctions, adherens junctions, gap junctions and desmosomes. Moreover, this phenotype is underlied by a defective transcriptional activation of several genes encoding proteins that participate in these junctions.
SNF5 is required for the expression of a specific set of developmentally regulated and liver-specific genes
Our global transcriptome analysis showed that a considerable number of genes are dependent on SNF5 activity (ArrayExpress accession number: E-MEXP-241). We detected 9929 probe sets out of 36 000 present on the DNA chips (see Materials and methods). Of these, 412 (4.1%) were significantly decreased more than two-fold and 860 (8.7%) more than 1.5-fold in mutant livers (Supplementary Table I). The number of increased probe sets was smaller: only 71 (0.7%) were significantly increased more than two-fold and 259 (2.6%) more than 1.5-fold (Supplementary Table II). This broad effect could have been due to the lack or under-representation of hepatic cell types in mutant livers. However, histological examination (see Figures 2A and 4F) and lineage analysis (see Figure 1C) demonstrated that hepatic cells were indeed present. In addition, several specific markers of this lineage, including albumin 1 and alpha-fetoprotein, were normally expressed in mutant livers (data not shown).
To further assess the effect of SNF5 inactivation on hepatocyte differentiation, we analyzed the transcriptome more thoroughly. We compared wild-type E18.75 livers with transcriptome data obtained from wild-type 3T3 immortalized fibroblasts (Gerald and Mechta, ArrayExpress accession number: E-MEXP-239) and from wild-type E14.5 livers (Chéret and Pontoglio, ArrayExpress accession number: E-MEXP-240). Using these comparisons, we defined two groups of genes according to tissue-specific expression (‘liver-enriched genes' and ‘ubiquitous genes'), and two others according to temporal expression pattern (‘developmentally activated genes' and ‘not developmentally regulated genes') (see Materials and methods). We monitored the effect of SNF5 inactivation by calculating the number of genes downregulated (‘decreased genes'), upregulated (‘increased genes') and unchanged (‘not changed genes') upon SNF5 inactivation in these different groups of genes. Interestingly, the ‘decreased' probe sets represented a large proportion of the ‘liver-enriched genes' and the ‘developmentally activated genes' (Figure 5A and B). In contrast, no gene was ‘developmentally activated' and ‘increased' upon SNF5 inactivation (Figure 5B). We also found that, out of 235 genes that were both ‘liver-enriched' and ‘developmentally activated', 164 (70%) were downregulated and 71 (30%) were not affected by SNF5 inactivation (Figure 5C). These 71 probe sets included genes involved in different hepatic functions, indicating that SNF5 inactivation did not completely block hepatocyte differentiation (a partial list is given in Table III). As stated above, a major fraction of genes involved in energy metabolism were downregulated, while half of the serum proteins were normally expressed. Finally, the expression of the majority of cytochrome P450 genes was reduced.
Figure 5.
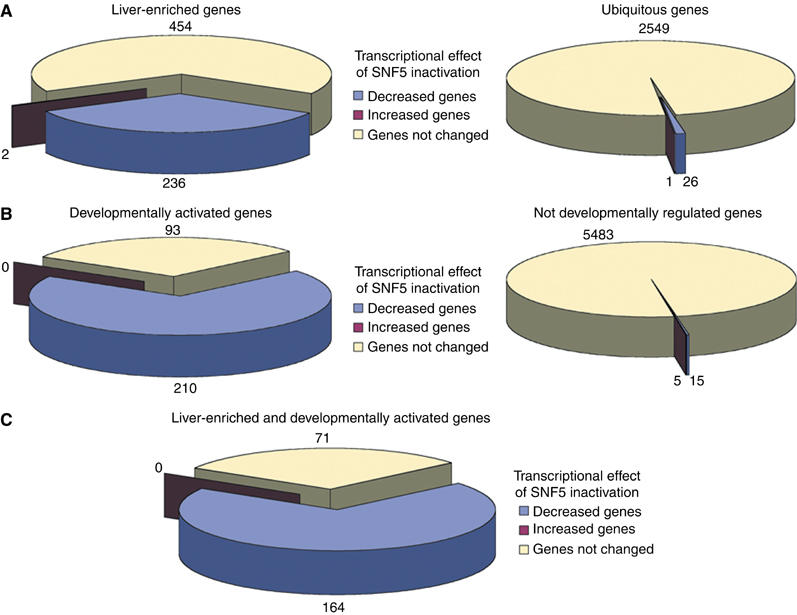
SNF5 is required for the establishment of the genetic program of differentiated hepatocytes. Transcriptional effect of SNF5 inactivation on different groups of genes: (A) ‘Liver-enriched genes' versus ‘ubiquitous genes'; (B) ‘developmentally activated genes' versus ‘not developmentally regulated genes'; (C) intersection of ‘liver-enriched genes' and ‘developmentally activated genes'. (A, B) An important proportion of ‘liver-enriched genes' (A) and ‘developmentally activated genes' (B) were downregulated upon SNF5 inactivation. (C) Almost 70% of the genes that are both ‘liver-enriched' and ‘developmentally activated' were downregulated in the absence of SNF5. In all, 30% of those genes did not require SNF5 activity for their activation.
Table 3.
Specific subsets of genes are dependent or independent on SNF5 activity to be correctly activated during terminal hepatocyte differentiation. Examples of liver-enriched and developmentally activated genes that were decreased (left) or not changed (right) upon SNF5 inactivation
| Liver-enriched and developmentally activated genes | |||
|---|---|---|---|
| Decreased genes upon SNF5 inactivation |
Genes not changed upon SNF5 inactivation |
||
| Gene symbol | Gene name | Gene symbol | Gene name |
| Energy metabolism | |||
| Acat1 | Acetyl-coenzyme A acetyltransferase 1 | Abcd2 | ATP-binding cassette, subfamily D (ALD), member 2 |
| Car5a | Carbonic anhydrase 5a, mitochondrial | Fabp1 | Fatty acid-binding protein 1, liver |
| Car8 | Carbonic anhydrase 8 | Gyk | Glycerol kinase |
| Fabp4 | Fatty acid-binding protein 4, adipocyte | Hao1 | Hydroxyacid oxidase 1, liver |
| Facl2 | Fatty acid coenzyme A ligase, long chain 2 | Itih4 | Inter-alpha-trypsin inhibitor, heavy chain 4 |
| Fbp1 | Fructose bisphosphatase 1 | Lcat | Lecithin cholesterol acyltransferase |
| G6pc | Glucose-6-phosphatase, catalytic | ||
| G6pt1 | Glucose-6-phosphatase, transport protein 1 | ||
| Pck1 | Phosphoenolpyruvate carboxykinase 1, cytosolic | ||
| Pcx | Pyruvate carboxylase | ||
| Pfkfb1 | 6-Phosphofructo-2-kinase/fructose-2,6-biphosphatase 1 | ||
| Ppp1r3c | Protein phosphatase 1, regulatory (inhibitor) subunit 3C | ||
| Serum proteins | |||
| A2m | Alpha-2-macroglobulin | Afp | Alpha fetoprotein |
| Apoa5 | Apolipoprotein A-V | C4bp | Complement component 4-binding protein |
| Apoc4 | Apolipoprotein C-IV | Cfh | Complement component factor h |
| C4 | Complement component 4 (within H-2S) | Cfhl1 | Complement component factor h-like 1 |
| Crp | C-reactive protein, petaxin related | Cfi | Complement component factor i |
| F10 | Coagulation factor X | Cpb2 | Carboxypeptidase B2 (plasma) |
| F11 | Coagulation factor XI | F13b | Coagulation factor XIII, beta subunit |
| Hp | Haptoglobin | Ttr | Transthyretin |
| Igfbp2 | Insulin-like growth factor-binding protein 2 | ||
| Mup1 | Major urinary protein 1 | ||
| Antimicrobial peptides | |||
| Defb1 | Defensin beta 1 | Camp | Cathelicidin antimicrobial peptide |
| Lbp | Lipopolysaccharide-binding protein | ||
| Pglyrp | Peptidoglycan recognition protein | ||
| Calcium regulation | |||
| S100a1 | S100 calcium-binding protein A1 | Rgn | Regucalcin |
| S100a8 | S100 calcium-binding protein A8 (calgranulin A) | ||
| S100a9 | S100 calcium-binding protein A9 (calgranulin B) | ||
| Cell–cell interactions | |||
| Cldn1 | Claudin 1 | ||
| Cytochrome P450 | |||
| Cyp2c37 | Cytochrome P450, family 2. subfamily c, polypeptide 37 | Cyp2f2 | Cytochrome P450, family 2, subfamily f, polypeptide 2 |
| Cyp2c38 | Cytochrome P450, family 2. subfamily c, polypeptide 38 | Cyp3a11 | Cytochrome P450, family 3, subfamily a, polypeptide 11 |
| Cyp2c70 | Cytochrome P450, family 2, subfamily c, polypeptide 70 | Cyp3a16 | Cytochrome P450, family 3, subfamily a, polypeptide 16 |
| Cyp2d9 | Cytochrome P450, family 2, subfamily d, polypeptide 9 | ||
| Cyp2d10 | Cytochrome P450, family 2, subfamily d, polypeptide 10 | ||
| Cyp2d26 | Cytochrome P450, family 2, subfamily d, polypeptide 26 | ||
| Cyp2e1 | Cytochrome P450, family 2, subfamily e, polypeptide 1 | ||
| Cyp3a13 | Cytochrome P450, family 3, subfamily a, polypeptide 13 | ||
| Cyp3a25 | Cytochrome P450, family 3, subfamily a, polypeptide 25 | ||
| Cyp4a10 | Cytochrome P450, family 4, subfamily a, polypeptide 10 | ||
| Cyp4a14 | Cytochrome P450, family 4, subfamily a, polypeptide 14 | ||
| Cyp4f15 | Cytochrome P450, family 4, subfamily f, polypeptide 15 | ||
| Cyp8b1 | Cytochrome P450, family 8, subfamily b, polypeptide 1 | ||
| Cyp39a1 | Cytochrome P450, family 39, subfamily a, polypeptide 1 | ||
We next verified the expression levels of liver-enriched transcription factors in mutant livers (Supplementary Table III). Interestingly, none of the transcription factors required for hepatocyte differentiation was affected by SNF5 inactivation. On the contrary, some transcription factors involved in the induction of metabolic changes in response to environmental changes were downregulated. However, inactivation of these transcriptions factors does not compromise liver development. These data suggest that the broad transcriptional effect of SNF5 inactivation is not the consequence of the lack of expression of tissue-specific transcription factors.
The ‘ubiquitous' and ‘developmentally not regulated' groups were mainly composed of ‘not changed' genes (Figure 5A and B). However, this effect may be overestimated as, by definition, the ‘ubiquitous' and ‘not developmentally regulated' groups probably contain several genes that are also highly expressed in the hematopoietic cells that represent an important fraction of the total liver and that do not undergo Cre-driven recombination.
To test whether SNF5 inactivation affected hematopoietic genes by an indirect effect, we screened the group of ‘liver-enriched genes' and found 40 genes with known hematopoietic expression or homologous to hematopoietic genes. This was not surprising since the reference RNA for the definition of ‘liver-enriched genes' was fibroblast RNA. From these genes, 39 were not affected by SNF5 inactivation, including genes of erythroid cells (Ankyrin 1, protein band 4.1 and 4.2, hemoglobin a1), lymphocytes (Rag1, lymphotoxin B), megacaryocytes (Fli1) and macrophages (lysozyme) (Supplementary Table IV).
Taken together, these results show that during hepatocyte differentiation SNF5 acts positively on the expression of roughly two thirds of liver-specific and developmentally activated genes. However, another subset of such genes is independent from SNF5 activity.
SNF5 inactivation leads to increased cell proliferation and misexpression of cell cycle-related genes
Hepatocyte differentiation at the end of gestation is accompanied by a strong decrease in cell proliferation (Gruppuso et al, 1997). Using S (PCNA) and M (phosphorylated serine 10 histone H3; Mateescu et al, 2004) phase markers, we found that proliferation was significantly (P<10−3) higher in mutant livers when compared to controls (Table IV). The rise in proliferation was of 1.6-fold at E17.5 and 4–5-fold at E18.5. A consistent, significant (P<10−3) 40% increase in parenchymal cell number was also observed. We confirmed this result by specifically analyzing the lineage of Cre-recombined cells in control and mutant mice carrying an ROSA26R allele (see Figure 1C).
Table 4.
Proportion of PCNA and mitotic phosphorylated serine 10 histone H3 (H3pS10)-positive parenchymal cells in control and mutant livers
| PCNA |
H3pS10 | ||
|---|---|---|---|
| Genotype | E17.5 (%) | E18.5 | E18.5 |
| Control | 11.1±1.2 | 2.4±0.4 | 1.8±0.3 |
| Mutant | 17.9±0.9 | 11.9±0.7 | 7.1±0.5 |
The transcriptome analysis of SNF5−/− livers at E18.75 showed that several genes involved in cell cycle control were deregulated (Table V). The strongest affected gene was p21Cip1 (Cdkn1a), with a −3.7-fold change. Western blot analysis confirmed this downregulation (data not shown). p21Cip1 is an essential regulator of cell cycle progression at G1, as it inhibits the activity of cyclin–CDK2 and 4 complexes (el-Deiry et al, 1993; Harper et al, 1993). Other modifications in gene expression might also contribute to the bypass of G1 control. S-phase kinase-associated protein 2 (Skp2 or p45), involved in p27Kip1 degradation, was upregulated in mutant livers (Carrano et al, 1999). p27Kip1 is another member of the Cip/Kip family of cyclin-dependent kinase inhibitors (Toyoshima and Hunter, 1994). In addition, two positive regulators of G1/S transition, cyclin E1 (Ccne1) and B-Myb (Mybl2), were upregulated.
Table 5.
SNF5 inactivation leads to misexpression of key regulators of cell cycle and survival
| UniGene cluster | Gene symbol | Gene name | Alternate name | Function | Fold change |
|---|---|---|---|---|---|
| 195663 | Cdkn1a | Cyclin-dependent kinase inhibitor 1A | p21/Cip1 | G1/S checkpoint | −3.7 |
| 16110 | Ccne1 | Cyclin E1 | G1/S checkpoint | +2.8 | |
| 35584 | Skp2 | S-phase kinase-associated protein 2 | p45 | G1/S checkpoint | +2.4 |
| 4594 | Mybl2 | Myeloblastosis oncogene-like 2 | B-Myb | G1/S checkpoint | +1.7 |
| 20912 | Cdc6 | Cell division cycle 6 homolog | Prereplicative complex | +1.6 | |
| 4502 | Mcmd | Mini chromosome maintenance deficient | Prereplicative complex | +1.5 | |
| 2903 | Prim1 | DNA primase, p49 subunit | DNA synthesis | +1.9 | |
| 1923 | Pola1 | Polymerase (DNA directed), alpha 1 | DNA synthesis | +1.5 | |
| 4352 | Col18a1 | Procollagen, type XVIII, alpha 1 | Endostatin | Antiproliferative | −2.5 |
| 290207 | Ets2 | E26 avian leukemia oncogene 2, 3' domain | Antiproliferative | −2.4 | |
| 272183 | Btg1 | B-cell translocation gene 1, antiproliferative | Antiproliferative | −2.1 | |
| 1626 | Tnfrsf6 | Tumor necrosis factor receptor superfamily, member 6 | Fas | Proapoptotic | −2.6 |
| 21109 | Gsn | Gelsolin | Proapoptotic | −2.5 | |
| 141083 | Bcl2l11 | BCL2-like 11 (apoptosis facilitator) | Bim | Proapoptotic | −2.2 |
| 2159 | Bnip3 | BCL2/adenovirus E1B 19 kDa-interacting protein 1, NIP3 | Proapoptotic | −2.0 | |
| 84073 | Bag3 | Bcl2-associated athanogene 3 | Antiapoptotic | −2.0 | |
| 10737 | Cideb | Cell death-inducing DNA fragmentation factor, alpha subunit-like effector B | Proapoptotic | −1.6 | |
| 24103 | Dapk1 | Death-associated protein kinase 1 | Proapoptotic | −1.5 |
Other genes involved in S, G2 or M phases of the cell cycle were also upregulated in mutant livers. Assembly of prereplicative complexes at origins is the first step in DNA replication and consists of the sequential binding of the origin recognition complex (ORC), cell division cycle 6 homolog (Cdc6) and the mini-chromosome maintenance protein complex (MCM) (see Takisawa et al, 2000). Two of the genes encoding these factors were upregulated in mutant livers: Cdc6 and mini-chromosome maintenance deficient (Mcmd). After assembly of prereplicative complexes, replication proceeds via the action of several enzymes. Two of these showed increased expression in mutants: Prim1 (DNA primase, p49 subunit) and Pola1 (DNA polymerase alpha 1, 180 kDa subunit) (Table V). In addition, several antiproliferative genes, such as Col18a1 (the gene encoding endostatin, an inhibitor of cell proliferation and tumor growth; O'Reilly et al, 1994), Ets2 and Btg1, were downregulated more than two-fold in mutant livers (Table V).
Finally, several genes involved in apoptosis were also downregulated in mutant livers (Table V). Interestingly, most of them were proapoptotic genes, as for example Fas/Tnfrsf6 and Bim/Bcl2l11 (see O'Connor et al, 1998; Nagata, 1999).
Taken together, our data show that SNF5 deletion leads to increased cell proliferation. This defect could be due to a partial inactivation of the G1/S checkpoint.
Discussion
We show here that liver-specific inactivation of the SWI/SNF complex core subunit SNF5 leads to perinatal lethality associated with impaired glucose metabolism. Transcriptome analysis of SNF5-deleted livers revealed that the SWI/SNF complex is necessary for correct expression of a large number of genes during liver development. We demonstrate that hepatocyte differentiation is affected in mutants, as a subset of liver-specific genes is not correctly activated during liver development. In addition, we show that SNF5−/− hepatocytes proliferate at higher rates than control cells.
Inactivation of SNF5 resulted in altered expression of 5–10% of expressed genes. Such a broad effect of the SWI/SNF complex has previously been observed in yeast, where it controls the expression of 6% of the genes (Holstege et al, 1998; Sudarsanam et al, 2000). This result illustrates the importance of chromatin remodeling in the regulation of gene expression.
The SWI/SNF complex and cell differentiation
We used a global approach to understand the role of SNF5 during liver development. Using transcriptome comparisons, we identified two partially overlapping groups of genes: liver-enriched genes and genes activated during liver development (E14.5–E18.5 transition). We show that SNF5 inactivation had a strong effect on these genes. In particular, up to 70% of the developmentally activated genes were dependent on SNF5 activity for their transcriptional activation. This global analysis demonstrates that SNF5 is required for the activation of the genetic program in differentiated hepatocytes.
However, the absence of SNF5 did not completely block hepatocyte differentiation; 30% of the liver-specific and developmentally activated genes were expressed at normal levels in mutant livers. The persistence of normal transcription rates for these genes may be due to residual SWI/SNF activity in the inactivated cells. A recent study suggests that SNF5 inactivation is not sufficient to disrupt all Brm- and Brg1-related activities (Doan et al, 2004). Moreover, our preliminary studies showed that liver-specific inactivation of Brg1 presents a stronger phenotype than SNF5 mutation. At birth, only one Brg1 mutant was recovered alive out of the expected 10.75 (P<0.05). Three dead mutants were also observed. Liver-specific inactivation of Brg1 in a Brm−/− background resulted in a more drastic effect. At birth, no mice lacking both genes in the liver were found either alive or dead (expected: 6, P<0.05). These results demonstrate that Brm and Brg1 still function partially in SNF5−/− cells. This may explain the normal expression rates of some developmentally activated genes in SNF5-deleted livers. Alternatively, non affected genes may depend on other chromatin-remodeling activities or on histone modifications for expression.
Taken together, our results support an in vivo requirement of SWI/SNF-dependent chromatin remodeling in the establishment of the genetic program of differentiated cells and clearly link chromatin remodeling and development.
Targeting of the SWI/SNF complex to specific promoters
SWI/SNF complex has no intrinsic DNA-binding specificity. How is targeting of the complex to a specific promoter achieved? Accumulating evidence suggests that transcription factors can recruit the SWI/SNF complex to specific genes (see Hassan et al, 2001; Hsiao et al, 2003; Debril et al, 2004). In this way, transcription factor-dependent activation would require SWI/SNF chromatin-remodeling properties. To test this hypothesis, we compared SNF5 target genes with genes downregulated upon inactivation of two well-characterized, liver-enriched transcription factors: HNF1α (see Pontoglio, 2000) and 4α (see Watt et al, 2003). Transcriptome data were obtained from E18.5 HNF1α−/− livers (Chéret and Pontoglio, unpublished results) and E18.5 liver-specific inactivation of HNF4α (Duncan, personal communication, 2004). We found that 17% of genes downregulated upon HNF1α inactivation were also decreased in SNF5−/− livers. This proportion was higher, 69%, for downregulated genes in HNF4α−/− livers. These results indicate that SNF5 activity is necessary for few HNF1α targets and for an important proportion of HNF4α targets. Moreover, liver-specific inactivation of HNF4α also results in hepatocyte differentiation defects and perinatal lethality (Parviz et al, 2003). Therefore, HNF4α may be one of the targeting factors of SWI/SNF in hepatocytes. Other candidates for this function include the transcription factor C/EBPα (CCAAT/enhancer-binding protein). This factor has been shown to interact with the SWI/SNF complex, at least in adipocytes and aging livers (Pedersen et al, 2001; Iakova et al, 2003). Furthermore, the phenotype of C/EBPα−/− mice resembles that of liver-specific inactivation of SNF5. Actually, C/EBPα−/− mice die just after birth from hypoglycemia and present reduced hepatic glycogen levels, defective gluconeogenesis, disruption of normal liver architecture and increased hepatocyte proliferation (Wang et al, 1995; Flodby et al, 1996).
The SWI/SNF complex, cell cycle control and tumor suppression
Numerous studies have connected the SWI/SNF complex with proliferation control (see Roberts and Orkin, 2004). In particular, SNF5 acts as a tumor suppressor gene in both humans and mice. The first genetic evidence of this link was the identification of biallelic inactivation of hSNF5/INI1 as the cause of most cases of malignant rhabdoid tumors (MRT), a highly aggressive pediatric cancer (Versteege et al, 1998; Sevenet et al, 1999). Similar tumors were also observed in SNF5+/− mice (Klochendler-Yeivin et al, 2000; Roberts et al, 2000; Guidi et al, 2001). Reintroduction of SNF5 in MRT-derived cell lines induces G1 arrest, and, in some cell lines, senescence or apoptosis (Ae et al, 2002; Betz et al, 2002; Versteege et al, 2002; Zhang et al, 2002; Reincke et al, 2003). Moreover, inducible inactivation of SNF5 in adult mice results in a very rapid tumor development compared to other tumor suppressor genes such as p53, p16Ink4a or p19Arf (Roberts et al, 2002).
Here we show that SNF5 inactivation leads to increased cell proliferation. Furthermore, transcriptome analysis revealed that several key regulators of the cell cycle were misexpressed upon SNF5 inactivation. Increased proliferation of SNF5−/− cells could be linked to the cellular differentiation defect. Indeed, cell differentiation is often associated with growth arrest and upregulation of cell cycle inhibitors, such as p21Cip1 (see Zhu and Skoultchi, 2001). In this case, gene expression modifications that we observed could be an indirect consequence of SNF5 inactivation. Alternatively, increased cell proliferation could be the direct result of SNF5-dependent transcriptional effects on regulators of cell cycle and apoptosis. Two recent studies showed that p21Cip1 is a direct transcriptional target of the SWI/SNF complex, at least in vitro (Hendricks et al, 2004; Kang et al, 2004). These results correlate with our observation that p21Cip1 expression is downregulated in SNF5−/− livers. Finally, we cannot rule out that the effect of SNF5 inactivation on cell proliferation results from both direct and indirect mechanisms.
In conclusion, we show here that the SWI/SNF complex is essential for establishment of the genetic program of differentiated cells. Moreover, we have identified several misexpressed genes that may contribute to SWI/SNF-driven cell cycle regulation. Whole-genome analysis of gene expression modifications upon SWI/SNF inactivation in mammalian non malignant cells provides an important tool to understand the role of chromatin-remodeling complexes in cell differentiation and proliferation.
Materials and methods
Generation of mice with a lox-conditional allele of SNF5
A 20 kb murine SNF5 genomic clone spanning 4.5 kb of the 5′ untranslated region, exons 1 and 2 and intron 2 was isolated from a 129SVJ mouse l phage library (Klochendler-Yeivin et al, 2000). A conditional allele was generated by flanking the first two exons with loxP sites. A loxP site was inserted at an EcoRV site 1 kb upstream of exon 1 and a loxP–neo–loxP cassette was introduced into an SacI site 600 bp downstream of exon 2. A thymidine kinase gene was added downstream of the right recombination arm for negative selection. Following electroporation and selection of CK35 ES cells, recombination into the SNF5 locus was confirmed by Southern blot hybridization to external probes. Subsequently, the neo cassette was deleted from the correctly targeted cells by transient transfection with pIC-Cre. DNA from G418-sensitive clones was analyzed by PCR using primers flanking the loxP–neo–loxP cassette (415F-CTTGCCAGGTGAGTCTG; 416R-GCCACCAGCCAGATGTCATAC). The correctly targeted ES cells were injected into C57BL/6 blastocysts and chimeras that showed germ-line transmission of the targeted allele were selected. The mice were genotyped by PCR using the primers described above. The deleted allele was detected using primers flanking the first loxP site (407F-GTTGTTAGTCCCTTTGCTCC; 408R-TGTAGTCTAGGCTGGGTGTG) and 416R.
Mice
AlfpCre (Kellendonk et al, 2000) and SNF5+/− (Klochendler-Yeivin et al, 2000) mice were previously described. All animals received humane care and the institutional review committee approved the study protocol.
Biochemical analysis, histological analysis and X-gal staining
Glucose levels were measured using a Glucotrend analyzer (Roche). Glycogen levels were determined as described (Roe and Dailey, 1966). For hepatic glucose production measurements, see Supplementary data. For histological analysis, organs were fixed in paraformaldehyde (PFA) 4% and embedded in paraffin. Sections were stained with hematoxylin and eosin or PAS. X-gal stainings were performed as described (Pontoglio et al, 1996).
Microarray analysis
Total RNAs were obtained from E18.75 frozen livers (ncontrol=4, nmutant=8) using TRIzol® procedure (Invitrogen). RNA preps were purified with Rneasy columns (Quiagen) and pooled according to their genotype. Control and mutant pools were used to synthesize cRNA and hybridize it to Affymetrix Murine Genome U74v2 A, B and C GeneChip® arrays that contain about 36 000 probe sets. These steps have been carried out in the Affymetrix facility at the Institut Curie (Paris) according to manufacturer's procedures. All hybridizations were carried out in triplicates (ArrayExpress accession number: E-MEXP-241).
We defined pertinently detected probe sets as probe sets that were not declared ‘absent' more than once (out of the three hybridization replicates) by the Microarray Suite Software MAS 5.0 (Affymetrix). For these probe sets, expression level fold changes were obtained using the dChip 1.3 software (Li and Wong, 2001). Only significantly changed probe sets (paired t-test, P<0.05) were taken into account. For the definition of ‘ubiquitous' and ‘liver-enriched' genes, we only used U74v2 A and B chips. We compared wild-type E18.75 livers with transcriptome data obtained from 3T3 immortalized fibroblasts (Gerald and Mechta, ArrayExpress accession number: E-MEXP-239). Probe sets expressed at the same levels in both samples were included in the ‘ubiquitous genes' group. Probe sets preferentially expressed in the liver when compared to fibroblasts (with at least a five-fold increase) were included in the ‘liver-enriched genes' group. For temporal specificity, we compared wild-type E18.75 livers with wild-type E14.5 livers (Chéret and Pontoglio, ArrayExpress accession number: E-MEXP-240). Probe sets expressed at higher levels at E18.75 (at least five-fold increase) were included in the group of ‘developmentally activated genes'. Probe sets expressed at the same levels were termed ‘not developmentally regulated genes'. Only few probe sets were expressed at lower levels at E18.75 when compared to E14.5 (n=7); thus we did not analyze their behavior.
For several genes, dChip 1.3-fold change estimations were confirmed by quantitative RT–PCR (correlation coefficient=0.949) (Supplementary Figure 1).
Immunohistochemical procedures
For ZO-1 and E-cadherin immunodetection, livers were frozen in isopentane cooled in a liquid nitrogen bath, and sectioned at 7 μm in a cryostat. Sections were air-dried, fixed in PFA 4% for 5 min, and blocked for 30 min in Tris buffer saline (TBS)/normal goat serum 10%/BSA 1%/Triton X-100 0.3%. Thereafter, sections were incubated with primary antibody (ZO-1: Developmental Hybridoma Bank R26.4C, 1/200 dilution; E-cadherin: BD Transduction Laboratories 610181, 1/500) in TBS/normal goat serum 1%/BSA 0.1%/Triton X-100 0.3% overnight at 4°C. Sections were then incubated with secondary antibody (fluorescein linked, 1/200 dilution) for 1 h at room temperature (RT).
For PCNA and H3pS10 staining, paraffin sections were microwaved (two times for 5 min, 500 W) in 10 mM citric acid pH 6. Thereafter, sections were treated using for PCNA: UltraVision Mouse Tissue Detection System Anti-Mouse HRP/DAB (LabVison) and PCNA (Ab-1) Cat#NA03 antibody (Oncogene Research, 1/80 dilution); for H3pS10: H3pS10 antibody (gift of B Mateescu, 1/3000) overnight at 4°C and secondary antibody (anti-rabbit Texas red, 1/250) 1 h at RT. At least 1200 parenchymal cells per genotype and per marker were counted.
Quantitative RT–PCR
Total RNAs were obtained as described below. RNAs were DNase treated (DNase I Rnase-free, Roche) and reverse transcribed (oligo dT primer) according to the manufacturer's protocols (Superscript II, Invitrogen). Quantitative RT–PCR was carried out on an ABI PRISM® 7000 sequence detection system using SYBR® Green. Primers were designed using PrimerExpress 2.0® software (Applied Biosystems). For primer sequences see Supplementary Table V. All genes have been tested in E18.5 control (n=8) and mutant (n=8) mice.
Supplementary Material
Supplementary Table I
Supplementary Table II
Supplementary Table III
Supplementary Table IV
Supplementary method
Supplementary Figure 1
Supplementary Table V
Acknowledgments
We are grateful to M Tanguy, V Komnenovic and A Doyen for technical assistance and advice, to K Wanherdick and D Gentien for Affymetrix GeneChips hybridizations, to N Cayet and MC Prévost for electron microscopy studies, to P Chambon for the Brg1 floxed allele, to S Medjkane and O Delattre for helpful discussions, to B Mateescu for the H3pS10 antibody. We thank J Weitzman for critical reading of the manuscript. The monoclonal antibody R26.4C against ZO-1 developed by DA Goodenough was obtained from Developmental Studies Hybridoma Bank developed under the auspices of the NICHD and maintained by The University of Iowa, Department of Biological Sciences, Iowa City, IA 52242. LG was supported by a fellowship from the ‘Association pour la Recherche contre le Cancer', the French Ministry of Research and the Pierre et Marie Curie University. AR was supported by Boehringer Ingelheim Fonds and the ‘Fondation pour la Recherche Médicale'. The use of Affymetrix technology was supported by the ‘Subvention à l'achat de puces Affymetrix' program of the French Ministry of Research. This work was supported by ‘La Ligue contre le Cancer-Comité de Paris', the ‘Association pour la Recherche contre le Cancer', HFSP (grant RGP0310/2001-M302 ‘Functional and structural studies of SWI/SNF-related complexes'), AICR (research grants 00-221 and 03-109 to AK-Y) and ICRF (project grant to AK-Y).
References
- Ae K, Kobayashi N, Sakuma R, Ogata T, Kuroda H, Kawaguchi N, Shinomiya K, Kitamura Y (2002) Chromatin remodeling factor encoded by ini1 induces G1 arrest and apoptosis in ini1-deficient cells. Oncogene 21: 3112–3120 [DOI] [PubMed] [Google Scholar]
- Becker PB, Horz W (2002) ATP-dependent nucleosome remodeling. Annu Rev Biochem 71: 247–273 (Epub 2001 Nov 2009) [DOI] [PubMed] [Google Scholar]
- Betz BL, Strobeck MW, Reisman DN, Knudsen ES, Weissman BE (2002) Re-expression of hSNF5/INI1/BAF47 in pediatric tumor cells leads to G1 arrest associated with induction of p16ink4a and activation of RB. Oncogene 21: 5193–5203 [DOI] [PubMed] [Google Scholar]
- Brady MJ, Saltiel AR (2001) The role of protein phosphatase-1 in insulin action. Recent Prog Horm Res 56: 157–173 [DOI] [PubMed] [Google Scholar]
- Bultman S, Gebuhr T, Yee D, La Mantia C, Nicholson J, Gilliam A, Randazzo F, Metzger D, Chambon P, Crabtree G, Magnuson T (2000) A Brg1 null mutation in the mouse reveals functional differences among mammalian SWI/SNF complexes. Mol Cell 6: 1287–1295 [DOI] [PubMed] [Google Scholar]
- Carrano AC, Eytan E, Hershko A, Pagano M (1999) SKP2 is required for ubiquitin-mediated degradation of the CDK inhibitor p27. Nat Cell Biol 1: 193–199 [DOI] [PubMed] [Google Scholar]
- Chi TH, Wan M, Lee PP, Akashi K, Metzger D, Chambon P, Wilson CB, Crabtree GR (2003) Sequential roles of Brg, the ATPase subunit of BAF chromatin remodeling complexes, in thymocyte development. Immunity 19: 169–182 [DOI] [PubMed] [Google Scholar]
- Coffinier C, Gresh L, Fiette L, Tronche F, Schutz G, Babinet C, Pontoglio M, Yaniv M, Barra J (2002) Bile system morphogenesis defects and liver dysfunction upon targeted deletion of HNF1beta. Development 129: 1829–1838 [DOI] [PubMed] [Google Scholar]
- de la Serna IL, Carlson KA, Imbalzano AN (2001) Mammalian SWI/SNF complexes promote MyoD-mediated muscle differentiation. Nat Genet 27: 187–190 [DOI] [PubMed] [Google Scholar]
- Debril MB, Gelman L, Fayard E, Annicotte JS, Rocchi S, Auwerx J (2004) Transcription factors and nuclear receptors interact with the SWI/SNF complex through the BAF60c subunit. J Biol Chem 279: 16677–16686 (Epub 12003 Dec 16629) [DOI] [PubMed] [Google Scholar]
- Doan DN, Veal TM, Yan Z, Wang W, Jones SN, Imbalzano AN (2004) Loss of the INI1 tumor suppressor does not impair the expression of multiple BRG1-dependent genes or the assembly of SWI/SNF enzymes. Oncogene 23: 3462–3473 [DOI] [PubMed] [Google Scholar]
- el-Deiry WS, Tokino T, Velculescu VE, Levy DB, Parsons R, Trent JM, Lin D, Mercer WE, Kinzler KW, Vogelstein B (1993) WAF1, a potential mediator of p53 tumor suppression. Cell 75: 817–825 [DOI] [PubMed] [Google Scholar]
- Feracci H, Connolly TP, Margolis RN, Hubbard AL (1987) The establishment of hepatocyte cell surface polarity during fetal liver development. Dev Biol 123: 73–84 [DOI] [PubMed] [Google Scholar]
- Fischle W, Wang Y, Allis CD (2003) Histone and chromatin cross-talk. Curr Opin Cell Biol 15: 172–183 [DOI] [PubMed] [Google Scholar]
- Flodby P, Barlow C, Kylefjord H, Ahrlund-Richter L, Xanthopoulos KG (1996) Increased hepatic cell proliferation and lung abnormalities in mice deficient in CCAAT/enhancer binding protein alpha. J Biol Chem 271: 24753–24760 [DOI] [PubMed] [Google Scholar]
- Gebuhr TC, Kovalev GI, Bultman S, Godfrey V, Su L, Magnuson T (2003) The role of Brg1, a catalytic subunit of mammalian chromatin-remodeling complexes, in T cell development. J Exp Med 198: 1937–1949 [DOI] [PMC free article] [PubMed] [Google Scholar]
- Gruppuso PA, Awad M, Bienieki TC, Boylan JM, Fernando S, Faris RA (1997) Modulation of mitogen-independent hepatocyte proliferation during the perinatal period in the rat. In Vitro Cell Dev Biol Anim 33: 562–568 [DOI] [PubMed] [Google Scholar]
- Guidi CJ, Sands AT, Zambrowicz BP, Turner TK, Demers DA, Webster W, Smith TW, Imbalzano AN, Jones SN (2001) Disruption of Ini1 leads to peri-implantation lethality and tumorigenesis in mice. Mol Cell Biol 21: 3598–3603 [DOI] [PMC free article] [PubMed] [Google Scholar]
- Harper JW, Adami GR, Wei N, Keyomarsi K, Elledge SJ (1993) The p21 Cdk-interacting protein Cip1 is a potent inhibitor of G1 cyclin-dependent kinases. Cell 75: 805–816 [DOI] [PubMed] [Google Scholar]
- Hassan AH, Neely KE, Vignali M, Reese JC, Workman JL (2001) Promoter targeting of chromatin-modifying complexes. Front Biosci 6: D1054–D1064 [DOI] [PubMed] [Google Scholar]
- Hendricks KB, Shanahan F, Lees E (2004) Role for BRG1 in cell cycle control and tumor suppression. Mol Cell Biol 24: 362–376 [DOI] [PMC free article] [PubMed] [Google Scholar]
- Hers HG, Hue L (1983) Gluconeogenesis and related aspects of glycolysis. Annu Rev Biochem 52: 617–653 [DOI] [PubMed] [Google Scholar]
- Holstege FC, Jennings EG, Wyrick JJ, Lee TI, Hengartner CJ, Green MR, Golub TR, Lander ES, Young RA (1998) Dissecting the regulatory circuitry of a eukaryotic genome. Cell 95: 717–728 [DOI] [PubMed] [Google Scholar]
- Hsiao PW, Fryer CJ, Trotter KW, Wang W, Archer TK (2003) BAF60a mediates critical interactions between nuclear receptors and the BRG1 chromatin-remodeling complex for transactivation. Mol Cell Biol 23: 6210–6220 [DOI] [PMC free article] [PubMed] [Google Scholar]
- Iakova P, Awad SS, Timchenko NA (2003) Aging reduces proliferative capacities of liver by switching pathways of C/EBPalpha growth arrest. Cell 113: 495–506 [DOI] [PubMed] [Google Scholar]
- Johnson KR, Lewis JE, Li D, Wahl J, Soler AP, Knudsen KA, Wheelock MJ (1993) P- and E-cadherin are in separate complexes in cells expressing both cadherins. Exp Cell Res 207: 252–260 [DOI] [PubMed] [Google Scholar]
- Kang H, Cui K, Zhao K (2004) BRG1 controls the activity of the retinoblastoma protein via regulation of p21CIP1/WAF1/SDI. Mol Cell Biol 24: 1188–1199 [DOI] [PMC free article] [PubMed] [Google Scholar]
- Kellendonk C, Opherk C, Anlag K, Schutz G, Tronche F (2000) Hepatocyte-specific expression of Cre recombinase. Genesis 26: 151–153 [DOI] [PubMed] [Google Scholar]
- Khorasanizadeh S (2004) The nucleosome: from genomic organization to genomic regulation. Cell 116: 259–272 [DOI] [PubMed] [Google Scholar]
- Kim JK, Huh SO, Choi H, Lee KS, Shin D, Lee C, Nam JS, Kim H, Chung H, Lee HW, Park SD, Seong RH (2001) Srg3, a mouse homolog of yeast SWI3, is essential for early embryogenesis and involved in brain development. Mol Cell Biol 21: 7787–7795 [DOI] [PMC free article] [PubMed] [Google Scholar]
- Klochendler-Yeivin A, Fiette L, Barra J, Muchardt C, Babinet C, Yaniv M (2000) The murine SNF5/INI1 chromatin remodeling factor is essential for embryonic development and tumor suppression. EMBO Rep 1: 500–506 [DOI] [PMC free article] [PubMed] [Google Scholar]
- Li C, Wong WH (2001) Model-based analysis of oligonucleotide arrays: expression index computation and outlier detection. Proc Natl Acad Sci USA 98: 31–36 [DOI] [PMC free article] [PubMed] [Google Scholar]
- Martens JA, Winston F (2002) Evidence that Swi/Snf directly represses transcription in S. cerevisiae. Genes Dev 16: 2231–2236 [DOI] [PMC free article] [PubMed] [Google Scholar]
- Martens JA, Winston F (2003) Recent advances in understanding chromatin remodeling by Swi/Snf complexes. Curr Opin Genet Dev 13: 136–142 [DOI] [PubMed] [Google Scholar]
- Mateescu B, England P, Halgand F, Yaniv M, Muchardt C (2004) Tethering of HP1 proteins to chromatin is relieved by phosphoacetylation of histone H3. EMBO Rep 5: 490–496 [DOI] [PMC free article] [PubMed] [Google Scholar]
- Nagata S (1999) Fas ligand-induced apoptosis. Annu Rev Genet 33: 29–55 [DOI] [PubMed] [Google Scholar]
- O'Connor L, Strasser A, O'Reilly LA, Hausmann G, Adams JM, Cory S, Huang DC (1998) Bim: a novel member of the Bcl-2 family that promotes apoptosis. EMBO J 17: 384–395 [DOI] [PMC free article] [PubMed] [Google Scholar]
- O'Reilly MS, Holmgren L, Shing Y, Chen C, Rosenthal RA, Moses M, Lane WS, Cao Y, Sage EH, Folkman J (1994) Angiostatin: a novel angiogenesis inhibitor that mediates the suppression of metastases by a Lewis lung carcinoma. Cell 79: 315–328 [DOI] [PubMed] [Google Scholar]
- Parviz F, Matullo C, Garrison WD, Savatski L, Adamson JW, Ning G, Kaestner KH, Rossi JM, Zaret KS, Duncan SA (2003) Hepatocyte nuclear factor 4alpha controls the development of a hepatic epithelium and liver morphogenesis. Nat Genet 34: 292–296 [DOI] [PubMed] [Google Scholar]
- Paul J, Conkie D, Freshey RI (1969) Erythropoietic cell population changes during hepatic phase of erythropoiesis in the foetal mouse. Cell Tissue Kinet 2: 283–294 [Google Scholar]
- Pedersen TA, Kowenz-Leutz E, Leutz A, Nerlov C (2001) Cooperation between C/EBPalpha TBP/TFIIB and SWI/SNF recruiting domains is required for adipocyte differentiation. Genes Dev 15: 3208–3216 [DOI] [PMC free article] [PubMed] [Google Scholar]
- Phelan ML, Sif S, Narlikar GJ, Kingston RE (1999) Reconstitution of a core chromatin remodeling complex from SWI/SNF subunits. Mol Cell 3: 247–253 [DOI] [PubMed] [Google Scholar]
- Pontoglio M (2000) Hepatocyte nuclear factor 1, a transcription factor at the crossroads of glucose homeostasis. J Am Soc Nephrol 11: S140–S143 [PubMed] [Google Scholar]
- Pontoglio M, Barra J, Hadchouel M, Doyen A, Kress C, Bach JP, Babinet C, Yaniv M (1996) Hepatocyte nuclear factor 1 inactivation results in hepatic dysfunction, phenylketonuria, and renal Fanconi syndrome. Cell 84: 575–585 [DOI] [PubMed] [Google Scholar]
- Reincke BS, Rosson GB, Oswald BW, Wright CF (2003) INI1 expression induces cell cycle arrest and markers of senescence in malignant rhabdoid tumor cells. J Cell Physiol 194: 303–313 [DOI] [PubMed] [Google Scholar]
- Roberts CW, Galusha SA, McMenamin ME, Fletcher CD, Orkin SH (2000) Haploinsufficiency of Snf5 (integrase interactor 1) predisposes to malignant rhabdoid tumors in mice. Proc Natl Acad Sci USA 97: 13796–13800 [DOI] [PMC free article] [PubMed] [Google Scholar]
- Roberts CW, Leroux MM, Fleming MD, Orkin SH (2002) Highly penetrant, rapid tumorigenesis through conditional inversion of the tumor suppressor gene Snf5. Cancer Cell 2: 415–425 [DOI] [PubMed] [Google Scholar]
- Roberts CW, Orkin SH (2004) The SWI/SNF complex—chromatin and cancer. Nat Rev Cancer 4: 133–142 [DOI] [PubMed] [Google Scholar]
- Roe JH, Dailey RE (1966) Determination of glycogen with the anthrone reagent. Anal Biochem 15: 245–250 [DOI] [PubMed] [Google Scholar]
- Sevenet N, Sheridan E, Amram D, Schneider P, Handgretinger R, Delattre O (1999) Constitutional mutations of the hSNF5/INI1 gene predispose to a variety of cancers. Am J Hum Genet 65: 1342–1348 [DOI] [PMC free article] [PubMed] [Google Scholar]
- Sif S, Saurin AJ, Imbalzano AN, Kingston RE (2001) Purification and characterization of mSin3A-containing Brg1 and hBrm chromatin remodeling complexes. Genes Dev 15: 603–618 [DOI] [PMC free article] [PubMed] [Google Scholar]
- Soriano P (1999) Generalized lacZ expression with the ROSA26 Cre reporter strain. Nat Genet 21: 70–71 [DOI] [PubMed] [Google Scholar]
- Stevenson BR, Siliciano JD, Mooseker MS, Goodenough DA (1986) Identification of ZO-1: a high molecular weight polypeptide associated with the tight junction (Zonula occludens) in a variety of epithelia. J Cell Biol 103: 755–766 [DOI] [PMC free article] [PubMed] [Google Scholar]
- Sudarsanam P, Iyer VR, Brown PO, Winston F (2000) Whole-genome expression analysis of snf/swi mutants of Saccharomyces cerevisiae. Proc Natl Acad Sci USA 97: 3364–3369 [DOI] [PMC free article] [PubMed] [Google Scholar]
- Takisawa H, Mimura S, Kubota Y (2000) Eukaryotic DNA replication: from pre-replication complex to initiation complex. Curr Opin Cell Biol 12: 690–696 [DOI] [PubMed] [Google Scholar]
- Toyoshima H, Hunter T (1994) p27, a novel inhibitor of G1 cyclin-Cdk protein kinase activity, is related to p21. Cell 78: 67–74 [DOI] [PubMed] [Google Scholar]
- van Schaftingen E, Gerin I (2002) The glucose-6-phosphatase system. Biochem J 362: 513–532 [DOI] [PMC free article] [PubMed] [Google Scholar]
- Versteege I, Medjkane S, Rouillard D, Delattre O (2002) A key role of the hSNF5/INI1 tumour suppressor in the control of the G1–S transition of the cell cycle. Oncogene 21: 6403–6412 [DOI] [PubMed] [Google Scholar]
- Versteege I, Sevenet N, Lange J, Rousseau-Merck MF, Ambros P, Handgretinger R, Aurias A, Delattre O (1998) Truncating mutations of hSNF5/INI1 in aggressive paediatric cancer. Nature 394: 203–206 [DOI] [PubMed] [Google Scholar]
- Wang ND, Finegold MJ, Bradley A, Ou CN, Abdelsayed SV, Wilde MD, Taylor LR, Wilson DR, Darlington GJ (1995) Impaired energy homeostasis in C/EBP alpha knockout mice. Science 269: 1108–1112 [DOI] [PubMed] [Google Scholar]
- Watt AJ, Garrison WD, Duncan SA (2003) HNF4: a central regulator of hepatocyte differentiation and function. Hepatology 37: 1249–1253 [DOI] [PubMed] [Google Scholar]
- Zhang ZK, Davies KP, Allen J, Zhu L, Pestell RG, Zagzag D, Kalpana GV (2002) Cell cycle arrest and repression of cyclin D1 transcription by INI1/hSNF5. Mol Cell Biol 22: 5975–5988 [DOI] [PMC free article] [PubMed] [Google Scholar]
- Zhu L, Skoultchi AI (2001) Coordinating cell proliferation and differentiation. Curr Opin Genet Dev 11: 91–97 [DOI] [PubMed] [Google Scholar]
Associated Data
This section collects any data citations, data availability statements, or supplementary materials included in this article.
Supplementary Materials
Supplementary Table I
Supplementary Table II
Supplementary Table III
Supplementary Table IV
Supplementary method
Supplementary Figure 1
Supplementary Table V