

Abstract
During the early stages of embryogenesis, pluripotent neural crest cells (NCC) are known to migrate from the neural folds to populate multiple target sites in the embryo where they differentiate into various derivatives, including cartilage, bone, connective tissue, melanocytes, glia, and neurons of the peripheral nervous system. The ability to obtain pure NCC populations is essential to enable molecular analyses of neural crest induction, migration, and/or differentiation. Crossing Wnt1-Cre and Z/EG transgenic mouse lines resulted in offspring in which the Wnt1-Cre transgene activated permanent EGFP expression only in NCC. The present report demonstrates a flow cytometric method to sort and isolate populations of EGFP-labeled NCC. The identity of the sorted neural crest cells was confirmed by assaying expression of known marker genes by TaqMan Quantitative Real-Time Polymerase Chain Reaction (QRT-PCR). The molecular strategy described in this report provides a means to extract intact RNA from a pure population of NCC thus enabling analysis of gene expression in a defined population of embryonic precursor cells critical to development.
INTRODUCTION
Cranial neural crest cells (NCC) represent an important population of progenitor cells that arise from the neural folds of the posterior midbrain and hindbrain and migrate into the branchial arches where they differentiate into connective tissue and skeletal components of the neck and craniofacial region, melanocytes, and certain sensory ganglia of the nervous system. Several defects in embryonic craniofacial development have been attributed to abnormalities in NCC formation, proliferation, and/or migration [1, 2]. Induction, proliferation, and migration of NCC have been shown to be under the control of a number of signal transduction pathways [3, 4, 5, 6]. Experimental strategies that have been utilized to investigate NCC function include the use of chick-quail chimeras [3], cell labeling with vital dyes [7, 8], NCC-specific antibodies [9], and retroviral-mediated gene transfer [10]. While these approaches have been exceedingly useful in revealing much of what is known regarding NCC function at the cellular level, the inability to isolate pure populations of NCC for genomic or proteomic analysis has, until now, presented a significant barrier to a fuller appreciation of NCC function during craniofacial morphogenesis.
Using a novel two-component mouse model system, the NCC of the developing embryo have been permanently and genetically labeled with enhanced green fluorescent protein (EGFP) [11]. The method involves activation of green fluorescent protein transgene expression by Wnt1-promoter-directed Cre-recombinase. Wnt1 is a protooncogene encoding an intracellular signaling molecule that is temporally expressed in the developing midbrain [12, 13]. The cranial NCC arise from Wnt1-expessing cells in the central nervous system. Thus, the expression of Wnt1 is a useful marker for cranial NCC. Recent studies have reported the construction of Wnt1-Cre transgenes [14]. Others have reported Wnt1-activation of a reporter gene by Cre recombinase [15]. Novak et al [16] have reported tissue specific activation of the EGFP-transgene by the Cre/LoxP recombinase system. Taking advantage of these reports, we have crossed a Wnt1-Cre transgenic mouse strain with the Z/EG transgenic reporter line in which EGFP is only expressed in the presence of Cre-recombinase. This resulted in offspring in which the Wnt1-Cre transgene permanently and genetically activated EGFP expression only in the NCC. This enables precise delineation of NCC formation, migration, and subsequent cellular differentiation, as well as allowing extraction of RNA for gene expression studies [11].
The development of EGFP as an intracellular vital reporter has made feasible flow cytometric separation of labeled cells for analysis of gene expression [17]. Fluorescence-activated cell sorting (FACS) is a flow cytometric method commonly used to isolate discrete populations of cells from heterogeneous cell pools. The technique of cell sorting derives from the principle that fluid streams in air are unstable and decay into spherical droplets as a consequence of reduction in free energy. Application of a voltage to the fluid stream at this time imposes a corresponding charge on the surface of the newly formed droplet. In the present study, this charge was provided by EGFP expressed by the NCC. The charged droplet can thus be deflected and separated during its passage through a fixed high-voltage electrostatic field. As this process of fluid charging can be rapidly and reversibly switched, high rates of cell sorting can be readily achieved. In order to confirm that the flow sorting methodology employed did indeed isolate EGFP-labeled neural crest cells, expression of NCC marker genes Crabp1, Slug, Msx1, and Dlx5 by the sorted cells was analyzed by TaqMan quantitative real time PCR. [18, 19]. Additionally, glyceraldehyde-3-phosphate dehydrogenase (GAPDH) was utilized as an internal control [20], while expression of En1 (encoding the mouse homeodomain protein, engrailed-1) was examined as a negative control. En1 is expressed in the embryonic midbrain/hindbrain region, but not in NCC [21]. The present report elaborates a powerful tool to genetically and indelibly label and isolate multipotent cranial NCC. This approach ensures that the integrity of the genetic material, particularly RNA, remains high and enables precise genomic and proteomic analysis of the fate and function of the mammalian neural crest during the course of embryonic development.
MATERIALS AND METHODS
Breeding of Wnt-Cre X Z/EG transgenic mouse strains
Both the Wnt1-Cre transgenic mouse line (provided by Dr Andrew McMahon, Harvard University, Cambridge, Mass) and the Z/EG transgenic mouse line (Tg [ACTB-Bgeo/GFP] 21Lbe), (Jackson Laboratory, Bar Harbor, Me) have been described previously [14, 16]. The animals were maintained on a light-dark cycle with light from 0600 to 1800 hours. Mating Wnt1-Cre+/− with Z/EG+/− mice generated Wnt1-Cre/Z/EG double transgenic mice. Embryonic age was determined based on the time of detection of a vaginal plug, with noon of that day being considered as 0.5 dpc (days post coition). Genotypes of the double transgenic embryos were determined by PCR [14, 16] using genomic DNA isolated from individual embryonic yolk sacs.
Visualization of EGFP-labeled NCC
EGFP-labeled NCC were visualized in intact embryos using a Nikon SMZ 1500 stereomicroscope equipped with epifluorescence optics (470–490 nm [excitation] and 525–550 nm [emission]), and photographed using a Nikon DXM 1200 digital camera.
Fluorescence-activated cell sorting (FACS)
Embryos, 9.5 dpc, were dissected in ice-cold calcium-magnesium-free phosphate-buffered saline (CMF-PBS) (per liter: 0.2 g KCl, 0.2 g KH2PO4, 8.0 g NaCl, 2.16 g Na2HPO4.7H2O, pH 7.2) and heads removed above the second branchial arch. Following removal of the midbrain and hindbrain, the remaining tissue, comprising the frontonasal region and the first branchial arch, was incubated with 1.5 mL (0.5%) trypsin at 37°C for 10 minutes followed by pelleting and resuspension in tissue culture medium with 5% fetal bovine serum (FBS). Cell sorting was performed using a Mo-Flo DakoCytomation (Fort Collins, Colo) equipped with an Omnichrome series 43 air-cooled 488 nm argon laser at 100 mW of power. Forward scatter (FS) and side scatter (SSC) were collected through a filter. The EGFP signal was collected in the FL1 channel through a 530/40 bandpass filter. A light scatter gate was drawn in the SSC versus FS plot to exclude debris and include the viable ES cells. Cells in the gate were displayed in a single-parameter histogram for the EGFP and final gating settings determined to collect the labeled cells. Post-sorting, the cells were collected in tissue culture medium with 5% FBS and plated in 4 well-chambered slides (LabTek, Nalge Nunc International, Naperville, Ill) at a concentration of 50 000 cells/well. Cells were photographed at 115 times magnification on a Nikon Eclipse TE2000U inverted-phase contrast microscope with epifluorescence optics using a DXM 1200 digital camera.
Total RNA isolation and production of antisense RNA
Cells isolated by FACS (approximately 5000) were collected in microcentrifuge tubes and processed using the PicoPure RNA isolation kit (Arcturus, Mountain View, Calif) according to the manufacturer's protocol. Briefly, 11 μL volume of extraction buffer was placed into the microcentrifuge tube containing the sorted cells and incubated for 30 minutes at 42°C. After incubation, the cell lysate was loaded onto a spin column, washed, and total cellular RNA was eluted in a 10 μL volume of elution buffer. One μL of total RNA was used as template to produce antisense RNA (aRNA) using the RiboAmp kit (Arcturus) following manufacturer's instructions.
RNA amplification was achieved by two rounds of first-strand cDNA synthesis, second-strand cDNA synthesis, and in vitro transcription. The quality of resultant aRNA was assessed using an Agilent RNA chip and the Agilent 2100 Bioanalyzer (Agilent Technologies, Palo Alto, Calif).
Quantitative real-time PCR
cDNA was synthesized from amplified RNA (aRNA) with random hexamer primers and Superscript II reverse transcriptase (Invitrogen Life Technologies, Inc, Carlsbad, Calif). Quantitative real-time PCR analysis was performed on a TaqMan ABI Prism 7000 Sequence Detector System (Applied Biosystems, Foster City, Calif). Primers and their corresponding fluorescence probes for each of the genes were designed and synthesized by Applied Biosystem's “Assays-by-Design” custom service. In all cases, both forward and reverse primers were used at a concentration of 900 nM while the concentration of the probe was 250 nM. For the PCR reaction, 1 ng of cDNA template was incubated with 0.2 mM dATP, dCTP, and dGTP, 0.4 mM dUTP, and 0.625 units of AmpliTaq Gold (Applied Biosystems, UK) in a final volume of 25 μL. Cycling parameters were as follows: 50°C for 2 minutes for probe and primer activation, 95°C for 10 minutes of DNA strand denaturation, followed by 40 cycles of denaturation at 95°C for 15 seconds each, and finally, primer extension at 60°C for 1 minute. Each cDNA sample was tested in triplicate and mean Ct values are reported. Further, for each reaction, a “no template” sample was included as a negative control. Raw data were acquired and processed with ABI Sequence Detector System software, version 1.0 (Applied Biosystems, UK).
RESULTS AND DISCUSSION
Embryos resulting from the cross between the Wnt-Cre and Z/EG transgenic mouse lines were dissected at 9.5 dpc. A cranial neural-crest-specific pattern of green fluorescence was detected in the embryo (Figure 1). Fluorescence was observed in the branchial arches, frontonasal region, hindbrain, and also in the dorsal root ganglia between somite borders along the entire length of the embryo. Since the midbrain-hindbrain region also contains some Wnt-1 expressing non-neural crest EGFP positive cells, it was essential to remove this region prior to FACS. The remaining tissue, consisting of the frontonasal region and the first branchial arch, was trypsinized and resuspended in medium containing 5% FBS prior to fluorescence-activated cell sorting. Representative histograms of pre- (Figure 2a) and post- (Figure 2b) sorted cells indicate that approximately 30% of the total cells that were sorted were EGFP-positive (Figure 2b, see sector R12). Post-sorting propidium iodide staining of EGFP-labeled cells indicated cell viability to be 98% (results not shown), confirming that the mechanistic pressures exerted on cells during FACS had no effect on their viability. FACS-isolated cells were plated on chambered glass slides and allowed to grow for 24 hours at 37°C. Photomicrographs of FACS-isolated NCC in cell culture, under brightfield (Figure 3a) and epifluorescence (Figure 3b) optics, indicate that the cultures contain a viable, homogenous population of EGFP-labeled cells that are capable of attachment to the substratum and subsequent spreading. These data demonstrate the feasibility of flow-sorting and subsequent growth in culture of EGFP-labeled cranial neural crest cells.
Figure 1.


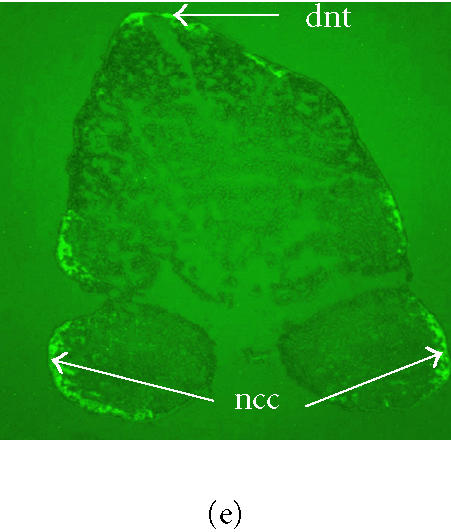
(Top) EGFP-labeled NCC in Wnt1-Cre/Z/EG transgenic mouse embryos. Photomicrograph of a 9.5-dpc, two-component Wnt1-Cre/Z/EG transgenic embryo (right) adjacent to a wildtype littermate (left) under darkfield optics (a) and epifluorescence optics (b). (c) A 9.5-dpc, two-component Wnt1-Cre/Z/EG transgenic embryo photographed under epifluorescence optics showing EGFP expression in the NCC of the first and second branchial arches (ba1 and ba2), and in the NCC in the forebrain (fb) and from frontonasal (fn) region as well as in Wnt1 expressing cells of the midbrain/hindbrain (mb and hb). EGFP-labeled NCC are also migrating from the CNS between the somites (s) to form the dorsal root ganglia (arrows) at all somitic levels. (Bottom) Transverse section through the region of the first and second branchial arches (ba1 and ba2) (X40) of a 9.5-dpc, two-component Wnt1-Cre/Z/EG transgenic embryo. Tissue sections were visualized under brightfield (d) and epifluorescence (e) optics. EGFP fluorescence is visible in peripheral neural crest cells (ncc) and in the dorsal neural tube (dnt).
Figure 2.


Flow cytometric analysis and isolation of EGFP-labeled cranial NCC. Cell suspensions were prepared from the tissue derived from the cranial region, rostral to the second branchial arch, of 9.5-dpc EGFP-labeled embryos. Cells were subjected to fluorescence-activated cell sorting as delineated in the “materials and methods.” Representative histogram (a) shows total population of gated cells. Representative post-sorting histogram (b) indicates EGFP-positive neural crest cells in sector R12. The EGFP-labeled cell population in R12 routinely constitutes approximately 30% of the total gated cells.
Figure 3.


FACS-isolated NCC in cell culture. EGFP-labeled cranial NCC were isolated by FACS and established in primary culture as detailed in the “materials and methods.” Photomicrographs of FACS-isolated, EGFP-labeled NCC (24 hour cultures) under brightfield (a) and epifluorescence (b) optics, indicate that the cultures contain a viable, homogenous population of EGFP-labeled cells. (Magnification 115X).
RNA was extracted from a corresponding sample of flow sorted EGFP-positive cranial neural crest cells using the PicoPure RNA isolation kit. Analysis of the RNA on an Agilent RNA chip demonstrated that the majority of RNA fragments were between 200 and 2000 nucleotides with the majority around 550 nt (Figure 4). At the end of two rounds of amplification, the total RNA yield, as measured spectrophotometrically, was 229 μg. The quality and yield of amplified RNA is sufficient for microarray analysis using a variety of commercial microarray platforms. To ensure that this flow sorting method indeed separated (EGFP) labeled neural crest cells, quantitative RT-PCR was performed to detect expression of specific marker genes of the neural crest. These included Crabp1, Slug, Dlx5, and Msx1 [18, 19]. In addition, engrailed 1 (En1) was included as a negative control and glyceraldehyde-3-phosphate dehydrogenase (GAPDH) was utilized as an internal control [20, 21]. Results shown in Table 1 are expressed as Ct values representing the number of cycles during the exponential phase of amplification necessary to reach a predetermined threshold level of PCR product as measured by fluorescence. The Ct values are directly proportional to the amount of input template, such that a higher Ct value would indicate a lower copy number of the gene of interest. The four NCC marker genes demonstrated significant amplification when compared with control reactions lacking reverse transcriptase. The En1 gene was not amplified under the same reaction conditions, affirming the specificity of FACS-captured cranial NCC from the 9.5 dpc embryos.
Figure 4.


Fragment size profile of amplified RNA that was extracted from FACS-isolated EGFP-labeled cranial NCC as determined by electrophoretic separation on an Agilent RNA Biochip. Antisense RNA abundance (fluorescence) is graphed as a function of RNA fragment size (time of electrophoretic migration, in seconds). The graph (a) represents the fragment size profile from amplified, antisense RNA from FACS-isolated EGFP-labeled NCC while the graph (b) represents the fragment size profile of RNA size markers used as a standard. RNA fragment size (in nucleotides) is denoted adjacent to peaks on the profiles. The mRNA profile from the FACS-isolated NCC demonstrates a significant population of fragments in the 200–2000 nucleotide size range.
Table 1.
Expression of NCC marker genes by FACS-isolated, EGFP-labeled NCC.1
| Gene | Ct value2,3 |
| Msx1 | 28.60 |
| Crabp1 | 18.12 |
| Slug | 23.75 |
| Dlx5 | 28.15 |
| GAPDH4 | 17.69 |
| En15 | No amplification |
1Expression of NCC gene markers was determined using TaqMan quantitative real-time PCR (QRT-PCR) as detailed in “materials and methods.”
2NCC cDNA samples were prepared and subjected to QRT-PCR for each target gene in triplicate; mean Ct values are reported.
3Negative methodological control reactions, which lacked reverse transcriptase, did not amplify any detectable product.
4GAPDH was utilized as an internal control to normalize gene expression.
5En1, a negative control gene that is known not to be expressed by NCC.
Data in the present report document the feasibility of utilizing fluorescence-activated cell sorting to isolate viable EGFP-labeled neural crest cells from a heterogeneous pool of trypsinized cells derived from murine embryonic tissue. The present strategy affords the ability to obtain homogenous populations of murine neural crest in such a manner as to retain the integrity of proteins, DNA, and RNA for subsequent biochemical and molecular analysis. Accordingly, both lineage analysis and molecular/genetic analyses of the murine embryonic neural crest cells and their various derivatives, by techniques such as QRT-PCR, gene microarrays, and proteomics become viable avenues of pursuit to further our understanding of these pluripotent progenitor cells during embryonic development.
ACKNOWLEDGMENT
We thank A. P. McMahon (Department of Molecular and Cellular Biology, Harvard University, Cambridge, Mass) for provision of the Wnt1-Cre mice. This work was supported in part by NIH Grants DE05550 and DE12858 to Robert M. Greene, NIH Grants DE12363 and ESO11775 to M. Michele Pisano, the Kentucky Science and Engineering Foundation, the Commonwealth of Kentucky Research Challenge Trust Fund, and NIH Grant P20RR017702 from the COBRE Program of the National Center for Research Resources.
References
- 1.Takahashi K, Nuckolls G.H, Takahashi I, et al. Msx2 is a repressor of chondrogenic differentiation in migratory cranial neural crest cells. Dev Dyn. 2001;222(2):252–262. doi: 10.1002/dvdy.1185. [DOI] [PubMed] [Google Scholar]
- 2.Tallquist M.D, Soriano P. Cell autonomous requirement for PDGFRα in populations of cranial and cardiac neural crest cells. Development. 2003;130(3):507–518. doi: 10.1242/dev.00241. [DOI] [PubMed] [Google Scholar]
- 3.Noden D.M. The role of the neural crest in patterning of avian cranial skeletal, connective, and muscle tissues. Dev Biol. 1983;96(1):144–165. doi: 10.1016/0012-1606(83)90318-4. [DOI] [PubMed] [Google Scholar]
- 4.Graham A, Lumsden A. The role of segmentation in the development of the branchial region of higher vertebrate embryo. In: Opitz J.M, editor. Biogenesis, Normal and Abnormal. New York, NY: Wiley-Liss Publishers; 1993. pp. 99–108. [Google Scholar]
- 5.Echelard Y, Vassileva G, McMahon A.P. Cis-acting regulatory sequences governing Wnt-1 expression in the developing mouse CNS. Development. 1994;120(8):2213–2224. doi: 10.1242/dev.120.8.2213. [DOI] [PubMed] [Google Scholar]
- 6.Imai H, Osumi-Yamashita N, Ninomiya Y, Eto K. Contribution of early-emigrating midbrain crest cells to the dental mesenchyme of mandibular molar teeth in rat embryos. Dev Biol. 1996;176(2):151–165. doi: 10.1006/dbio.1996.9985. [DOI] [PubMed] [Google Scholar]
- 7.Serbedzija G.N, Bronner-Fraser M, Fraser S.E. A vital dye analysis of the timing and pathways of avian trunk neural crest cell migration. Development. 1989;106(8):254–263. doi: 10.1242/dev.106.4.809. [DOI] [PubMed] [Google Scholar]
- 8.Serbedzija G.N, Bronner-Fraser M, Fraser S.E. Vital dye analysis of cranial neural crest cell migration in the mouse embryo. Development. 1992;116(2):297–307. doi: 10.1242/dev.116.2.297. [DOI] [PubMed] [Google Scholar]
- 9.Tucker G.C, Aoyama H, Lipinski M, Tursz T, Thiery J.P. Identical reactivity of monoclonal antibodies HNK-1 and NC-1: conservation in vertebrates on cells derived from the neural primordium and on some leukocytes. Cell Differ. 1984;14(3):223–230. doi: 10.1016/0045-6039(84)90049-6. [DOI] [PubMed] [Google Scholar]
- 10.Polmann R.E, Gittenberger-de Groot A.C. A subpopulation of apoptotic-prone cardiac neural crest cells targets to the venous pole: multiple functions in heart development? Dev Biol. 1999;207(11):271–286. doi: 10.1006/dbio.1998.9166. [DOI] [PubMed] [Google Scholar]
- 11.Bhattacherjee V, Mukhopadhyay P, Singh S, et al. Laser capture microdissection of fluorescently labeled embryonic cranial neural crest cells. Genesis. 2004;39(1):58–64. doi: 10.1002/gene.20026. [DOI] [PubMed] [Google Scholar]
- 12.Wilkinson D.G, Bailes J.A, McMahon A.P. Expression of the proto-oncogene Wnt-1 is restricted to specific neural cells in the developing mouse embryo. Cell. 1987;50(1):79–88. doi: 10.1016/0092-8674(87)90664-7. [DOI] [PubMed] [Google Scholar]
- 13.McMahon A.P, Joyner A.L, Bradley A, McMahon J.A. The midbrain-hindbrain phenotype of Wnt-1−/Wnt-1− mice results from stepwise deletion of engrailed-expressing cells by 9.5 days postcoitum. Cell. 1992;69(4):581–95. doi: 10.1016/0092-8674(92)90222-x. [DOI] [PubMed] [Google Scholar]
- 14.Danielian P.S, Muccino D, Rowitch D.H, Michael S.K, McMahon A.P. Modification of gene activity in mouse embryos in utero by a tamoxifen-inducible form of Cre recombinase. Curr Biol. 1998;8(24):1323–1326. doi: 10.1016/s0960-9822(07)00562-3. [DOI] [PubMed] [Google Scholar]
- 15.Chai Y, Jiang X, Ito Y, et al. Fate of the mammalian cranial neural crest during tooth and mandibular morphogenesis. Development. 2000;127(8):1671–1679. doi: 10.1242/dev.127.8.1671. [DOI] [PubMed] [Google Scholar]
- 16.Novak A, Guo C, Yang W, Nagy A, Lobe C.G. Z/EG, a double reporter mouse line that expresses enhanced green fluorescent protein upon Cre-mediated excision. Genesis. 2000;28(3-4):147–155. [PubMed] [Google Scholar]
- 17.Galbraith D.W, Anderson M.T, Herzenberg L.A. Flow cytometric analysis and FACS sorting of cells based on GFP accumulation. Methods Cell Biol. 1999;58:315–341. doi: 10.1016/s0091-679x(08)61963-9. [DOI] [PubMed] [Google Scholar]
- 18.Nieto M.A, Sargent M.G, Wilkinson D.G, Cooke J. Control of cell behavior during vertebrate development by Slug, a zinc finger gene. Science. 1994;264(5160):835–839. doi: 10.1126/science.7513443. [DOI] [PubMed] [Google Scholar]
- 19.Trokovic N, Trokovic R, Mai P, Partanen J. Fgfr1 regulates patterning of the pharyngeal region. Genes Dev. 2003;17(1):141–153. doi: 10.1101/gad.250703. [DOI] [PMC free article] [PubMed] [Google Scholar]
- 20.Pisano M.M, Mukhopadhyay P, Greene R.M. Molecular fingerprinting of TGF-β treated embryonic maxillary mesenchymal cells. Orthod Craniofacial Res. 2003;6:1–16. doi: 10.1034/j.1600-0544.2003.00264.x. [DOI] [PubMed] [Google Scholar]
- 21.Joyner A.L, Martin G.R. En-1 and En-2, two mouse genes with sequence homology to the drosophila engrailed gene: expression during embryogenesis. Genes Dev. 1987;1(1):29–38. doi: 10.1101/gad.1.1.29. [DOI] [PubMed] [Google Scholar]