Abstract
Objectives
Describe the inflation in nonparametric multipoint LOD scores due to inter-marker linkage disequilibrium (LD) across many markers with varied allele frequencies.
Method
Using simulated two-generation families with and without parents, we conducted non-parametric multipoint linkage analysis with 2 to 10 markers with minor allele frequencies (MAF) of 0.5 and 0.1.
Results
Misspecification of population haplotype frequencies by assuming linkage equilibrium caused inflated multipoint LOD scores due to inter-marker LD when parental genotypes were not included. Inflation increased as more markers in LD were included and decreased as markers in equilibrium were added. When marker allele frequencies were unequal, the r2 measure of LD was a better predictor of inflation than D′.
Conclusion
This observation strongly supports the evaluation of LD in multipoint linkage analyses, and further suggests that unaccounted for LD may be suspected when two-point and multipoint linkage analyses show a marked disparity in regions with elevated r2 measures of LD. Given the increasing popularity of high-density genome-wide SNP screens, inter-marker LD should be a concern in future linkage studies.
Keywords: Linkage disequilibrium, Measures of linkage disequilibrium, Linkage analysis, False positive rate, Parameter misspecification
Introduction
High-density SNP mapping for analysis of a candidate region has become a common and powerful approach for localizing disease genes [1]. Dense maps of SNPs are more likely to contain markers with strong linkage disequilibrium (LD) than sparse microsatellite maps. Knowledge of these patterns of LD in a candidate gene region is necessary, and may require new methods of linkage analysis [2]. Most current linkage analysis programs require the simplifying assumptions of Hardy-Weinberg equilibrium at all loci and linkage equilibrium between alleles at different loci.
Haplotype frequencies can be incorrectly inferred when inter-marker LD is unaccounted for leading to inflated multipoint LOD scores when parental genotypes are missing. Here, the haplotype frequencies are analogous to allele frequencies for a multiallelic marker, and the detrimental effects of allele frequency misspecification on linkage analysis have been well documented [3, 4]. Particularly when a disease locus is between closely spaced markers, multipoint linkage analysis is not robust to parameter misspecification [5]. When parental genotypes are available, pre-specified allele frequencies do not contribute to the LOD score calculation and the results are immune to the effects of inter-marker LD.
Extensive variation of linkage disequilibrium in the genome makes direct study of its effect on analysis difficult. Recently published work by Huang et al. highlighted the potential for LD-biased LOD scores in sibling pair studies [6]. We independently replicated their findings of inflated multipoint LOD scores due to inter-marker LD for affected sibling pairs without parental genotypes. In this work we report an expanded study of this phenomenon including nonparametric methods and up to 10 markers at varied levels of LD. We also compared two common measures of LD, D′ and r2 to determine which is superior for examination of the effect of LD on LOD score inflation. By including SNPs with common and rare minor allele frequencies we observed LOD scores when D′ was high and r2 was low.
Methods
Utilizing the SIMLA (SI Mulation of Linkage and Association) software package [7], 10,000 replicates of 200 affected sibling pair families each were simulated. Two family structures with two affected siblings were included: complete nuclear families (parents and offspring), often studied in early onset disorders such as neural tube defects or autism, and affected sibling pairs (no parents) more typical of late onset disorders, such as Alzheimer or Parkinson disease. At no time was a disease locus included in any simulation such that all elevated LOD scores are spurious. Table 1 summarizes the parameters varied in these simulation studies.
Table 1.
Simulated model parameters
| Model | Markers in LD | Flanking markers | |
|---|---|---|---|
| Additive | 2 | 0 | (a) Common × Rare and Rare × Rare (fig. 4) |
| Additive | 4 | 0 | |
| Additive | 2 | 2 | |
| Additive | 4 | 2 | |
| Additive | 2 | 4 | |
| Additive | 4 | 4 | |
| Additive | 2 | 6 | |
| Additive | 4 | 6 |
Multipoint and two-point analyses were performed for the following scenarios with and without parental genotypes All simulations were conducted at 6 levels of LD (D′ = 0, 0.2, 0.4, 0.6, 0.8, 1.0). All scenarios were run for markers with equal allele frequencies, (a) except the two cases noted where Common × Rare and Rare × Rare combinations of markers in LD were also analyzed without parental genotypes.
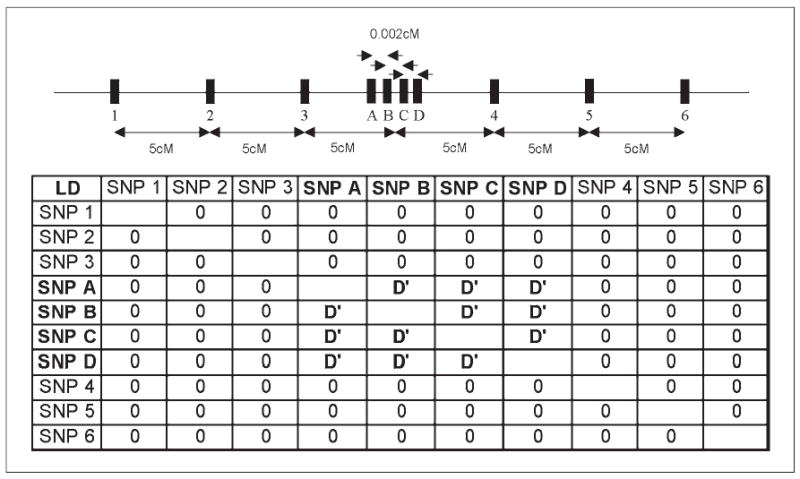
SIMLA allows for the simulation of LD between markers and/or disease loci by specifying the frequencies of haplotypes on chromosomes. Inter-marker LD between two or four markers with equal allele frequencies 0.0002 cM apart was specified by adjusting the haplotype frequencies to reflect levels of LD from 0 to 1 as measured by D′. Two, four, or six additional markers in linkage equilibrium with all markers were then added 5 cM on either side of the original markers (fig. 1). Nonparametric multipoint analysis of up to ten markers was performed using SIBLINK [8], while initial parametric analyses were performed with VITESSE.
Fig. 1.

Schematic of the ten markers and the simulated pair-wise LD between them. The addition of markers in equilibrium decreased, but did not eliminate the inflated false positive rate when parental genotypes were missing. Multipoints over multiple sets of markers in high LD further inflated LOD scores.
With the underlying assumption of linkage equilibrium two-point and multipoint LOD scores rely on the generating allele frequencies to infer parental genotypes. Even though the allele frequencies are correctly specified, LD between the markers leads to misspecification of the haplotype frequencies for multipoint analysis as illustrated in table 2. Analogous to the case of misspecified allele frequencies, as the misspecified haplotype frequencies get smaller the assumed probability that the haplotype is shared IBD increases, as does the false positive rate. For example when D′ = 1 the true haplotype frequency is 0.5 for the two observed haplotypes but the assumed frequency is 0.0625, notably smaller. Calculating a LOD score with haplotype frequency of 0.0625 instead of 0.5 would inflate the LOD score (and type I error) because the assumed haplotype frequency of 0.0625 results in a higher probability that observed allele sharing IBS is due to sharing alleles IBD than would be obtained from using the true haplotype frequency of 0.5.
Table 2.
Deviation between the proportion of haplotypes expected under linkage equilibrium and those observed with LD between the four biallelic markers as outlined in figure 1
| Observed proportions
|
|||||||
|---|---|---|---|---|---|---|---|
| Haplotype | Expected proportions | D′ = 0.0 | D′ = 0.2 | D′ = 0.4 | D′ = 0.6 | D′ = 0.8 | D′ = 1.0 |
| A1B1C1D1 | 0.0625 | 0.0625 | 0.15 | 0.2375 | 0.325 | 0.4125 | 0.5 |
| A1B1C1D2 | 0.0625 | 0.0625 | 0.05 | 0.0375 | 0.025 | 0.0125 | 0 |
| A1B1C2D1 | 0.0625 | 0.0625 | 0.05 | 0.0375 | 0.025 | 0.0125 | 0 |
| A1B1C2D2 | 0.0625 | 0.0625 | 0.05 | 0.0375 | 0.025 | 0.0125 | 0 |
| A1B2C1D1 | 0.0625 | 0.0625 | 0.05 | 0.0375 | 0.025 | 0.0125 | 0 |
| A1B2C1D2 | 0.0625 | 0.0625 | 0.05 | 0.0375 | 0.025 | 0.0125 | 0 |
| A1B2C2D1 | 0.0625 | 0.0625 | 0.05 | 0.0375 | 0.025 | 0.0125 | 0 |
| A1B2C2D2 | 0.0625 | 0.0625 | 0.05 | 0.0375 | 0.025 | 0.0125 | 0 |
| A2B1C1D1 | 0.0625 | 0.0625 | 0.05 | 0.0375 | 0.025 | 0.0125 | 0 |
| A2B1C1D2 | 0.0625 | 0.0625 | 0.05 | 0.0375 | 0.025 | 0.0125 | 0 |
| A2B1C2D1 | 0.0625 | 0.0625 | 0.05 | 0.0375 | 0.025 | 0.0125 | 0 |
| A2B1C2D2 | 0.0625 | 0.0625 | 0.05 | 0.0375 | 0.025 | 0.0125 | 0 |
| A2B2C1D1 | 0.0625 | 0.0625 | 0.05 | 0.0375 | 0.025 | 0.0125 | 0 |
| A2B2C1D2 | 0.0625 | 0.0625 | 0.05 | 0.0375 | 0.025 | 0.0125 | 0 |
| A2B2C2D1 | 0.0625 | 0.0625 | 0.05 | 0.0375 | 0.025 | 0.0125 | 0 |
| A2B2C2D2 | 0.0625 | 0.0625 | 0.15 | 0.2375 | 0.325 | 0.4125 | 0.5 |
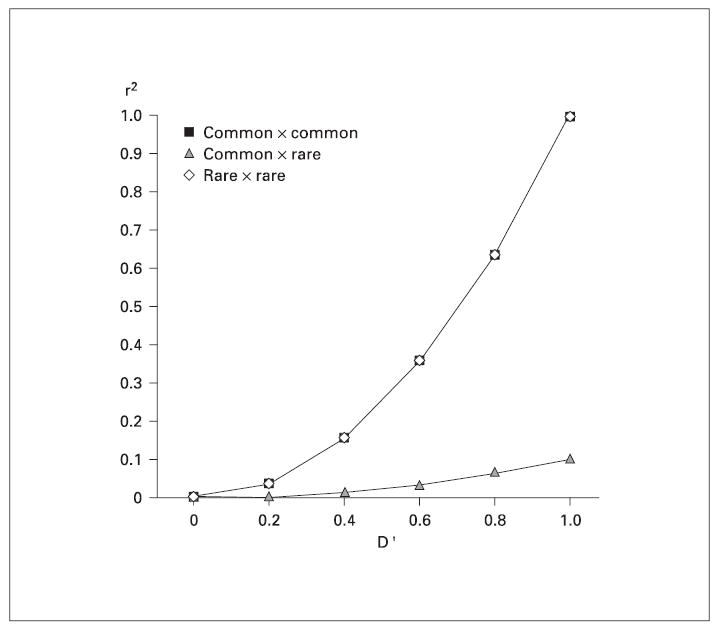
To examine the influence of misspecified haplotype frequencies (and the effect of different numbers of markers in different degrees of LD on that haplotype misspecification) on LOD scores, two allele frequency scenarios were simulated; first, markers with equally frequent alleles and second, markers with minor allele frequencies of 0.5 and 0.1. Two markers with common alleles, two with rare alleles, or one of each type were analyzed for 2 markers in LD. By varying the allele frequencies, we reduced the r2 value while holding the D′ value constant (fig. 2).
Fig. 2.

The relationship between D′ and r2 when both allele frequencies are common (MAF = 0.5), one is common and one is rare (MAF = 0.1), or both are rare. When allele frequencies are disparate, there is a strong discrepancy between the D′ and r2 measures.
For evaluating the false positive rate, data were generated without linkage to a disease locus. LOD score thresholds of 1, 2, or 3 were considered as cutoffs for significant linkage. No disease locus was simulated thus all LOD scores over the threshold indicate a false positive result. Results were compared for multipoint analysis with two to ten markers with and without parental genotypes and with varying levels of LD.
Results
Nonparametric LOD Scores Show Inflation
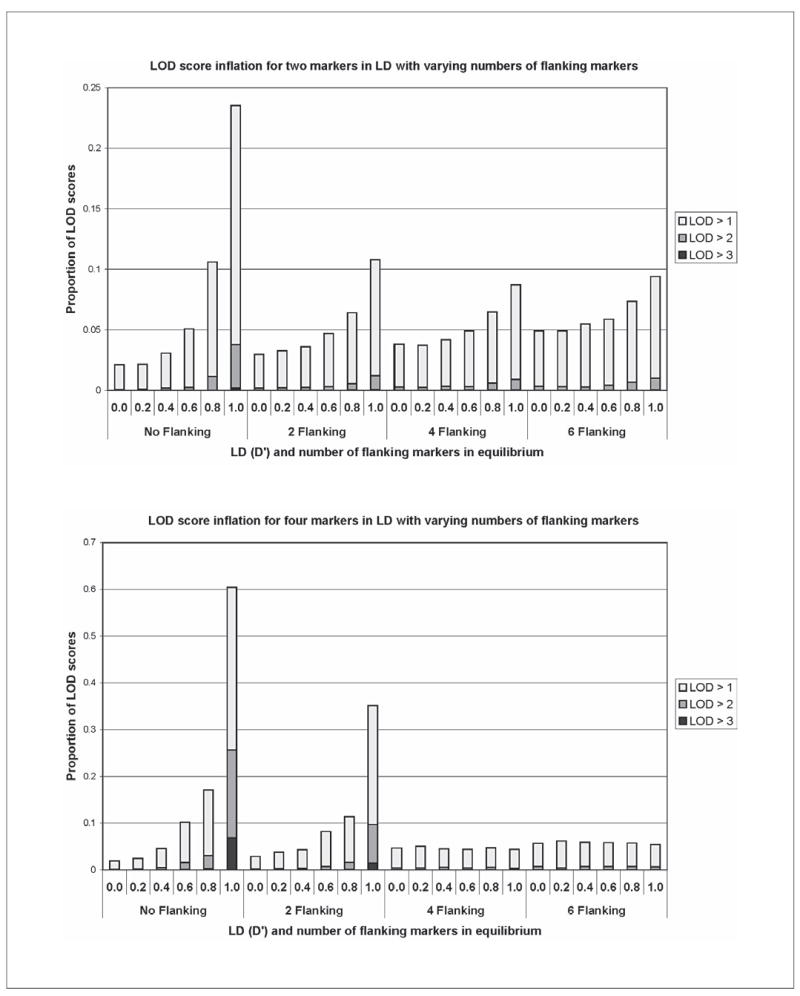
As in the work of Huang et al. [5], we found that parametric multipoint linkage scores were inflated due to inter-marker LD, with 66% of replicates producing a LOD score over 3 when D′ = 1 and no parents were included (data not shown). Nonparametric analysis shows inflation as well. Figure 3 illustrates how inflation increases with LD when two and four markers in LD are included in the multipoint and decreases as flanking markers in equilibrium are included. When no LD was present or when parents were included in the analysis, 0.2% of replicates produced a LOD score over 2. When only two markers with LD of 1.0 are included, 3% of replicates produced a score over 2, while this figure increases to 25% for 4 markers in LD. Average estimated sharing IBD significantly increased from 0.5 to 0.55 in the two marker scenario for D′ = 0.0 and 1.0 respectively. When there are two markers in LD (D′ = 1), the proportion of replicates with LOD scores greater than 1 decreases from 24% without flanking markers to 11% with two markers in linkage equilibrium and 9% with four or six flanking makers (fig. 3). When 4 markers are in LD (D′ = 1), the proportion of scores over 1 is 60% without flanking markers, 35% for two, 4.4% for four, and 5.4% for six flanking markers. As expected, no inflation was seen in two-point scores or when parental genotypes were included (data not shown).
Fig. 3.

Nonparametric multipoint analysis without parents for two or four markers in LD are shown. The proportion of LOD scores greater than 1, 2, and 3 are reported as D′ levels vary between 0 and 1 and as 2, 4, and 6 flanking markers in equilibrium are added to the multipoint. Inflation increases when markers in LD are added and decreases but is not eliminated as flanking markers in equilibrium are incorporated.
r2 Is a Better Predictor of Inflation when Allele Frequencies Are Disparate
Introducing markers with a MAF of 0.1 creates a discrepancy between two common measures of LD, D′ and r2. D′ is scaled from –1 to 1 by the observed marker allele frequencies such that a D′ of 0 indicates no LD and a D′ of –1 or 1 indicates the maximum possible LD given those allele frequencies. Another measure, r2, is a squared correlation coefficient and denotes the ability of alleles at one marker to predict alleles at the second marker. When two markers have equal allele frequencies r2 will be equal to (D′)2, but when the allele frequencies at the two markers are different the r2 will not maximize to 1 (fig. 2).
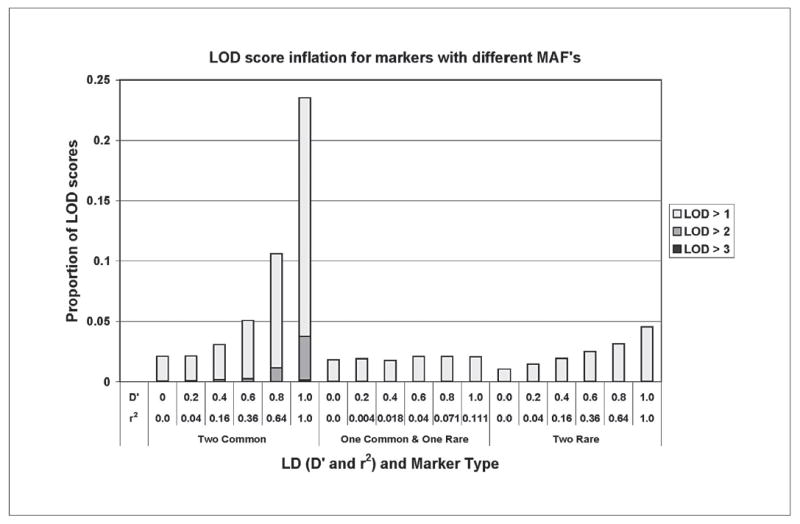
In the one common marker and one rare marker case, r2 maximizes to 0.11 and no inflation of LOD scores is observed in the scenario of two markers in LD (fig. 4). Inflation is not as great in the case with two rare allele markers compared to two common allele markers, but inflation is still noticeable at D′ levels as low as 0.4 (equivalent to an r2 of 0.16). The one common with one rare marker scenario never reaches an r2 level of 0.16 and no inflation is observed. In this case 2% of the replicates produced a LOD score over 1, compared to two rare allele markers with 1.1% when D′ = 0 and 4.6% when D′ = 1.
Fig. 4.

The proportion of nonparametric multipoint LOD scores over 1, 2, and 3 for two common (MAF = 0.5), common and rare (MAF = 0.1), and two rare allele frequencies over two markers in LD without parental genotypes only show inflation when r2 levels go above 0.16 in the rare × rare case.
Discussion
Inter-marker LD dramatically increased the false positive rate of multipoint linkage analysis in simulated datasets when parental genotypes were missing. Linkage disequilibrium unaccounted for in linkage analysis, even as low as D′ = 0.4 across all of the markers, can still increase the likelihood of a spurious positive finding. Incorporating flanking markers not in LD tempered this effect, but the false positive rate was still higher than expected. Even higher levels of inflation were seen when four markers were in LD for nonparametric multipoint analysis. As expected no effect of inter-marker LD was observed when parental genotypes were available.
Two popular measures of LD, D′ and r2, are not equivalent when the markers’ allele frequencies are different; further complicating evaluation of the impact of LD on linkage analysis. D′ and r2 both maximize to 1 only when the markers in LD have equal allele frequencies. When two markers have disparate allele frequencies and the maximum value of LD may achieve the maximum of D′ of 1, however r2 will be lower, often dramatically lower exhibiting less sensitivity to allele frequency misspecification. Our simulation studies show that whether allele frequencies are rare or common, LOD scores only showed inflation when the r2 measure was above 0.16. Our results indicate that the r2 measure should be used when addressing the possibility of inflated multipoint LOD scores due to inter-marker LD.
Inter-marker LD did not affect two-point LOD scores because individual marker allele frequencies were correctly specified in Hardy-Weinberg equilibrium while haplotype frequencies were not, violating the assumption of linkage equilibrium. Large discrepancies between the two-point and multipoint results in a small region may be an indication that the assumptions of the multipoint map are not correct. In these simulated data, unaccounted for LD is inflating the multipoint LOD scores. In this case, two-point LOD scores may be more reliable than multi-point scores. Multipoint mapping helps localize the gene and can increase the genetic informativeness, but as reiterated here, it is more vulnerable to spurious results when parameters are misspecified.
Most analysis programs assume linkage equilibrium when inferring parental haplotype frequencies and such estimates may be quite different from the true haplotype frequencies (table 2). Determining how to evaluate and best incorporate LD into linkage analysis is a topic under intense debate, in large part due to the tremendous resources available through the HapMap initiative [9]. The simplest solution to combat the effect of regions of strong LD is to re-code haplotype blocks as a single multiallelic marker with the correct haplotype frequencies as allele frequencies. Analysis of the re-coded data would be straightforward and not prone to inflation, however the logistics of delineating these blocks and properly coding them can be difficult and time-consuming. Analyzing only haplotype tagging SNPs may be useful here.
Terwilliger and Ott [10] proposed an extension of the Haplotype Relative Risk method to estimate the extent of LD and increase the power of the study. Another promising solution that directly addresses this issue is included in Merlin version 1.0, where a clustering strategy for markers in tight LD corrects for the inflation in LOD scores [11]. Incorporating LD into analytical methods can only be done when its presence has already been noted, but unaccounted for LD will still affect the results and create problems correctly estimating parental haplotype frequencies.
The temptation to select markers that produce the highest LOD scores is great, particularly in diseases where samples from multiple generations are rare, limiting the power of proposed studies. Despite the potential to increase informativeness and improve localization, multi-point LOD scores should be viewed with caution when there are missing parental genotypes and the multipoint LOD score is much greater than the two point LOD scores. Linkage disequilibrium must be evaluated between SNPs and even close microsatellite markers, because low levels can still create inflated LOD scores purely due to marker-marker LD rather than disease-marker LD. The development of statistical methods that accurately account for LD in multipoint analysis will help to capitalize on all the available information resulting from the current emphasis on linkage disequilibrium and haplotype mapping.
Acknowledgments
Special thanks to Evadnie Rampersaud and Kristen Bastress for their support on this project, as well as the anonymous reviewers of this paper who provided very helpful comments that strengthened our conclusions. We gratefully acknowledge support from these grants: NS39818, ES11961, ES11375, MH59528, AG19757, AG021547, EY015216, HD39948, HL073389, and NS26630.
References
- 1.Matise TC, Sachidanandam R, Clark AG, Kruglyak L, Wijsman E, Kakol J, Buyske S, Chui B, Cohen P, de Toma C, Ehm M, Glanowski S, He C, Heil J, Markianos K, McMullen I, Pericak-Vance MA, Silbergleit A, Stein L, Wagner M, Wilson AF, Winick JD, Winn-Deen ES, Yamashiro CT, Cann HM, Lai E, Holden AL. A 3.9-centimorgan-resolution human single-nucleotide polymorphism linkage map and screening set. Am J Hum Genet. 2003;73:271–284. doi: 10.1086/377137. [DOI] [PMC free article] [PubMed] [Google Scholar]
- 2.Cardon LR, Abecasis GR. Using haplotype blocks to map human complex trait loci. Trends Genet. 2003;19:135–140. doi: 10.1016/S0168-9525(03)00022-2. [DOI] [PubMed] [Google Scholar]
- 3.Clerget-Darpoux F, Bonaiti-Pellie C, Hochez J. Effects of misspecifying genetic parameters in lod score analysis. Biometrics. 1986;42:393–399. [PubMed] [Google Scholar]
- 4.Ott J. Linkage analysis with misclassification at one locus. Clin Genet. 1977;12:119–124. doi: 10.1111/j.1399-0004.1977.tb00913.x. [DOI] [PubMed] [Google Scholar]
- 5.Risch N, Giuffra L. Model misspecification and multipoint linkage analysis. Hum Hered. 1992;42:77–92. doi: 10.1159/000154047. [DOI] [PubMed] [Google Scholar]
- 6.Huang Q, Shete S, Amos CI. Ignoring linkage disequilibrium among tightly linked markers induces false-positive evidence of linkage for affected sib pair analysis. Am J Hum Genet. 2004;75:1106–1112. doi: 10.1086/426000. [DOI] [PMC free article] [PubMed] [Google Scholar]
- 7.Bass MP, Martin ER, Hauser ER. Pedigree generation for analysis of genetic linkage and association. Pac Symp Biocomput. 2004:93–103. doi: 10.1142/9789812704856_0010. [DOI] [PubMed] [Google Scholar]
- 8.Hauser ER, Boehnke M. Genetic linkage analysis of complex genetic traits by using affected sibling pairs. Biometrics. 1998;54:1238–1246. [PubMed] [Google Scholar]
- 9.Gibbs RA The International HapMap Consortium. The International HapMap Project. Nature. 2003;426:789–796. doi: 10.1038/nature02168. [DOI] [PubMed] [Google Scholar]
- 10.Terwilliger JD, Ott J. A haplotype-based ‘haplotype relative risk’ approach to detecting allelic associations. Hum Hered. 1992;42:337–346. doi: 10.1159/000154096. [DOI] [PubMed] [Google Scholar]
- 11.Abecasis GR, Wigginton JE. Linkage analysis with markers that are in linkage disequilibrium. Annual Meeting of the American Society of Human Genetics 2004, Abstract 94.


