

Abstract
Background
Although scientists have used animal models for years to study the effects of ethanol (EtOH) ingestion on humans, the compounding effect of cigarette smoking has been virtually ignored. Because 80–95% of human alcoholics smoke, it is imperative to consider the added effects of smoking when trying to determine the consequences of excessive alcohol ingestion. We therefore have developed a rat model for studying the separate and combined results of smoking and drinking on human health.
Methods
Male Sprague-Dawley rats were exposed daily for 12 weeks in whole body chambers to cigarette smoke (smoke-exposed) or room air (sham-exposed). During the final 5 weeks of exposure, the rats were fed liquid diets containing 0%, 16%, 26% or 36% EtOH calories. Smoke exposure was quantified by measurement of carboxyhemoglobin, nicotine, and cotinine levels. Body weights, food consumption, blood EtOH concentrations, and various assessments of liver damage and function also were followed.
Results
Smoke exposure in this rat model approximates that of a moderate to heavy human smoker. Smoke-exposed rats weighed significantly less and ate less food than sham-exposed controls, but both groups ingested equivalent amounts of EtOH for their body weights and had comparable blood EtOH levels. Liver aspartate and alanine aminotransferase levels remained normal. There was an EtOH-induced decrease in asialoglycoprotein receptor binding, but it was not exacerbated by smoke-exposure. Alterations in blood cholesterol levels reflected what has been reported for humans, rising with increasing EtOH ingestion and decreasing with smoke-exposure.
Conclusion
Our rat model is relevant to what transpires in the vast majority of alcoholics. Both ethanol ingestion and smoke exposure can be manipulated to mimic light to moderate to heavy levels, making it appropriate for studying the separate and combined biomedical consequences of alcohol abuse and cigarette smoking.
Keywords: Rat Model, Ethanol, Smoking, Cotinine, Cholesterol
The many and varied biomedical consequences of alcohol abuse have been recognized for centuries (Lieber, 1992, Osler, 1909, Poultney, 1786). Studies in humans and laboratory animals have measured the effects of excessive ethanol (EtOH) ingestion on virtually every aspect of health (). For years our laboratory and others have used acutely or chronically intoxicated rodent models to study the deleterious effects of EtOH abuse on host defense against microbial infections. The contribution of nutritional deficiency has been controlled for in studies utilizing chronic EtOH ingestion by inclusion of pair-fed animals receiving isocaloric diets or supplements in which EtOH was replaced by carbohydrates (Bautista and Wang, 2001; Davis, et.al., 1991; Nelson, et.al., 1989; Taylor et.al., 2002). However, the effect of smoking, another major complicating factor in human alcoholism, has been regularly overlooked.
Given that 80–95% of alcoholics smoke (Bien and Burge, 1990; ) and smoking is clearly associated with increased incidence and severity of respiratory tract diseases (Finklea, et al., 1971; Nuorti, et al., 2000), it is imperative to consider the compounding effects of smoking when studying EtOH-induced defects in host defense against infections such as pneumonia. Although there have been a few studies in which the effects of acute cigarette smoke and ethanol on pancreatic injury (Hartwig, et.al, 2000) or chronic ethanol plus nicotine injection on CYP2E1 and antioxidant levels were measured (Howard, et. al, 2001; Husain, et.al., 2001), to our knowledge there have been no published reports of animal models that examine the combined effects of chronic ethanol ingestion and cigarette smoke inhalation on host resistance to infection. To this end, we have developed a rat model of concurrent EtOH ingestion and smoke exposure to study the separate and combined effects of these two risk factors. This manuscript describes the model system, provides basic data on its relevance to human alcoholics who smoke, and validates its suitability for the study of a wide range of health-related consequences of alcohol abuse and smoking in a mammalian host.
METHODS
Animals
Male Sprague-Dawley rats (Charles River Laboratories, Kingston, NY) were obtained at 4–5 weeks of age (100–125 g) and rested for at least 1 week prior to their first smoke exposure. They were housed in group cages on a 12-h light/dark cycle with unlimited access to rat chow (Purina, Inc., St. Louis, MO) and tap water. All rats were weighed weekly to monitor growth rates.
Smoke Exposure
Rats were passively exposed to cigarette smoke twice daily on weekdays and once daily on weekends in whole-body chambers purchased from Teague Enterprises in Davis, CA (Teague, et al., 1994). Each of 2 exposure chambers was large enough to accommodate 4 cages, allowing simultaneous exposure of up to 32 rats. Smoke for each exposure was generated over ~ 1h by 30 standard 2R4F reference cigarettes (Tobacco and Health Research Institute, University of Kentucky) smoked in 6 cycles of 5 cigarettes each. The machine was automated to load, light, and puff each cigarette 9 times before ejecting them. Both mainstream and side-stream smoke were collected, mixed with air in a conditioning chamber, and then pumped into the exposure chambers. Sham-exposed animals were placed in similar chambers for equivalent lengths of time, but exposed to room air only.
The rats were acclimatized to the smoking chambers over a 3-day period, being exposed to a total of 12, 18, 24, and finally 30 cigarettes per session. To control for potential differences in smoke exposure between the 2 smoking chambers and among different locations within each chamber, each cage of rats was rotated through the 8 possible chamber locations upon successive exposures. Smoke concentrations within each chamber were monitored regularly by weighing the total suspended particles in a measured volume of air sampled over a 5 minute period (Teague, et.al., 1994). The mean particle level (± S.D.) measured during a representative experiment was 73.9±13.6 mg/m3, which correlates in our machine with a carbon monoxide level of 350 ppm and a nicotine level of 4.2 mg/m3.
Food and Ethanol Consumption
Rat chow consumption was measured daily during weeks 2 and 6 of smoke- or sham-exposure. Because the rats were housed 2/cage, the total amount of chow eaten per cage was divided in half to calculate mean consumption per rat. To account for the obvious differences in body weights of smoke-exposed vs. sham-exposed animals, relative food consumption also was calculated by dividing the total weight of the animals in each cage into the weight of food eaten and expressing it as g of food consumed per 100 g of rat weight (Hoffman, et.al. (2002).
After the rats had been smoke- or sham-exposed for 6 weeks, they were moved to individual cages without access to rat chow or water and acclimated over a 3-day period to isocaloric Lieber-DeCarli 35% fat liquid diets (Dyets, Inc., Bethlehem, PA) containing 0%, 16%, 26%, or 36% EtOH calories. The 16% and 26% diets were prepared by mixing control diet and 36% EtOH diet in 566:444 ml and 278:722 ml proportions, respectively. This resulted in 8 groups of animals (4 smoke-exposed and 4 sham-exposed), all of which were fed their respective diets ad libitum (up to 120 ml/day) during the final 5 weeks of smoke or sham exposure. Diet volume, total g of EtOH consumed/day and g of EtOH consumed per day per 100 g of rat weight were monitored for individual rats throughout this period.
Quantification of Smoke Exposure
The level of smoke exposure was quantified through blood carboxyhemoglobin (CoHb), blood nicotine, and urine cotinine levels. CoHb measurements were performed using an IL- 682 CO-Oximeter (Instrumentation Laboratories, Lexington, MA). One mL of blood was collected in a heparinized syringe by cardiac puncture under isoflurane anesthesia (Halocarbon Laboratories, River Edge, NJ) within the first 20 min after removal from the exposure chambers. Remaining plasma from individual rats was pooled to obtain sufficient quantities for blood nicotine levels. Eight plasma pools from rats smoke-exposed in the same chamber on the same day plus 4 from sham-exposed rats were tested in the Clinical Pathology Laboratory of San Francisco General Hospital.
Urine cotinine levels were measured using a Double Antibody Nicotine Metabolite Radioimmunoassay kit (Diagnostic Products Corporation, Los Angeles, CA) during week 6 of smoke- or sham- exposure alone and again during week 3 of combined smoke exposure and EtOH ingestion. Immediately after their morning smoke or sham exposure, rats were placed in individual cages suspended above pieces of aluminum foil. Urine was collected from the foil at 30-minute intervals. The procedure was repeated the following day for any rat that did not urinate within the first 2 h after removal from the chamber. Creatinine levels also were measured on the same urine samples using a Metra™ Creatinine Assay kit (Quidel Corporation, San Diego, CA). For each sample, the cotinine value was divided by its creatinine level to correct for relative differences in fluid intake and compensate for variations in urine concentration as prescribed for drug testing in humans (Lafolie, et.al., 1991).
Blood Ethanol Levels
Blood (200 μL) was collected for EtOH levels on day 5 and again at the end of week 3 of EtOH feeding by aseptic puncture of the rats’ foot veins (Snitily, et. al., 1991). The samples were collected in the early morning, ~1 h after initiation of the light cycle and just before fresh liquid diet was provided. The tubes were tightly capped and held on ice just until clotted. The serum then was removed and frozen in tightly sealed vials until assayed using a commercial kit (Sigma Diagnostics, St. Louis, MO).
Assessment of Liver Injury and Function
Sera collected at the time of euthanasia were assayed at the Omaha VA Medical Center Clinical Laboratory for alanine aminotransferase (ALT) and aspartate aminotransferase (AST) levels as markers of liver injury. Total serum cholesterol was assayed at the end of week 4 of combined smoke exposure and EtOH ingestion using a kit from ThermoDMA (Arlington, TX). High-density lipoprotein (HDL) levels were measured on the same samples after treatment with a phosphotungstate precipitating reagent that selectively removes LDL and VLDL. Although the rats were not fasted overnight, blood was collected 3–4 h after initiation of the light cycle and food was withheld for the final 1.5 h while the rats were in the exposure chambers. Values for each of these assays were compared to age-matched male Sprague-Dawley rats maintained on rat chow and water.
Western blot analysis for liver asialoglycoprotein receptor (ASGP-R) levels was performed as described recently (Casey, et.al., 2004) on liver pieces collected at euthanasia from smoke-and sham-exposed rats in the 0% and 36% diet groups. Briefly, frozen samples were homogenized, resolved on a 10% polyacrylamide gel, transferred to nitrocellulose, and detected with a polyclonal rabbit antibody followed by incubation with I125 Protein A. Quantification of autoradiograms was performed using the Molecular Dynamics STROM 820 PhosphorImager and analyzed with ImageQuant 5.0 software.
Statistical Methods
All data were tested for normality and equal variance before statistical tests were performed. Differences between smoke- and sham-exposed animals were determined by Students t test or the Mann-Whitney Rank Sum test if the data were non-parametric. Differences among the diet groups within the smoke- or sham- exposure groups were determined for parametric data by One Way ANOVA with Tukey’s post-hoc testing for pair-wise comparisons or the Holm-Sidak pairwise multiple comparision when a chow-fed control group was included. For non-parametric data, the Kruskal-Wallis ANOVA on Ranks was performed, with post-hoc testing by Dunn’s method. Comparison of values in rats before and after initiation of the EtOH diets was performed by paired t-test. All statistical comparisons were made using SigmaStat (SPSS, Inc., Chicago, IL), and a p value of <.05 was considered significant.
RESULTS
Carboxyhemoglobin, Nicotine, and Cotinine Levels
The mean ± S.D. CoHb levels measured after 4 separate exposure sessions was 17.6 ± 6.0% (range 7.8 – 29.0%) for 62 smoke-exposed and 0.3 ± 0.4% (range 0.0 – 1.3%) for 64 sham-exposed rats. There were no significant differences (data not shown) among CoHb levels for rats in the various diet groups. Mean blood nicotine levels were 44.7 ± 12.1 ng/mL (range 31.2 to 60.7 ng/mL) in plasma pools from smoke-exposed rats and undetectable in those from sham-exposed rats. Due to the necessity for pooling sera, the sample size was too small for statistical comparisons of nicotine levels for rats ingesting the different diets.
Unadjusted urine cotinine levels ranged from 1,592 to 17,778 μg/L in 59 smoke-exposed rats and undetectable to 134 μg/L in 64 sham-exposed rats. The cotinine:creatinine ratio for the same samples ranged from 1,899 to 10,641 μg/g (mean of 5,466 ± 1932) in smoke-exposed and 0 to 243 μg/g (mean of 44.9 ±57.6) in sham-exposed rats. There were no significant differences (data not shown) among urine cotinine:creatinine ratios for smoke-exposed rats in the various diet groups, nor between values for individual rats tested before and after placement on the liquid diets.
Body Weight Gain
Smoke-exposed rats gained weight more slowly and weighed significantly less (p <.001) than sham-exposed controls after the first week of smoke exposure (Fig. 1). When switched from chow and water to the liquid diets (Fig. 2), smoke- and sham-exposed rats eating the 36% EtOH diet lost a comparable amount of weight during the first week: 18.5 ± 9.9 g for smoke-exposed (Fig 2A) and 16.1 ± 7.9 g for sham-exposed (Fig 2B); p = .514 by Students t-test). This represented 5.7% and 4.4%, respectively, of their pre-EtOH body weight. By the second week of EtOH ingestion, rats in both exposure groups eating the 36% diet started to regain weight. Although their weights continued to be significantly lower than those for rats within their exposure groups eating the remaining diets (p ≤ .001 for all comparisons), they gained weight at similar rates during weeks 2–5 of EtOH feeding.
Fig. 1.
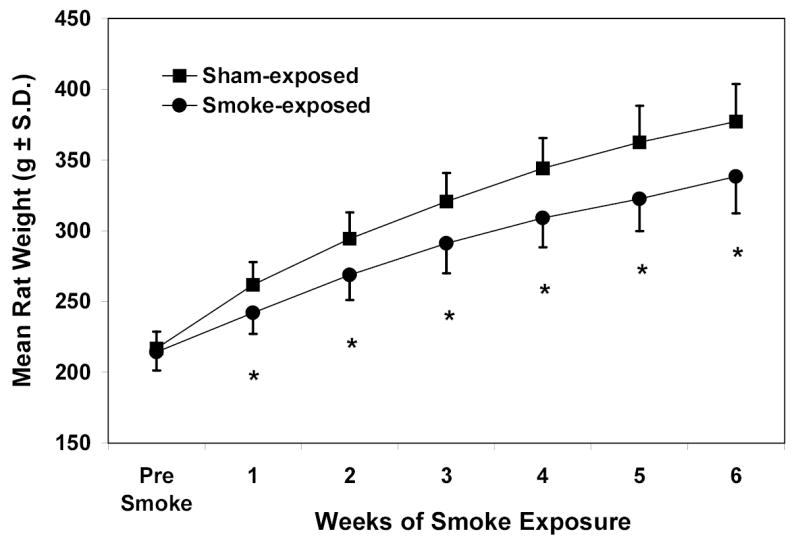
Weekly body weights (g ± S.D.) of rats during the first 6 weeks of smoke- or sham-exposure alone (n = 48). * Significantly lower for smoke-exposed than sham-exposed rats (p<.001 by t-test).
Fig. 2.


Weekly body weights (g) of rats during the 5 weeks of concurrent smoke-exposure (2A) or sham-exposure (2B) and EtOH feeding (n = 12). ** 36% group significantly lower than 16% and 0% groups; * 36% group significantly lower than all other diet groups (p <.001 by ANOVA).
Food and Ethanol Consumption
Smoke-exposed rats ate significantly less chow per day (p <.001) during weeks 2 and 6 of smoke- or sham-exposure (Fig. 3). However, chow consumption relative to body weight was only statistically higher for the sham-exposed rats (p <.01) during week 2, when the rats were still adjusting to smoke exposure.
Fig. 3.

Chow consumption (g eaten per day ± S.D.) during weeks 2 and 6 of smoke- or sham-exposure alone (n = 24 cages of 2 rats each). * Smoke-exposed significantly lower than sham-exposed (p<.01 by t-test).
Smoke exposure also affected the volume of the liquid diets eaten by rats within each of the EtOH diet groups. During the first week of concurrent smoke-exposure and EtOH feeding (Fig. 4A), there was a dose-dependent increase in diet consumption as the percentage of EtOH in the diet decreased. Rats in both exposure groups eating the 36% diet consumed approximately half as much as those eating the 0% diet. By week 5 of liquid diet feeding (Fig. 4B), consumption of the 36% diet had increased and that of the 0% diet decreased, such that smoke-exposed and sham-exposed rats fed the 36% diet ate 82.1% and 77.3%, respectively, as much as those in their exposure group fed the 0% diet.
Fig. 4.


Mean volume of liquid diet (mL ± S.D.) consumed per rat during 1st week (4A) and 5th week (4B) of concurrent smoke- or sham-exposure and EtOH feeding (n = 12). Bars in each figure are labeled with distinct letters to denote diet groups statistically different from one another (p< .001 by ANOVA), with lower case letters for the smoke-exposed groups and upper case for the sham-exposed groups. Lines above bars indicate that value for smoke-exposed rats is significantly lower than that for sham-exposed rats within the same diet group (p values given as determined by t-test).
During all 5 weeks of EtOH feeding, smoke-exposed rats ate significantly less of each of the diets than their corresponding sham-exposed counterparts (p < .03 for all comparisons; data not shown). However, when the mean daily g of EtOH ingested/100 g of rat weight was calculated, only occasional differences were noted between smoke-and sham-exposed rats within the same diet group (representative experiment shown in Table 1).
Table 1.
Mean Daily Grams of EtOH Consumed/100 g Rat Weight ± S.D. (n = 12)
| Week 1 |
Week 2 |
Week 3 |
Week 4 |
Week 5 |
||||||
|---|---|---|---|---|---|---|---|---|---|---|
| EtOH in Diet | Smoke† | Sham† | Smoke‡ | Sham‡ | Smoke‡ | Sham‡ | Smoke‡ | Sham‡ | Smoke‡ | Sham‡ |
| 36% | .70 ± .10 | .72 ± .09 | .90 ± .08 | .88 ± .08 | .99 ± .07 | 1.02 ± .10 | .87 ± .11 | .90 ± .15 | .94 ± .09 | .91 ± .08 |
| 26% | .68 ± .21 | .74 ± .08 | .75 ± .10 | .76 ± .07 | .75 ± .10 | .81 ± .09 | .64 ± .13 | .66 ± .12 | .65 ± .09 | .63 ± .06 |
| 16% | .51 ± .03 | .55 ± .06* | .47 ± .03 | .50 ± .04 | .44 ± .02 | .46 ± .04 | .42 ± .02 | .42 ± .04 | .40 ± .02 | .39 ± .04 |
36% and 26% > 16% (p<.001 by ANOVA)
36% > 26% > 16% (p<.001 by ANOVA)
Value for sham-exposed rats significantly higher than for smoke-exposed rats (p = .03 by t-test)
Blood Ethanol Levels
Blood EtOH levels in both smoke-exposed and sham-exposed rats reflected the concentrations of EtOH in their diets (Fig. 5). Because blood EtOH levels vary widely in individual rats, data were combined from three separate experiments (n = 20) to increase the statistical power of the analysis. Nevertheless, blood EtOH did not differ significantly between smoke-exposed and sham-exposed rats within each feeding group after either 5 days (Fig. 5A) or 3 weeks (Fig. 5B) of EtOH ingestion. At both time points rats eating the 36% diet had significantly higher blood EtOH levels than those within their corresponding exposure group eating any of the other diets (p <. 001 for all comparisons).
Fig. 5.


Early morning blood EtOH levels (mg/dL ± S.D.) for rats on day 5 (5A) and at the end of week 3 (5B) of concurrent smoke- or sham-exposure and EtOH feeding (n = 20). * 36% diet group significantly higher than all other diet groups within the same exposure group (p < .001 by Kruskal-Wallis One Way ANOVA on Ranks).
Liver Damage and Function
At the time of euthanasia, serum AST and ALT levels were similar for smoke-exposed and sham-exposed rats eating the 0% or 36% liquid diets, and none of the values were significantly different from those obtained from chow-fed control rats (data not shown). There was a significant (p < .05) EtOH-induced reduction in liver ASGP receptor content. Values were lowered by an average of 30% for rats eating the 36% diet compared to those eating the 0% diet, regardless of whether they were smoke- or sham-exposed (Fig. 6).
Fig. 6.


Immunochemical detection of total ASGP-R content in rat livers. 6A is representative immunoblot of solubilized liver fractions from 0% EtOH-fed animals that were sham-exposed (lane 1) or smoke-exposed (lane 3), and 36% EtOH-fed animals that were sham-exposed (lane 2), or smoke-exposed (lane 4). The three bands represent the subunits of ASGP-R (RHL-1, 2, and 3). 6B is densitometric analysis of Western blots prepared with liver samples obtained from six sets of rats. Quantification of the resultant blots was achieved by normalizing the densitometric values to the amount of protein loaded onto the gel, and are represented as densitometric units per mg protein. * indicates values from 36% EtOH-fed animals are significantly lower than their respective sham- or smoke-exposed controls (p <0.05).
Total serum cholesterol levels (Fig. 7A) followed a U-shaped pattern, with animals eating the 36% diet having the highest values. Levels for sham-exposed rats in the 36%, 26%, and 0% diet groups all were significantly higher (p < .05) than those measured for age-matched, chow-fed control rats. By comparison, the only smoke-exposed rats with total cholesterol levels significantly higher than those for chow-fed controls were in the 36% EtOH diet group. Total serum cholesterol levels also were significantly lower (p ≤ .02) for smoke-exposed than sham-exposed rats in all but the 16% diet group.
Fig. 7.


Serum total cholesterol (7A) and serum HDL cholesterol (7B) for rats during week 4 of combined smoke exposure and EtOH ingestion. n = 12–14 for Fig. 7A and 4–6 for Fig. 7B. Bars in each figure are labeled with distinct letters to denote diet groups statistically different from one another (p< .05 by ANOVA), with lower case letters for smoke-exposed groups and upper case for sham-exposed groups. Lines above bars in 7A indicate value for smoke-exposed rats is significantly lower than that for sham-exposed rats in the same diet group (p values determined by Mann-Whitney rank sum test for 36% and 0% diet and Student’s t-test for 26% diet). * Value is significantly higher than that for chow-fed control group. (p < .05 for 7A and <.01 for 7B).
Although HDL cholesterols could only be measured on 4–6 rats/group (Fig. 7B), there were statistically significant differences showing higher HDL levels with increasing EtOH in the diet (p < .02 for both smoke-exposed and sham-exposed rats). Levels for the 36% smoke-exposed and the 36% and 26% sham-exposed groups also were significantly higher than those for chow-fed controls (p < .01). Although the mean HDL values were lower for smoke-exposed than sham-exposed rats in all but the 36% EtOH diet group, none of the differences reached statistical significance.
DISCUSSION
The co-occurrence of alcohol abuse and smoking in humans has long been acknowledged (Ayers and Templer, 1972; ;), and the health hazards associated with the combination are often greater than the sum of their separate risks (Blot, 1992; Sobell, et.al., 1990; Zacny, 1990). In one study of overall mortality after inpatient treatment for alcoholism and other drugs of dependence, alcohol was listed as an underlying cause for 34.1% of the deaths, whereas tobacco-related causes were cited in 50.9% (Hurt, et.al., 1996). This underscores the importance of considering the concomitant effects of smoking when designing animal experiments to study the biomedical consequences of alcohol abuse.
Although our laboratory will be using this rat model primarily to compare the effects of drinking and smoking on susceptibility to infectious diseases, it can be utilized to examine numerous other health-related issues. Sprague-Dawley rats are well suited to such studies because they will consume relatively large quantities of ethanol in liquid diets (Davis, et.al, 1991; Lieber, et.al., 1989; Lieber and DeCarli, 1994) and they reportedly can tolerate a dose of smoke equivalent to the total daily consumption of a human smoker in one 20-minute session (Griffith and Standafer, 1985). In our model, rats receive two 1-h long sessions each day that roughly approximates the exposure for a 1½ pack/day smoker. The rats appeared to adapt quickly, spending most of their time sleeping in the smoking chambers after the first few sessions.
The relevance of smoke exposure in our model system to smoking in humans was determined by quantification of blood CoHb, blood nicotine, and urine cotinine levels. Immediately after removal from the chambers, smoke-exposed rats had a mean blood CoHb level of nearly 18%. This is comparable to the 11–19% range reported previously for rats exposed to side-stream cigarette smoke (Gairola, 1987; Griffith and Standafer, 1985), but considerably higher than the peak levels of 8–10% reported for humans smoking 30 cigarettes/day at half-hour intervals (Benowitz, et.al, 1982). The lower concentrations in the human study may have been due to drawing the subjects’ blood nearly 30 min after his/her last cigarette, as we also have noted a rapid drop in blood CoHb levels to 8–9% within the first 20–30 minutes after rats are removed from the smoking chamber. Blood nicotine levels in human smokers peak in the afternoon hours at 30–35 ng/mL (Benowitz, et.al., 1982). This also is somewhat lower than the mean morning levels of 44.7 ng/mL measured in plasma from our rats, suggesting that the regimen utilized in our model approximates that of a moderate to heavy human smoker.
Urine cotinine levels are used routinely in humans to measure cumulative smoke-exposure because cotinine is the primary breakdown product of nicotine and renal clearance of cotinine is much less variable than that of nicotine itself. Because rats normally concentrate their urine to a greater degree than humans (specific gravity = 1.04–1.07; Sharp and LaRegina, 1998) and urine concentration is dependent on blood EtOH levels, it is particularly important to calculate cotinine:creatinine ratios when attempting to compare smoke exposure in rats to that of humans. The mean cotinine:creatinine level determined for rats in our smoking model (5,466 μg/g) is comparable to the mean level of 6,815 μg/g reported in urine from humans smoking >20 cigarettes/day (deWeerd, et.al., 2002). It appears from these initial studies that EtOH ingestion did not significantly alter nicotine metabolism, but the duration and intensity of smoke exposure can be closely regulated in our model, making it adaptable for studying the impact of EtOH ingestion on nicotine metabolism and processing.
Like human smokers (Gordon, et.al., 1975; Wack and Rodin, 1982), smoke-exposed rats in this study consistently weighed less than their sham-exposed counterparts, weighing 10.3% less by the end of 6 weeks of exposure. This could not be explained solely by a reduction in calories needed for weight maintenance since both groups of rats ate equivalent amounts of chow relative to their body weights. In human smokers decreased weight has been attributed to possible alterations in calorie storage and/or an increase in metabolic rate (Wack and Rodin, 1982). Because it is so difficult to regulate and monitor food consumption in humans, animal models such as this one could be used to provide data on metabolic rates and the role EtOH ingestion plays in calorie usage and storage in smokers vs. non-smokers.
Weight loss during the first week of EtOH ingestion was similar to that reported in an earlier study (Rao, et.al. 1990), and the continuity of lower weights for the 36% EtOH group is consistent with what occurs in many human alcoholics with relatively poor nutrition. One of our major concerns about superimposing smoke exposure on ethanol ingestion was that the smoke-exposure could significantly reduce the amount of EtOH-containing diets the rats would eat. This could result in a corresponding decrease in blood EtOH levels that would preclude appropriate comparisons between smoke-exposed and sham-exposed rats eating the same diet. However, although smoke-exposed rats consistently consumed less volume of each of the liquid diets, the amount of EtOH consumed per day per 100 g of body weight was equivalent for smoke- and sham-exposed rats in each diet group. This was confirmed by comparable blood EtOH levels for smoke- and sham-exposed rats eating the same diet, and verifies that our model is suitable for the comparison of EtOH ingestion in smokers vs. non-smokers.
Although rats in the 36% and 26% diet groups took in similar amounts of EtOH in proportion to their body weight during their first week of EtOH feeding, blood EtOH levels were 3–4 times higher for those on the 36% diet. This was even more pronounced by the 5th week of ETOH consumption, and most rats eating the 16% diet had blood EtOH levels below the limit of detection at both time points. These results are in agreement with a study by Rao, et.al. (1994), in which Sprague-Dawley rats eating 24% and 12% EtOH liquid diets were found to have “insignificant” blood alcohol levels.
There was no indication of direct liver damage in any of the groups as assessed by AST and ALT. There were, however, alterations in liver function. It has been reported previously that chronic administration of EtOH to rats using the Lieber-DeCarli feeding model results in a decrease in liver-specific ASGP-R binding that was due partly to a 25–40% decrease in actual ASGP-R content (Tworek et.al., 1996). This was paralleled in the present study by an EtOH-induced decrease of 30% in ASGP-R levels for rats eating the 36% diet. Smoke exposure alone did not decrease ASGP-R levels, nor was the EtOH-induced decrease further intensified by smoke-exposure.
The effects of EtOH ingestion on the liver also were demonstrated by alterations in blood cholesterol levels. After 4 weeks on the Lieber-DeCarli diets, sham-exposed rats in all but the 16% diet group had total serum cholesterol values significantly higher than those for chow-fed control rats. This is likely due to the relatively high fat content (35%) of the liquid diets compared to the 12% fat calories in rat chow. This tendency for total cholesterol levels to increase with higher EtOH intake has been shown in some but not all human studies. What has been firmly established for humans is a positive correlation between increasing EtOH consumption and blood HDL levels (Choudhury, et.al., 1994; Savolainen, et.al., 1990; Seppä, et.al., 1992; Wannamethee and Shaper, 1992), which was replicated in our model by significantly elevated HDL levels for rats in the highest EtOH-containing diets.
Smoking in humans also affects serum cholesterol content, as decreases in total and/or HDL cholesterols have been correlated inversely with the number of cigarettes smoked per day (Choudhury, et.al., 1994; Van Antwerpen, et.al., 1995; Wannamethee and Shaper, 1992). This was mirrored by the decreases in total serum cholesterol for smoke-exposed vs. sham-exposed rats in most of the diet groups in this study. Moreover, mean HDL levels were somewhat lower for smoke-exposed than sham-exposed rats in all but the 36% diet group, an observation consistent with a human study in which smokers had lower HDL cholesterol levels than non-smokers at multiple levels of alcohol intake excluding those imbibing >42 drinks/week (Wannamethee and Shaper, 1992). The authors of that study stated, “Though smoking is reported to lower HDL cholesterol, the effect was not seen in heavy drinkers, suggesting that drinking is the more influential factor on HDL cholesterol”.
Concurrent smoking and drinking models may be used to determine the additive effects of smoking at a single pre-established EtOH concentration or in conjunction with several EtOH levels for examination of dose-related effects. Alternatively, the smoke concentration and/or exposure times can be adjusted to establish a dose-response effect of cigarette smoking at any level of EtOH ingestion. In this study, diets containing graded amounts of EtOH were included to demonstrate that smoke exposure may be superimposed on rat models of EtOH ingestion mimicking light to moderate to heavy drinking. Pair-fed controls were not included due to the physical limitation on the number of rats that could be smoke-exposed simultaneously. However, inclusion of pair-fed and chow-fed controls is necessary once the minimum or optimal concentration of dietary EtOH necessary to produce a given effect has been established. Only in this way can one determine the potential compounding effect of nutritional deprivation inherent in animal models that rely on ad libitum ingestion of EtOH-containing diets.
In summary, this manuscript describes a rat model that is both pertinent and appropriate for studying the separate and combined biomedical consequences of drinking and smoking. Inclusion of the effects of smoking provides an animal model that much more closely mimics conditions in the vast majority of alcoholics, making it useful for studying numerous health-related issues in drinkers who also smoke.
Acknowledgments
The authors wish to thank Jill Gerriets for her skilled technical assistance with many aspects of the project, as well as Stuart Wood, and Nicole Wiechman for smoke exposure of the rats.
Footnotes
This work was supported by NIH grant AA013434
References
- Ayers J, Ruff CF, Templer DI. Alcoholism, cigarette smoking, coffee drinking and extraversion. J Studies on Alcohol. 1976;37:983–985. doi: 10.15288/jsa.1976.37.983. [DOI] [PubMed] [Google Scholar]
- Bautista AP, Wang E. Chronic ethanol intoxication enhances the production of cytokine-induced neutrophil chemoattractant and macrophage inflammatory protein-2 by hepatocytes after human immunodeficiency virus-1 glycoprotein 120 vaccination. Alcohol. 2001;24:35–44. doi: 10.1016/s0741-8329(01)00140-9. [DOI] [PubMed] [Google Scholar]
- Benowitz NL, Kuyt F, Jacob P. Circadian blood nicotine concentrations during cigarette smoking. Clin Pharmacol Ther. 1982;32:758–764. doi: 10.1038/clpt.1982.233. [DOI] [PubMed] [Google Scholar]
- Bien TH, Burge R. Smoking and drinking: a review of the literature. Int J Addict. 1990;25:1429–1454. doi: 10.3109/10826089009056229. [DOI] [PubMed] [Google Scholar]
- Blot WJ. Alcohol and canc. Cancer Res. 1992;52:2119s–2123s. [PubMed] [Google Scholar]
- Cartwright A, Martin FM, Thomson JG. Distribution and development of smoking habits. Lancet. 1959;2:725–727. doi: 10.1016/s0140-6736(59)92149-x. [DOI] [PubMed] [Google Scholar]
- Casey CA, McVicker BL, Donohue TM, Jr, McFarland MA, Wiegert RL, Nanji AA. Liver asialoglycoprotein receptor levels correlate with severity of alcoholic liver damage in rats. J Appl Physiol. 2004;96:76–80. doi: 10.1152/japplphysiol.00375.2003. [DOI] [PubMed] [Google Scholar]
- Choudhury SR, Ueshima H, Kita Y, Kobayashi KM, Okayama A, Yamakawa M, Hirao Y, Ishikawa M, Miyoshi Y. Alcohol intake and serum lipids in a Japanese population. Int J Epidemiol. 1994;23:940–947. doi: 10.1093/ije/23.5.940. [DOI] [PubMed] [Google Scholar]
- Davis CC, Mellencamp MA, Preheim LC. A model of pneumococcal pneumonia in chronically intoxicated rats. J Infect Dis. 1991;163:799–805. doi: 10.1093/infdis/163.4.799. [DOI] [PubMed] [Google Scholar]
- deWeerd S, Thomas CMG, Kuster JETG, Cikot RJLM, Steegers EAP. Variation of serum and urine cotinine in passive and active smokers and applicability in preconceptional smoking cessation counseling. Environmental Res Section A. 2002;90:119–124. doi: 10.1006/enrs.2002.4395. [DOI] [PubMed] [Google Scholar]
- Finklea JF, Hasselblad V, Sandifer SH, Hammer DI, Lowrimore GR. Cigarette smoking and acute non-influenzal respiratory disease in military cadets. Am J Epidemiol. 1971;93:457–462. doi: 10.1093/oxfordjournals.aje.a121279. [DOI] [PubMed] [Google Scholar]
- Gairola CG. Pulmonary aryl hydrocarbon hydroxylase activity of mice, rats and guinea pigs following long term exposure to mainstream and sidestream cigarette smoke. Toxicology. 1987;45:177–184. doi: 10.1016/0300-483x(87)90103-x. [DOI] [PubMed] [Google Scholar]
- Gordon T, Kannel WB, Dawber TR, McGee D. Changes associated with quitting cigarette smoking: the Framingham Study. Am Heart J. 1975;90:322–328. doi: 10.1016/0002-8703(75)90320-8. [DOI] [PubMed] [Google Scholar]
- Griffith RB, Standafer S. Simultaneous mainstream-sidestream smoke exposure systems II. The rat exposure system. Toxicology. 1985;35:13–24. doi: 10.1016/0300-483x(85)90128-3. [DOI] [PubMed] [Google Scholar]
- Hartwig W, Werner J, Ryschich E, Mayer H, Schmidt J, Gebhard MM, Herfarth C, Klar E. Cigarette smoke enhances ethanol-induced pancreatic injury. Pancreas. 2000;21:272–278. doi: 10.1097/00006676-200010000-00009. [DOI] [PubMed] [Google Scholar]
- Hoffman WP, Daniel KN, van Lier RBL. Analysis of rodent growth data in toxicology studies. Toxicol Sci. 2002;66:313–319. doi: 10.1093/toxsci/66.2.313. [DOI] [PubMed] [Google Scholar]
- Howard LA, Micu AL, Sellers EM, Tyndale RF. Low doses of nicotine and ethanol induce CYP2E1 and Chlorzoxazone metabolism in rat liver. J Pharmacol Exp Ther. 2001;299:542–550. [PubMed] [Google Scholar]
- Hurt RD, Offord KP, Croghan IT, Gomez-Dahl L, Kottke TE, Morse RM, Melton LJ. Mortality following inpatient addictions treatment. Role of tobacco use in a community-based cohort. J Am Med Ass. 1996;275:1097–1103. doi: 10.1001/jama.275.14.1097. [DOI] [PubMed] [Google Scholar]
- Husain K, Scott BR, Reddy SK, Somani SM. Chronic ethanol and nicotine interaction on rat tissue antioxidant defense system. Alcohol. 2001;25:89–97. doi: 10.1016/s0741-8329(01)00176-8. [DOI] [PubMed] [Google Scholar]
- Lafolie P, Beck O, Blennow G, Boréus L, Elwin C-E, Karlsson L, Odelius G, Hjemdahl P. Importance of creatinine analyses of urine when screening for abused drugs. Clin Chem. 1991;37:1927–1931. [PubMed] [Google Scholar]
- Lieber CS, DeCarli LM, Sorrell MF. Experimental methods of ethanol administration. Hepatology. 1989;10:501–510. doi: 10.1002/hep.1840100417. [DOI] [PubMed] [Google Scholar]
- Lieber CS (1992) Medical and Nutritional Complications of Alcoholism Plenum Medical Book Company, New York.
- Lieber CS, DeCarli LM (1994) Animal models of chronic ethanol toxicity. Methods Enzymol 233:585–94:585–594. [DOI] [PubMed]
- National Institute on Alcohol Abuse and Alcoholism (1989) Alcohol and Tobacco. Alcohol Alert #39.
- Nelson S, Bagby GJ, Bainton BG, Summer WR. The effects of acute and chronic alcoholism on tumor necrosis factor and the inflammatory response. J Infect Dis. 1989;160:422–429. doi: 10.1093/infdis/160.3.422. [DOI] [PubMed] [Google Scholar]
- Nuorti JP, Butler JC, Farley MM, Harrison LH, McGeer A, Kolczak MS, Breiman RF, the Active Bacterial Core Surveillance Team Cigarette smoking and invasive pneumococcal disease. N Engl J Med. 2000;342:681–689. doi: 10.1056/NEJM200003093421002. [DOI] [PubMed] [Google Scholar]
- Osler W (1909) The Principals and Practice of Medicine D. Appleton and Company, New York.
- Patten CA, Martin JE, Owen N. Can psychiatric and chemical dependency treatment units be smoke free? J Subst Abuse Treat. 1996;13:107–118. doi: 10.1016/0740-5472(96)00040-2. [DOI] [PubMed] [Google Scholar]
- Poultney An inquiry into the effects of ardent spirits upon the human body and mind with an account of the means of preventing and of the remedies of curing them. Reprinted in 1943 by Rush B in Quart. J Studies Alcohol. 1786;4:321–341. [Google Scholar]
- Rao GA, Larkin EC, Derr RF. Nutritional Adequacy Versus Ethanol Toxicity in Chronic Alcoholic Rats: Is the 36% Ethanol Diet Model Nutritionally Adequate? Biochem. Archives. 1990;6:1–7. [Google Scholar]
- Rao VA, Sankaran H, Larkin EC, Rao GA. Interrelationship between anorexia, alcoholemia and diet adaptation during prolonged alcohol ingestion in rats. Biochem Archives. 1994;10:311–321. [Google Scholar]
- Seppa K, Sillanaukee P, Pitkajarvi T, Nikkila M, Koivula T. Moderate and heavy alcohol consumption have no favorable effect on lipid values. Arch Intern Med. 1992;152:297–300. doi: 10.1001/archinte.1992.00400140051012. [DOI] [PubMed] [Google Scholar]
- Sharp PE, LaRegina MC (1998) The Laboratory Rat CRC Press, New York.
- Snitily MU, Gentry MJ, Mellencamp MA, Preheim LC. A simple method for collection of blood from the rat foot. Lab Anim Sci. 1991;41:285–287. [PubMed] [Google Scholar]
- Sobell LC, Sobell MB, Kozlowski LT, Toneatto T. Alcohol or tobacco research versus alcohol and tobacco research. Br J Addict. 1990;85:263–269. doi: 10.1111/j.1360-0443.1990.tb03082.x. [DOI] [PubMed] [Google Scholar]
- Taylor AN, Tio DL, Heng NS, Yirmiya R. Alcohol consumption attenuates febrile responses to lipopolysaccharide and interleukin-1beta in male rats. Alcoholism: Clin Exp Res. 2002;26:44–52. [PubMed] [Google Scholar]
- Teague SV, Pinkerton KE, Goldsmith M, Gebremichael A, Chang S, Jenkins R, Moneyhum JH. Sidestream Cigarette Smoke Generation and Exposure System for Environmental Tobacco Smoke Studies. Inhalation Toxicol. 1994;6:79–93. [Google Scholar]
- Tworek BL, Tuma DJ, Casey CA. Decreased binding of asialoglycoproteins to hepatocytes from ethanol-fed rats: consequence of both impaired synthesis and inactivation of the asialoglycoprotein receptor. J Biol Chem. 1996;271:2531–2538. doi: 10.1074/jbc.271.5.2531. [DOI] [PubMed] [Google Scholar]
- U.S. Department of Health and Human Services (2000) Alcohol and Health 10th Special Report to the U.S. Congress. Publications Distribution Center, Rockville, MD.
- van Antwerpen VL, Theron AJ, Richards GA, Steenkamp KJ, van der Merwe CA, van der Walt R, Anderson R. Vitamin E, pulmonary functions and phagocyte-mediated oxidative stress in smokers and nonsmokers. Free Radical Biol & Med. 1995;18:935–941. doi: 10.1016/0891-5849(94)00225-9. [DOI] [PubMed] [Google Scholar]
- Wack JT, Rodin J. Smoking and its effects on body weight and the systems of caloric regulation. Am J Clin Nutr. 1982;35:366–380. doi: 10.1093/ajcn/35.2.366. [DOI] [PubMed] [Google Scholar]
- Wannamethee G, Shaper AG. Blood lipids: the relationship with alcohol intake, smoking, and body weight. J Epidemiol Community Health. 1992;46:197–202. doi: 10.1136/jech.46.3.197. [DOI] [PMC free article] [PubMed] [Google Scholar]
- Zacny JP (1990) Behavioral aspects of alcohol – tobacco interactions. In: Recent Dev in Alcoholism, vol. 8, (Galanter M, ed), pp 205–219. Plenum Press, New York. [PubMed]