

Abstract
Variability in nervous systems is often taken to be merely “noise.” Yet in some cases it may play a positive, active role in the production of behavior. The central pattern generator (CPG) that drives the consummatory feeding behaviors of Aplysia generates large, quasi-random variability in the parameters of the feeding motor programs from one cycle to the next; the variability then propagates through the firing patterns of the motor neurons to the contractions of the feeding muscles. We have proposed that, when the animal is faced with a new, imperfectly known feeding task in each cycle, the variability implements a trial-and-error search through the space of possible feeding movements. Although this strategy will not be successful in every cycle, over many cycles it may be the optimal strategy for feeding in an uncertain and changing environment. To play this role, however, the variability must actually appear in the feeding movements and, presumably, in the functional performance of the feeding behavior. Here we have tested this critical prediction. We have developed a technique to measure, in intact, freely feeding animals, the performance of Aplysia swallowing behavior, by continuously recording with a length transducer the movement of the seaweed strip being swallowed. Simultaneously, we have recorded with implanted electrodes activity at each of the internal levels, the CPG, motor neurons, and muscles, of the feeding neuromusculature. Statistical analysis of a large dataset of these recordings suggests that functional performance is not determined strongly by one or a few parameters of the internal activity, but weakly by many. Most importantly, the internal variability does emerge in the behavior and its functional performance. Even when the animal is swallowing a long, perfectly regular seaweed strip, remarkably, the length swallowed from cycle to cycle is extremely variable, as variable as the parameters of the activity of the CPG, motor neurons, and muscles.
Introduction
Nervous systems and the muscles through which they act to produce behavior are often variable or “noisy” in their operation. Traditionally, such variability has been viewed as a problem in the task of performing “reliable computation with unreliable components” (von Neumann 1956), to be solved by averaging, redundancy, and, more generally, degeneracy in the mapping from one level of the system to the next higher level, to achieve, finally, a predictable, reproducible behavior. There are, however, other proposals in which the variability is not merely a problem to be eliminated, but plays a positive, active role in the production of functional behavior. We continue here our study of such a role that variability might play in the feeding behavior of Aplysia.
Aplysia consummatory feeding behavior—biting, swallowing, and rejection of unsuitable food—is a cyclical, rhythmic behavior produced by a complex neuromuscular system: the contractions of numerous muscles in the animal’s feeding organ, the buccal mass, each controlled by the firing patterns of its individual motor neurons, all driven ultimately by feeding motor programs generated by a multitasking central pattern generator (CPG) in the buccal ganglia (Kupfermann 1974; reviewed by Kupfermann et al. 1997; Elliott and Susswein 2002). Traditionally, the behavior has been thought of as stereotyped. Yet we have recently found that essentially all of the basic parameters of the cycling of the CPG, motor neuron firing, and contractions of the individual muscles (Horn et al. 2004; Zhurov et al. 2004, 2005a), as well as higher-level parameters of the coordination between entire motor neuron-muscle subsystems within the feeding neuromusculature (Zhurov et al. 2005b), are extremely variable from one cycle of the behavior to the next. Remarkably, this is so even when the stimulation that elicits each cycle, or, in functional terms, the functional task or functional goal of the behavior, is the same in each cycle.
There are several possible scenarios of the consequences of this variability for the production of functional behavior (see Horn et al. 2004; Zhurov et al. 2005b). These scenarios can be distinguished, however, by one critical, experimentally testable question. Does the variability that is observed within the neuromuscular system appear in the functional performance of the behavior? In other words, when evaluated in terms of their satisfaction of the functional goal of the behavior, do all cycles of the behavior achieve equally good performance, or are there some cycles that are good, but some that are less good, and some, perhaps, that are not functional at all? It could be that the variability that is observed in the neuromusculature is indeed eliminated already internally, by complementary relationships among the neuromuscular components—by a degeneracy or multiple degrees of freedom (Bernstein 1967; Beer et al. 1999) in the mapping of, for instance, individual muscle contractions to overall movements. Degeneracy at this level may indeed exist in the Aplysia buccal neuromusculature (see, e.g., Drushel et al. 1997, 1998; Neustadter et al. 2002a,b). There could also be degeneracy at the next higher level, in the mapping of the movements to functional performance, so that, even if variable movements are produced, in terms of functional performance they are all equally good. In either case, the same behavior—stereotyped perhaps even in the actual physical movements, but more importantly in their functional significance—is produced in each cycle. In either case the scenario is of the traditional kind. If, on the other hand, the variability does emerge in the functional performance of the behavior, then we must think about the organization and operation of the neuromuscular system in an entirely different way. We have proposed that the variability is permitted to exist, and may even be actively generated by the CPG (Horn et al. 2004), because it serves a higher-order functional purpose. When the animal is faced with a new and only imperfectly known feeding task in each cycle, the variability implements a trial-and-error search through the space of possible feeding movements, a strategy that clearly will not be successful in every individual cycle, but on average, over many cycles, may in fact be the animal’s optimal strategy in an uncertain and changing feeding environment (Horn et al. 2004; Brezina et al. 2005a; Zhurov et al. 2005b; see Discussion).
It is thus necessary to measure, in intact, freely feeding animals, the functional performance of the feeding behavior. The work documenting the neuromuscular variability was either done in vitro (Horn et al. 2004; Zhurov et al. 2004, 2005a,b), with the components of the neuromusculature partially disassembled and stimulated in ways that may not reproduce the full stimulus set experienced by the intact feeding animal, or, when neuromuscular activity was monitored in intact animals with chronically implanted electrodes (Horn et al. 2004), there was no measurement of function. In vitro, it is difficult to measure function because it is not clear how function is to be evaluated for an isolated component of the neuromuscular system such as an individual muscle. In intact animals, however, a reasonably self-evident measure of function offers itself, for an ingestive feeding behavior such as swallowing, for example, in the form of the amount of food actually ingested at any point in time. At least two previous studies (Hurwitz and Susswein 1992; Kabotyanski et al. 2000) have used such a measure of performance, but in each case they reported only the average performance over many cycles, not the performance in each individual cycle. What distinguishes the different scenarios of the organization of the neuromuscular system, however, is not their average performance—they all predict good average performance, as they must do to be plausible at all—but their different predictions of the distribution of the performance over successive cycles. The proposed trial-and-error feeding strategy, too, predicts performance that is good, indeed optimal, on average, but highly variable from cycle to cycle. The trial-and-error strategy, if it is to be considered as a reasonable explanation of how the system operates, in fact requires the variability to emerge in the behavior as an essential part of its mechanism of action. As a critical test of these various theories, therefore, in this paper we measure and statistically analyze the feeding performance of intact Aplysia on a cycle-by-cycle basis. Since we simultaneously monitor CPG, motor neuron, and muscle activity with implanted electrodes, we can furthermore begin to directly correlate the variability at the two levels, the variability in the activity of the neuromuscular system and its functional consequences.
Methods
Surgery
In this work we used Aplysia californica weighing 100–300 g obtained from Marinus Scientific (Garden Grove, CA). Each animal was implanted with two wire electrodes for simultaneous chronic recording from buccal nerve 2 and the accessory radula closer (ARC, or I5) muscle, using techniques based on those used in a number of previous studies (e.g., Cropper et al. 1990a,b; Morton and Chiel 1993a,b; Hurwitz et al. 1996; Horn and Kupfermann 2002; Horn et al. 2004). Briefly, the animal was anesthetized by injection of chilled isotonic MgCl2, placed in a bath of chilled seawater on an incline to minimize the escape of hemolymph, and a ~1 cm-long access incision was opened in the body wall on the left side of the head. Each wire electrode consisted of a strand of ultra-fine Teflon-insulated stainless steel wire (0.002-inch bare, 0.0045-inch insulated; AM Systems, Carlsborg, WA) from which the insulation had been stripped at the very tip. The two wires were pierced separately through the body wall near the access incision and loosely knotted inside the body, leaving free ends of 1–2 cm beyond the knot. An incision was made through the I2 muscle into the buccal mass to expose the ARC muscle. The deinsulated tip of one of the wires was inserted into the ARC muscle and glued in place with Instant Super Glue (ND Industries, Troy, MI). The incision in the I2 muscle was then sutured closed. The tip of the other wire was coiled around one of the buccal nerves 2 and similarly glued in place. The knot on the wires was used as an attachment point for a suture with which the knot was anchored to the body wall, so that the wires would not be pulled out by the movements of the animal. The access incision in the body wall was then sutured closed. The surgery generally lasted 45–60 min.
After surgery, the animals were returned to individual cages inside a large seawater tank maintained at ~15°C. The two wires emerging from the body were fastened to a polystyrene float to keep them out of the way of the movements of the animal. Animals generally recovered from the surgery (as determined by their readiness to feed) by the next day.
Experiments
Most recordings analyzed here were obtained from animals 1–3 days after surgery, but in some cases up to 13 days. Animals were selected for recording each day based on their readiness to feed, tested with small samples of seaweed. Each animal was recorded from, as described below, while ingesting standard strips of seaweed, repeatedly until it showed signs of satiation or rejection. It might then be recorded from again on a subsequent day, but not until it had become ready to feed again, usually after one or more interposed days of rest.
For recording, the animal was transferred to a ~3-liter rectangular glass or plastic tank filled with seawater. We made no attempt to restrain the animal in any particular position in the tank because during the recording most animals spontaneously assumed a relatively immobile posture with their body extended at the surface of the water (see Results). The recording apparatus was prepared as follows. A standard length transducer (Model 60-3000, Harvard Apparatus, Holliston, MA) was mounted so that its arm, a lightweight 30-cm-long metal rod, extended horizontally. To its end was attached, with a short piece of string, the end of one of the seaweed strips; the strip therefore hung from the arm vertically. A small test piece of seaweed held in forceps, or in some experiments seaweed extract (seaweed soaked in seawater, mashed, and filtered) added to the tank, was used to stimulate the animal to orient itself into the feeding posture, with its mouth upward, and begin rhythmic biting, although not yet able to grasp any food. The freely hanging end of the seaweed strip was then lowered, by moving the entire length transducer unit downward on its mounting rod, until the end of the strip touched the animal’s mouth. The animal grasped the strip and began to swallow it. As it progressively pulled the strip into its mouth, this pulled down the transducer arm and recorded the movement. [The same basic approach was used in the previous studies of Hurwitz and Susswein (1992) and Kabotyanski et al. (2000).]
At the very beginning, the strip was sometimes slack and not transmitting its movement fully to the transducer. For this and other reasons (see Results), we excluded the first several cycles of swallowing of each strip from our analysis (see below). After one or more cycles, however, the strip came under full tension. The transducer arm was counterweighted at the other end, with small, known weights fixed at a measured distance from the transducer fulcrum, to maintain the tension at an adequate level, but not so high that the animal would have to pull against an excessive load. Calibration with test weights and calculation of the loads involved showed that the animals were pulling against nominal forces of 0.06–1.7 g, in most experiments at the low end of this range. In several experiments, however, we systematically varied the load, up to 1.7 g, to test its effect. Relative to the large variability that we saw in the swallowing of identical, identically-loaded strips by different animals or even in succession by the same animal, we saw no obvious systematic effect of the varying load and consequently the results over the entire range of loads have been pooled. [Working with Aplysia oculifera, Hurwitz and Susswein (1992) found an effect already in the range up to 1 g, but their animals were 1–2 orders of magnitude smaller than our animals here.] Before the animal grasped the strip, the counterweighting of the transducer arm cocked the arm upward, against the stop at the upper end of its range of travel (e.g., in Fig. 1A at “c”; we always quantified the movement of the strip in terms of the length already swallowed, rather than the length remaining, so inverting our plots of raw strip position or movement). As the animal swallowed the strip, the arm moved down and eventually reached the stop at the lower end of its travel (at “d” in Fig. 1A). At this point the resistance to further ingestion of the strip became effectively infinite, and, after a variable period of time, the animal broke or cut the strip (at “e” in Fig. 1A). The dimensions of the apparatus were such that this usually happened after the animal had swallowed 12–14 cm of the standard 15-cm strip. Occasionally the strip broke or was cut by the animal when only partly ingested. After an interval, usually of 1–2 min but in some experiments up to 7 min (no obvious difference was observed), another strip was offered to the animal in the same way (see, e.g., Fig. 9). This continued until the animal showed signs of satiation or rejection, most evident in whole-body turning away from the offered strip. The number of strips ingested by the animal in the recording session ranged from 1 to 11; animals being recorded from for the first time since surgery usually ingested at least 6 strips.
Figure 1.
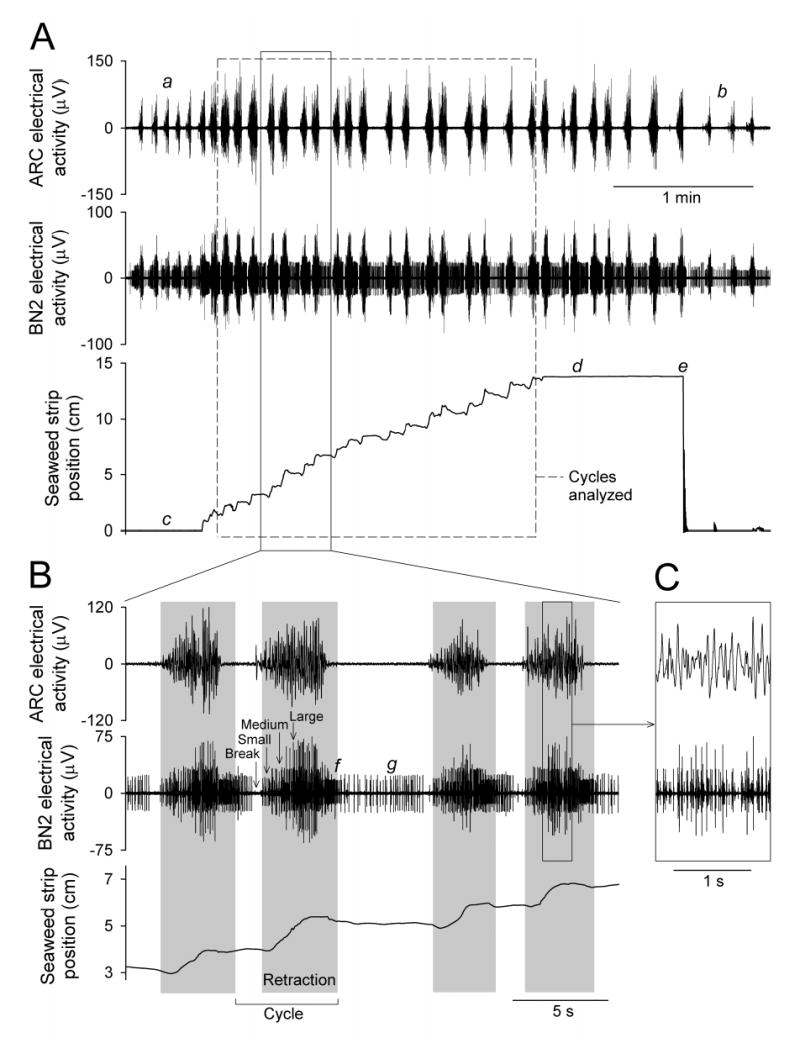
Typical records obtained during the swallowing of a standard 1 × 15 cm seaweed strip. A shows (top to bottom) the electrical activity in the ARC muscle, the electrical activity in buccal nerve 2 (BN2), and the position of the strip measured with the length transducer, for the entire strip; B and C show successive expansions of the indicated portions of the records. The dashed box in A encloses the sequence of cycles selected for analysis from this strip by the criteria described in Methods. The grey rectangles in B mark the durations of the retraction phases determined from the bursts of electrical activity in buccal nerve 2 as described in Methods. The labels “Small”, “Medium”, and “Large” indicate the three classes of spikes, with small, medium, and large amplitudes, used in this determination (see Methods). The other labels in the figure indicate other features referred to in the Methods and Results. The buccal nerve 2 record in B and C has been additionally filtered in software with an 8-pole Bessel high-pass filter with a −3 dB cutoff frequency of 100 Hz.
Figure 9.
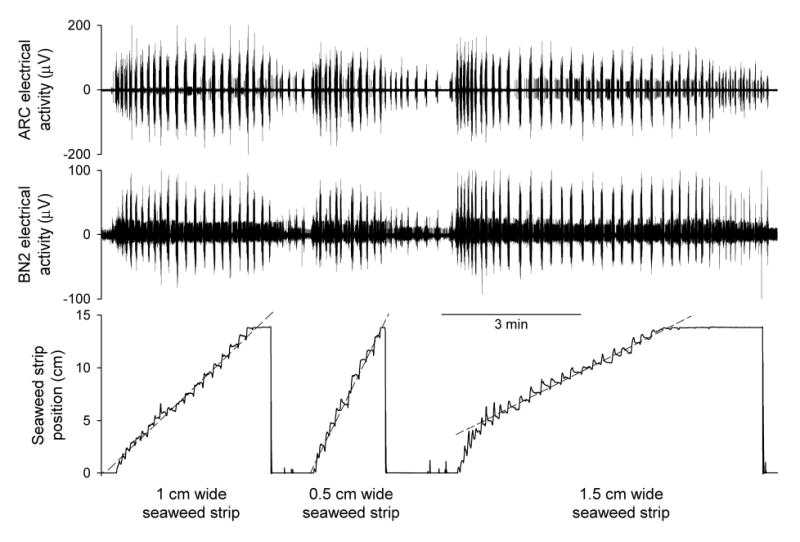
Seaweed strips of different widths are ingested at different average rates, but in all cases with large variability. The dashed lines indicating the average rates of movement of the seaweed strip were drawn by eye. Otherwise as in Fig. 1.
The seaweed used was locally purchased roasted green seaweed (Tokyo Sushihane, imported by Shirako Co., Tokyo, Japan), normally used to make sushi, which the animals consumed readily. Sheets of the seaweed were cut into regular strips 15 cm long, 1 cm wide. In a few experiments different strip widths, of 0.5, 1, 1.5, and 2 cm, were tested. The width clearly did make a difference (see Results and Fig. 9). For the purposes of collecting a large, internally consistent dataset, we selected the 1 cm width as our standard width; most strips used were of this width and only those strips were included in the analysis. However, specific examples of the results with the other widths are shown in Figs. 7A and 9.
Figure 7.
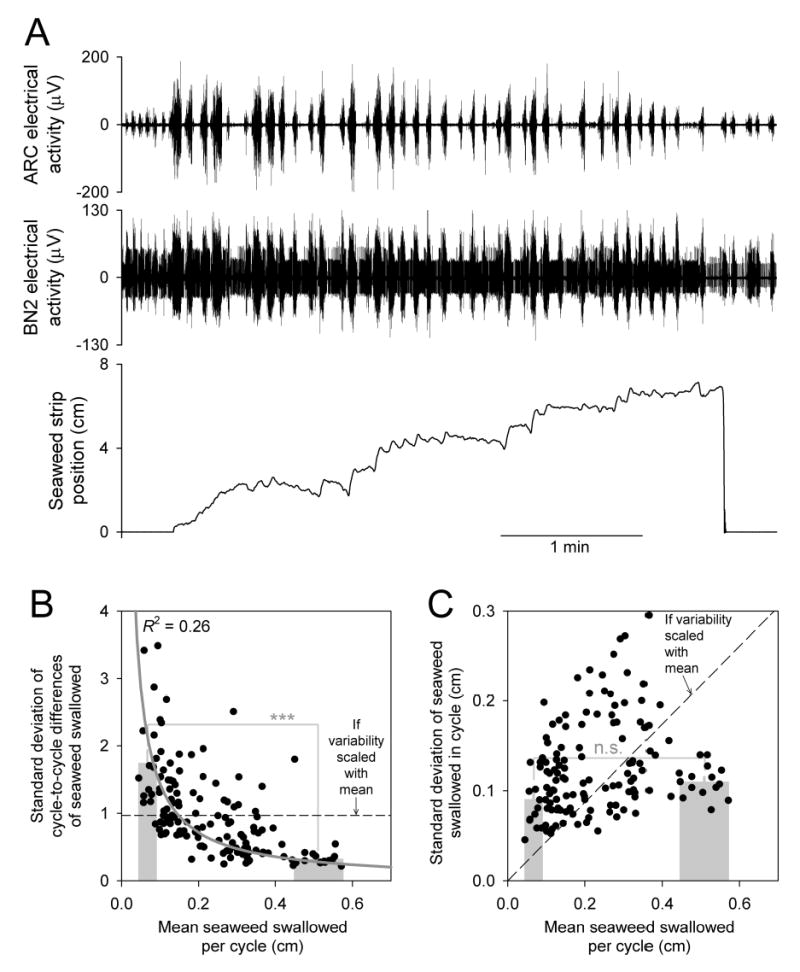
Relationship of variability to overall functional success: variability of the movement of the seaweed strip related to the mean movement. A: example of a seaweed strip swallowed with particularly large variability in the records of buccal nerve 2 and ARC electrical activity as well as in the movement of the strip. The mean movement per cycle was also small; the animal may have had difficulty swallowing the strip (note that the strip broke or was cut when only partly ingested), possibly exacerbated by the fact that this strip was 1.5 cm, rather than the standard 1 cm, wide. However, similarly large variability was seen with some 1-cm strips (see, e.g., B and C), and, conversely, smaller variability with other 1.5-cm strips. Otherwise as in Fig. 1. B: plot of the standard deviation of the cycle-to-cycle differences of the seaweed swallowed, σ (as in Fig. 4B5 but computed separately for each strip), as a function of the mean seaweed swallowed per cycle, μ, for each of the 143 strips (black points) in the dataset. (The dataset included only 1-cm strips; thus the strip in A was not included.) The grey curve is the best fit, with R2 = 0.26, of the equation σ = k/μ, where k is a parameter of the fit. The superimposed bar graph plots the mean ± SE of σ of the 14 strips (~10% of the dataset) with the smallest μ and of the 14 strips with the largest μ. The width of each bar spans the range of μ of the strips included in it. For statistical analysis see Methods and How does the variability relate to overall functional success? in Results. C: as in B, but plotting the standard deviation of the absolute lengths of the seaweed swallowed (i.e., of the distribution in Fig. 4A5 but computed separately for each strip) as a function of μ.
The electrical signals from buccal nerve 2 and the ARC muscle were recorded with a Differential AC Amplifier Model 1700 (AM Systems). The signals were recorded differentially, against reference electrodes which were simply wires inserted into the water near the animal. The signals were low-pass filtered at 1 kHz and high-pass filtered at 10 Hz, then, together with the signal from the length transducer, sampled at 5 kHz using Digidata 1322A data-acquisition hardware and pCLAMP 8/9 software (Axon Instruments, Union City, CA). In some experiments the feeding animal was also videotaped (see below).
The temperature of the seawater in the recording tank was usually 17.5–19.5°C, but in some experiments as low as 16°C or as high as 24°C. We saw no obvious systematic effect of temperature and the results at all temperatures have been pooled.
Some animals were dissected after the recording session to confirm that the implanted electrodes were still in place. This was almost always the case with recently implanted electrodes. In animals that had gone 2 weeks or longer since the surgery, however, there was often a problem which, in fact, was first evident in the electrical recordings. Normal recordings from buccal nerve 2 showed several distinct classes of rapid spikes (see below), but in the older animals the rapid spikes often disappeared and were replaced by slower, smoother waves of activity, like those normally recorded from the ARC muscle (the difference between the rapid spikes and the slow waves is clear, for example, in Fig. 1C), which therefore too were probably a reflection of the adjacent buccal muscle activity. (Even normal recordings with robust rapid spikes often showed some underlying slow-wave activity, which if necessary could be selectively removed by additional high-pass filtering, as it was in Fig. 1, B and C.) Dissection of these animals revealed that—although the animals remained outwardly healthy and continued to feed—buccal nerve 2 had been damaged or had disintegrated entirely under the glue layer holding the implanted wire in place. Recordings with predominant slow-wave activity in buccal nerve 2 were therefore discarded, and, once this problem was apparent, animals were generally not kept longer than 2 weeks after surgery.
Analysis of electrical and length-transducer signals
The basic unit of analysis was the seaweed strip, which was then divided into the successive individual cycles with which the animal had swallowed it. This division was based, in the first instance, entirely on the electrical record from buccal nerve 2; the other signals did not enter the analysis until later. The record of buccal nerve 2 activity was analyzed based on the identification of a certain pattern of electrical activity within it as a marker of the radula-retraction phase of the feeding motor program, a criterion established by Morton and Chiel (1993a,b) and subsequently used in many other studies (e.g., Hurwitz et al. 1996; Susswein et al. 1996; Nargeot et al. 1997, 1999; Kabotyanski et al. 2000; Morgan et al. 2000; Proekt and Weiss 2003; Wu et al. 2003; Dembrow et al. 2004; Due et al. 2004; Proekt et al. 2004). To recognize this pattern of electrical activity, we followed essentially the same procedure, except implemented in software rather than hardware, as did Morton and Chiel (1993a). First, the threshold event detection module of Clampfit 9 (Axon Instruments) was used to automatically tabulate all spike times and amplitudes in the buccal nerve 2 record. As found by Morton and Chiel, the record almost always contained three distinct classes of spikes, of small, medium, and large amplitude (labeled “Small,” “Medium,” and “Large” in Fig. 1B; Morton and Chiel described all three as “large-unit” classes because there were still other classes of truly small spikes, which both Morton and Chiel and we ignored). The few recordings in which the classes were not clearly distinguishable were excluded from the analysis. The threshold amplitudes separating the classes generally differed between recordings from different animals, and were determined in each case by inspection. Separately for each class, the spike times were converted to instantaneous firing frequency functions, assigning to each timepoint in an interspike interval the reciprocal of the duration of that interspike interval. This and all further processing was done in Mathematica (Wolfram Research, Champaign, IL). As found by Morton and Chiel, the retraction phase of each motor program was identifiable by a distinct, often indeed very intense, burst of firing, that is, a large increase in firing frequency, generally of all three spike classes (see Figs. 1, 7A, 9). The precise times when each burst began and ended—then taken to be the times when the retraction phase began and ended—were determined by a semi-automated but supervised algorithm implemented in Mathematica. Proceeding along the three instantaneous firing frequency functions, fsmall(t), fmedium(t), and flarge(t), extracted from the buccal nerve 2 record over the duration of each strip, this algorithm identified each successive burst, first, by flarge(t) rising, from nearly zero between the bursts, above a threshold value, v1, usually set at 1 Hz. The algorithm then worked backward from this time to the last time that the product fsmall(t) × fmedium(t) had been lower than another threshold value, v2, usually 5 Hz2. (The values of v1 and v2 were sometimes adjusted if a particular recording had unusually high or low firing frequencies. Also, if the instantaneous firing frequency functions were very irregular, they were sometimes smoothed for more robust results.) The algorithm also worked forward to the first time at which both flarge(t) had fallen again below v1 and fsmall(t) × fmedium(t) had fallen below v2. In most cases, this algorithm correctly set the beginning of the burst to just after the distinct pause or break in firing, which preceded many bursts (e.g., “Break” in Fig. 1B), that Morton and Chiel identified as a suitable marker of the beginning of the retraction-phase firing, and set the end of the burst to include not merely the burst of large spikes but also most of the following distinctive tail of intense medium- and small-spike firing (“f” in Fig. 1B), but at the same time excluded the low-frequency regular firing of the medium and small spikes that sometimes proceeded throughout the interburst interval (“g” in Fig. 1B). The algorithm thus demarcated the bursts essentially as they are generally demarcated by eye (e.g., in the references at the beginning of this section). Because the bursts were very variable, however, occasionally the algorithm failed completely, especially with bursts that contained only sporadic or no large spikes. More complex algorithms tried in these cases were somewhat more successful, but in the end we preferred to retain the simple algorithm but to supervise it, confirming its suggested demarcation of each burst or, if necessary, manually correcting any obvious mistakes. If excessive correction was required, the entire strip was excluded from the analysis.
This initial analysis yielded a series of retraction phases (e.g., grey rectangles in Fig. 1B)—more exactly, retraction phases as operationally defined just from the electrical activity (see Results)—of the successive motor programs used to ingest each seaweed strip. Each of the intervals between the retraction phases was therefore the sum of the radula-protraction phase of the motor program and the interprogram interval. A “cycle” was taken to be the sum of a retraction phase and the preceding inter-retraction interval (see Fig. 1B).
Next, we excluded from the analysis any cycle during any part of which the seaweed strip was not under the correct tension, that is, any cycle during which the transducer arm made contact with the stop either at the bottom or at the top of its range of travel. This excluded several cycles at the beginning of many strips; in any case, we always excluded at least the first two cycles (see Results). This criterion also excluded a variable, sometimes quite large (e.g., Fig. 9, 1.5 cm strip), number of cycles at the end of each strip, when the animal had already ingested as much of the strip as it could pull down but before it broke or cut the strip. If there were any cycles that were not themselves excluded by this criterion but were separated by an excluded cycle from the main sequence of included cycles, they too were excluded, so that what was included in the analysis was just a single sequence of contiguous cycles (e.g., in Fig. 1A within the dashed box) comprising the bulk of each strip. Strips that broke when only partly ingested were included in the analysis provided at least 5 cycles, after those excluded at the beginning, had been recorded. The sequence analyzed from completely ingested strips always had more cycles than this.
Finally, only those strips were included for which there was throughout a clear, uncorrupted, relatively noise-free recording of each of the three channels: the electrical activity in buccal nerve 2, the electrical activity in the ARC muscle, and the movement of the strip. Altogether, these various criteria yielded a dataset of 2,755 cycles from 143 strips ingested by 26 animals for further analysis in this paper.
All further analysis operated on retraction- or cycle-length segments of various instantaneous functions derived from the three channels of recording: the instantaneous firing frequency functions of the three spike classes in buccal nerve 2 or the similarly constructed function of all of the spikes combined, the instantaneous frequency function of all of the peaks, above a certain minimal threshold, in the ARC muscle record (see Results), and the instantaneous position of the seaweed strip. In each cycle as defined by the analysis of the buccal nerve 2 bursts, the corresponding segments of these functions, either just over the retraction phase or over the entire cycle, were cut, if necessary aligned at the beginning of the buccal nerve 2 burst, that is, the beginning of retraction, and analyzed either individually or in relation to each other. Several different ways to visualize the variability in the dataset were used, as described further in Results and in the relevant figure legends.
Video analysis
In some experiments the feeding animal was continuously videotaped with a Sony DCRTRV950 Digital Video Camera Recorder mounted on a tripod. Several different camera angles were used, but in one series of experiments the animal was systematically videotaped through the side of the recording tank parallel to the surface of the water, that is, orthogonally to the movement of the seaweed strip (see the second video segment at http://fulcrum.physbio.mssm.edu/~seaslug/Seaweed.html, and the frame taken from this segment in Fig. 2B). These side-view videos were then analyzed to compare the movement of the head of the animal to the movement of the seaweed strip recorded with the length transducer. Videos were speeded up 16-fold—that is, frames were extracted every 533 ms from the original video and assembled into a new video—using Vegas 5 (Sony Pictures Digital). If necessary the light level was adjusted and contrast was enhanced at the same time. Logger Pro 3 (Vernier Software & Technology) was then used to step through the frames of the new video while marking with the mouse cursor the location of some precisely identifiable feature—skin fold or spot—on the animal’s head in each frame. If, as occasionally happened, that feature disappeared from view, a new feature was selected and followed. The time series of the vertical coordinates of the feature was then synchronized with the transducer record of the movement of the seaweed strip (see, e.g., Fig. 2C) by aligning the moment at which the strip broke or was cut by the animal, a quasi-instantaneous event that could be precisely located in a particular frame of the video as well as in the transducer record (e.g., at “e” in Fig. 1A). The vertical scale of the video was calibrated by equating the size of the movements of the strip visible in the video to their size in centimeters in the transducer record.
Figure 2.

Strip movements are movements of the buccal mass, not of the whole body. A and B: two video frames (from two different experiments) taken from the video segments at http://fulcrum.physbio.mssm.edu/~seaslug/Seaweed.html. C: position of the seaweed strip recorded with the length transducer, over the middle sequence of analyzed cycles, as in the dashed box in Fig. 1A, of a typical strip, and a simultaneous record of the vertical position of a skin feature on the animal’s head analyzed from the frames of a side-view video recording such as that in B (see Methods). The vertical offset of the head-position record is arbitrary. D: group data comparing strip and head movement. Video frames were analyzed every 533 ms, and the vertical movement of the head was computed from the difference in vertical position of the tracked feature between successive frames (the results were essentially identical if the difference was computed over longer intervals, i.e., multiple frame increments). The strip movement was then computed from the transducer record over the same times in exactly the same way. Plotted are 2,984 such (strip movement, head movement) pairs (i.e., spanning ~26 min) computed from 241 swallowing cycles in 5 strips. Multiple linear regression (see Methods) found no correlation between the strip and head movement (R2 < 0.01).
Statistical analysis
Statistical analysis was performed in Mathematica or SigmaPlot (Systat Software, Point Richmond, CA).
Multiple linear regression
To evaluate the correlation of one or more “independent” data parameters x1, x2, ..., xk with a “dependent” parameter y, we used multiple linear regression to find the least-squares fit of a regression model that included each independent parameter up to the third power. With just one independent parameter x (Figs. 2D, 5, 6, 8A), the regression model was thus
Figure 5.
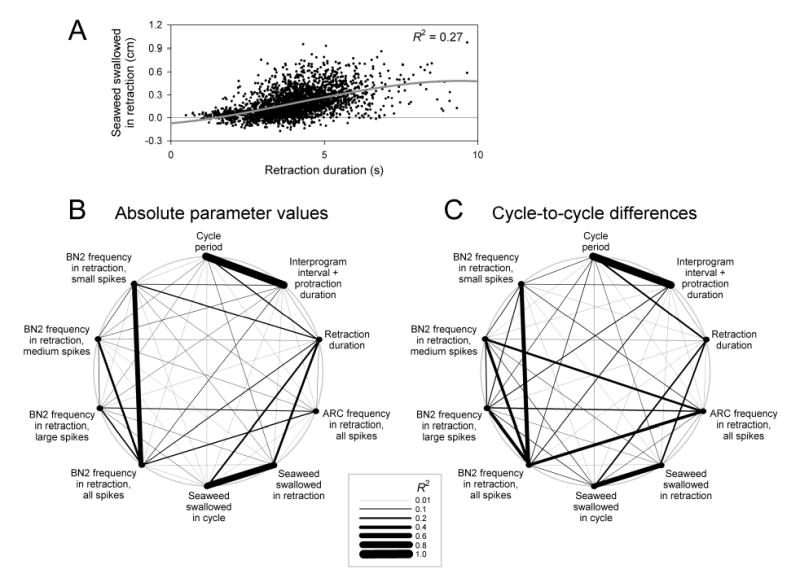
Correlations between parameters of the buccal nerve 2 and ARC electrical activity and movement of the seaweed strip. The five parameters in Fig. 4 were used and in addition the following five parameters: the duration of the protraction and interprogram interval preceding the retraction in each cycle, the mean frequencies of the three separate classes of spikes, with small, medium, and large amplitudes, in buccal nerve 2 (BN2), and the length of seaweed swallowed in retraction. The values of these ten parameters, drawn from all cycles in the dataset (n = 2,755), were correlated pairwise, using multiple linear regression to fit the values of the dependent parameter with a cubic polynomial model of the independent parameter (see Methods). A shows one such correlation plot; the best cubic polynomial fit is shown (grey curve) and the value of the coefficient of determination, R2, is given. B then shows the strengths of the correlations—the values of R2, represented by the thickness of each line—between the absolute values of all ten parameters, and C between the corresponding cycle-to-cycle differences. Of the two reciprocal correlations between each pair of parameters, the stronger correlation is represented; however, the two were generally not very different (see Fig. 6).
Figure 6.

Correlations between parameters of the buccal nerve 2 and ARC electrical activity and movement of the seaweed strip: numerical results for the correlations between the cycle-to-cycle differences of the ten parameters plotted in Fig. 5C. Each cell gives R2 (top number), the p value (middle number), and Cohen’s d (bottom number) for the correlation between the independent (row) and dependent (column) parameter, computed as described in Methods. The p values were in each case drawn from the F3,2608 distribution. For further explanation see Functional performance is not explained by any single parameter of CPG or neuromuscular activity in Results.
Figure 8.
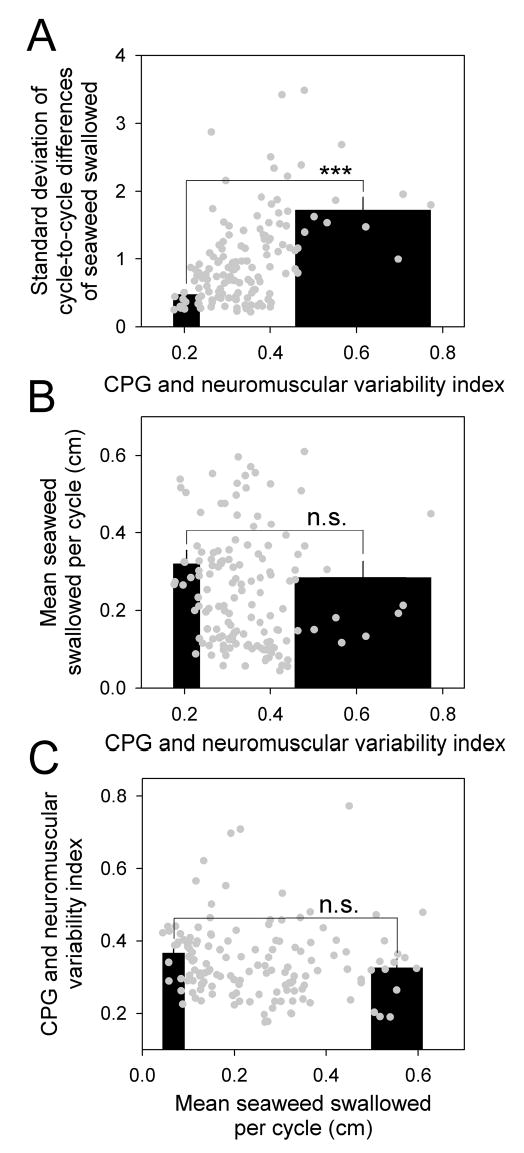
Relationship of variability to overall functional success: variability of CPG and neuromuscular activity related to the variability and mean movement of the seaweed strip. The “CPG and neuromuscular variability index” was computed, for each strip, as the sixth root of the product of the standard deviations of the cycle-to-cycle differences of the six independent parameters of CPG and neuromuscular activity that were measured in Figs. 4 and 5: the retraction duration, the interprogram interval and protraction duration, the frequencies of the three separate classes of spikes in buccal nerve 2, and the ARC spike frequency. A: standard deviation of the cycle-to-cycle differences of the seaweed swallowed as a function of the variability index, for each of the 143 strips in the dataset (grey points), and statistical analysis as in Fig. 7, B and C. The best-fit cubic curve (not shown) through the points had R2 = 0.29. B: mean seaweed swallowed per cycle as a function of the variability index. C: variability index as a function of the mean seaweed swallowed per cycle.
| (1) |
where β0 … β3 are the regression coefficients, ɛ is the residual error, and i = 1, 2, ..., n is the index of the successive points in the dataset. The best fit was then given by
| (2) |
with estimates that minimized the error sum of squares, SS(Error), or equivalently maximized the model sum of squares, SS(Model), in the relation
| (3) |
defined term by term as
| (4) |
where is the mean y.
To evaluate the statistical significance of the correlation with one independent parameter, we tested the null hypothesis H0: β1 = β2 = β3 = 0 by computing the statistic
| (5) |
where j = 3, and drawing the corresponding p value from the F3,n−j−1 distribution. When simultaneously classifying the significance of N correlations (e.g., 90 in Fig. 6) with respect to significance criterion α, we used the simple Bonferroni correction for multiple comparisons (Shaffer 1995), reducing the criterion for each individual correlation to α/N (thus in Fig. 6 to 0.05/90 = 0.00056).
As a measure of the strength of the correlation with one independent parameter, we used the coefficient of determination adjusted for positive bias,
| (6) |
(With very large n in all cases, the adjustment for bias was very small.) To convert R2 further into a standard measure of effect magnitude, Cohen’s d (Cohen 1992; Olejnik and Algina 2000), we used the formula (Friedman 1968)
| (7) |
To evaluate the correlation of k independent parameters with the dependent parameter, the regression model in Eq. 1 was expanded to
| (8) |
with corresponding modifications, where required, in Eqs. 2–7; in particular, with j = 3k in Eqs. 5 and 6. As described in Results, we used the regression with multiple independent parameters primarily to compute the partial (conditional) correlation with the dependent parameter of one of the independent parameters in the presence of all of the others. To compute the partial correlation of parameter k with the dependent parameter, for example, the full regression model in Eq. 8 was contrasted with the smaller model without parameter k,
| (9) |
Subtraction of SS(Model x1…xk−1) given by the smaller model from SS(Model x1…xk) given by the full model yielded the conditional sum of squares SS(Model xk| x1…xk−1) , which was then passed, with the SS(Error) remaining after fitting the full model, through Eqs. 5–7 with j = 3.
Contrast between groups
To evaluate the statistical significance of a contrast between a group of n values x1, x2, …, xn, with mean and standard deviation σx, and a group of m values y1, y2, …, ym, with mean and standard deviation σy, we used a standard two-tailed t-test with n + m − 2 degrees of freedom. In Figs. 7, B and C, and 8, “***” indicates p < 0.001 and “n.s.” indicates p > 0.05. To evaluate the magnitude of the contrast, we computed Cohen’s d using the formula (Olejnik and Algina 2000)
| (10) |
Results
Experimental design and basic results
All experiments in this paper were done with animals that had been chronically implanted with two wire electrodes to record electrical activity. One wire was implanted on buccal nerve 2, a nerve whose spike pattern is widely used to identify the radula-retraction phase of the feeding motor programs (Morton and Chiel 1993a; see Methods). The other wire was implanted in the accessory radula closer (ARC) muscle (Cohen et al. 1978), an extensively studied, representative buccal-mass muscle. Animals generally recovered from the brief surgery to implant the wires by the next day, when they were ready to feed. They remained apparently healthy and were used in experiments over many days in some cases. The feeding behavior and all other behaviors observed appeared quite normal.
To measure the performance of the feeding behavior, we hung vertically down from above the animal a strip of seaweed, of a type which the animals consumed readily, from a length transducer counterweighted with a light load. As the animal pulled down and swallowed, spaghetti-like in progressive small increments, the strip of seaweed, the transducer continuously recorded the position, and hence the movement, of the strip. Two short video segments of these movements can be seen at http://fulcrum.physbio.mssm.edu/~seaslug/Seaweed.html; one frame from each segment is shown in Fig. 2, A and B. The three simultaneous recordings, of the electrical activity in buccal nerve 2, the electrical activity in the ARC muscle, and the movement of the strip, obtained during the swallowing of a typical strip are shown in Fig. 1.
Although the animal was perfectly free to decide when and how to take each successive swallow, in some important respect this was not a completely unstructured free-feeding situation. In particular, the seaweed strip was of a controlled, regular size and shape. The standard strips that we used in most experiments were 15 cm long and 1 cm wide, and only these strips are analyzed throughout this paper. We also tested strips of other widths, as described below, but these were not systematically analyzed.
With a strip of constant thickness and width, presented to the animal at a constant angle and under constant tension, it was arguably the case that, in each of the many cycles that it generally took to swallow the entire length of the strip, the animal was experiencing the same stimulus—facing the same feeding task.1 We took care to ensure this constancy of stimulus or task by excluding from our analysis all cycles at the beginning and end of the strip in which the strip was not able to move freely, and in any case the first two cycles of each strip—so that, in general, we analyzed from each strip only a single continuous sequence of “internal” cycles, each having as its predecessor (and usually also successor) another cycle exactly like it in stimulus or task, although not necessarily response. The sequence of cycles analyzed from the strip in Fig. 1, for example, is that enclosed in the dashed box in Fig. 1A. We also ignored the numerous cycles of biting behavior—clearly different from swallowing—that occurred before and after the ingestion of each strip (for example, at “a” and “b” in Fig. 1A), and excluded any strip during which the animal showed overt signs of rejection behavior. This is therefore an analysis purely of swallowing behavior, in response to a constant feeding stimulus or task.
From the distinctive, structured burst of the three main classes of spikes in the buccal nerve 2 record in each cycle (Fig. 1, B and C), we defined, using standard criteria based on those of Morton and Chiel (1993a) (see Methods), the beginning and end of the radula-retraction phase of the feeding motor program (that is, the retraction phase as defined electrically: see further below). In Fig. 1B, for example, these retraction phases are indicated by the grey rectangles. Immediately before each radula-retraction phase, there was presumably a radula-protraction phase, but we had no way to define its beginning so as to demarcate it from the preceding interprogram interval. The intervals between the retraction phases in Fig. 1B are therefore the sum of both protraction and interprogram interval. In our analysis, we took a “cycle” to be the sum of a retraction phase and its preceding protraction and interprogram interval.
The buccal nerve 2 record thus indicated the overall cycling and phasing of the CPG. The ARC muscle record, on the other hand, reflected motor neuron firing and muscle contraction.2 Each peak of the slow waves of electrical activity that we recorded in the muscle (Fig. 1, B and C) is believed to correspond to an excitatory junctional potential (EJC) elicited in the muscle by a spike fired by one of the muscle’s two motor neurons, B15 or B16 (Cropper et al. 1990a,b). The bursts of this activity were in most cycles intense enough to have produced a muscle contraction, with a size and shape reflecting the pattern of the burst but delayed with respect to it by as much as several hundred milliseconds in this slow muscle (see, e.g., Cohen et al. 1978; Brezina et al. 2000a; Zhurov et al. 2004).3 Altogether, then, we had from the two electrical records at least some degree of information about each of the levels of the neuromuscular system: the CPG, motor neurons, and muscle. Simultaneously, of course, we had the record of the movement of the seaweed strip. For further analysis, we collected together a dataset of 2,755 cycles from 143 strips (a mean of ~19 cycles/strip) ingested by 26 animals.
Strip movements are movements of the buccal mass, not of the whole body
The animals were not restrained in any way. We were therefore concerned that to some degree the movements of the seaweed strip that were registered by the length transducer might have reflected movements of the animal’s head or whole body, rather than the movements of the buccal feeding apparatus inside the head that were our primary interest. To find out whether this was a problem, we compared the movements of the strip recorded with the length transducer with the movements of the animal’s head in the video record of the experiment.
For this purpose we videotaped the animal through the side of the recording tank parallel to the surface of the water, that is, orthogonally to the movement of the seaweed strip, as shown in the second video segment at http://fulcrum.physbio.mssm.edu/~seaslug/Seaweed.html and in Fig. 2B. In the video we then tracked the position of some particular identifiable feature on the animal’s head—a skin fold or spot—in frames ~0.5 s apart (see Methods). Fig. 2C shows, for one typical strip, the simultaneous records of the strip position registered by the length transducer and of the vertical position of the animal’s head.4 Clearly, even when the strip moved rapidly, the head moved hardly at all. Fig. 2D shows group data, 2,984 pairs of simultaneous measurements of strip and head movement computed ~0.5 s apart (thus spanning ~26 min) over 241 cycles of swallowing of 5 strips by 3 animals (a subset of the larger dataset analyzed in the rest of the paper). The head movements are much smaller than, and furthermore are completely uncorrelated with, the movements of the strip.
This confirms our visual impression in observing these experiments, which can be gained also from watching the two video segments. Within one or two cycles (excluded from our analysis) after first grasping the seaweed strip, the animal ceased the head-waving movements that characterize the appetitive (food-orienting) phase of the feeding behavior (Kupfermann 1974), and settled into a typical posture, extending the front half of its body at the surface of the water with the mouth upward (see particularly the first video segment). In this posture the animal remained relatively immobile while ingesting the strip. Frequent twitches and ripples could be observed in the skin, the tentacles, and the oral veil, but these movements were small and bore no obvious relation to the movements of the strip, especially the large periodic movements in which the strip was pulled quickly in through the mouth apparently by something inside (see the video segments). Presumably this was the buccal-mass apparatus. We conclude therefore that the strip movements recorded in these experiments can be attributed almost entirely to the action of the buccal neuromusculature.
The swallowing cycles are very variable in all parameters including functional performance
Even though the seaweed strip stimulus was perfectly constant and regular in each cycle, the animal’s response to it was not at all regular. There was great variability from one cycle to the next in the records of buccal nerve 2 and ARC muscle electrical activity—variability in the cycling and phasing of the CPG, the firing of the ARC motor neurons, and, presumably, the contractions of the muscle. This was as expected from the work of Horn et al. (2004). Furthermore, as can be appreciated already in Figs. 1A and 2C, the movement of the seaweed strip—the functional performance of the feeding task—was likewise very variable from cycle to cycle.
Following Horn et al. (2004), we quantified and analyzed this variability in several complementary ways.
Variability of temporal profiles
First, we examined the variability of entire waveforms. We collected together the waveforms of the instantaneous frequencies of each of the three separate classes of spikes in buccal nerve 2, of all of these spikes combined, and of the peaks or spikes in the ARC muscle record,5 over the duration of the cycle from all 2,755 cycles in the dataset, aligned at the beginning of retraction. In Fig. 3 (plots 1–5), we have then plotted, at each timepoint relative to this boundary (vertical line at time = 0), the 10th, 25th, 50th (median), 75th, and 90th percentile values across the entire ensemble of waveforms. The corresponding values at successive timepoints constitute the 10th, 25th, 50th, 75th, and 90th percentile profiles seen. The time at which each percentile profile first rises above zero marks the corresponding percentile of the distribution of the durations of protraction and the preceding interprogram interval; where it eventually falls below zero, of retraction (these percentiles are explicitly indicated by the grey bar at the bottom). Clearly, there is a many-fold difference, about as large as that found by Horn et al. (2004), in each of the dimensions of cycle timing and spike frequency represented in these profiles between the smallest and largest cycles in the dataset.6
Figure 3.

Variability of the temporal profiles of buccal nerve 2 and ARC muscle electrical activity and movement of the seaweed strip in each cycle. Segments of the instantaneous firing frequency functions of the small, medium, and large classes of spikes in buccal nerve 2 (BN2), constructed as described in Methods (plots 1-3), the similarly constructed function of all of the buccal nerve 2 spikes combined (plot 4), the similarly constructed function of all of the peaks or spikes in the ARC muscle record (plot 5), and the instantaneous position of the seaweed strip (plot 6) were cut from each of the cycles in the dataset (n = 2,755) and aligned at the beginning of the retraction phase of the cycle (vertical line at time = 0). For each of the resulting ensemble distributions, the 10th, 25th, 50th (median), 75th, and 90th percentiles were determined at each timepoint, then plotted over all of the timepoints to form the profiles shown here. In plots 1-5, before the beginning and after the end of each individual cycle, its firing frequency functions were set to a nominal negative value. As a result, each ensemble percentile profile becomes negative, and so appears to end in these plots, at the corresponding percentile of the distribution of the durations of the preceding interprogram interval plus protraction phase, before time = 0, or the durations of the retraction phase, after time = 0, explicitly shown by the grey bars at the bottom. (The latter distribution is the same as that shown in Fig. 4A1.) In plot 6, the instantaneous position of the strip in each cycle was offset, by subtracting the position at the beginning of the cycle, so as to be zero at the beginning of the cycle and, nominally, at all previous timepoints. After the end of each cycle, the position was set to that attained at the end of the cycle, so that each ensemble percentile profile attains a final plateau at the corresponding percentile of the distribution of all lengths of seaweed swallowed, explicitly shown by the grey bar at right. (This distribution is the same as that shown in Fig. 4A5.)
Similarly, in plot 6 of Fig. 3 we constructed the percentile profiles of the relative position or movement of the seaweed strip. These profiles all start at zero at the beginning of the cycle, but then diverge and end at the corresponding percentile of the distribution of the lengths of seaweed swallowed in the cycle, explicitly shown by the grey bar on the right. Again, there is a many-fold difference in the amount of seaweed swallowed between the best-performing and the worst-performing cycles. In the best 10% of the cycles, the animal swallowed more than 0.4 cm of seaweed. In the worst 10% of the cycles, the animal swallowed no seaweed at all—the cycle ended, in fact, with a slight net movement of the seaweed strip out of the mouth.
Examining the profiles in more detail, we see that, although there was usually some activity in buccal nerve 2 throughout the interprogram interval and protraction (in an individual cycle, these spikes can be seen, for example, at “g” in Fig. 1B), before the distinct dip in activity that characteristically occurred just before the beginning of retraction (“Break” in Fig. 1B; see Methods), most of the activity in buccal nerve 2 was in retraction. This is indeed to be expected since that activity was used to define retraction. More interestingly, the ARC activity also occured largely in retraction. The ARC muscle participates in closing together the two halves of the radula, the hand-like structure at the core of the buccal mass, to grasp the seaweed so that it can be moved (Cohen et al. 1978). Thus the ARC electrical activity—presumably resulting in contraction of the muscle—in retraction, when the radula is retracted and rotated backward so as to pull the seaweed into the mouth, conforms with our picture of how the feeding apparatus operates during ingestive cycles. But in a minority of the cycles, the ARC spikes clearly began well before the beginning of retraction (arrow in plot 5 of Fig. 3; a tendency to this can be seen even in the individual cycles of Fig. 1B).
This situation is reminiscent of the findings of Morton and Chiel (1993a,b) with another radula closer muscle and its motor neurons, the neurons B8. The spikes of B8, like those of B15 and B16 that we monitored here in the ARC muscle, come during retraction—defined by Morton and Chiel, as here, by the electrical activity in buccal nerve 2—in the majority of ingestive cycles, and indeed the degree of temporal overlap between the burst of B8 firing and the retraction-defining burst in buccal nerve 2 was proposed by Morton and Chiel as a convenient (and thereafter widely used) electrical criterion of the type of motor program produced by the CPG. Substantial overlap between the B8 firing and the buccal nerve 2 burst indicates an ingestive program; relatively little overlap, with most of the B8 firing coming before the buccal nerve 2 burst, would on the other hand indicate an egestive (rejection) program, in which the phasing of the movements would be reversed, closing the radula during protraction rather than retraction so as to expel inedible material out of the mouth. But in the recordings of Morton and Chiel, too, there was a significant minority of cycles in which there was little overlap—like the ARC spikes in some cycles here, the B8 spikes began well before the buccal nerve 2 burst—yet the cycle was still ingestive behaviorally, as judged by the inward movement of the seaweed that the animal was swallowing. (Morton and Chiel did not quantify the movement, however: they merely observed it.) Conversely, there were cycles in which there was substantial overlap, yet the seaweed moved outward. There were also numerous cycles, with or without overlap, in which there was no seaweed movement at all.
As with B8, several possibilities, or some combination of them, may explain the early firing of the ARC motor neurons in some cycles. (1) The large variability and irregularity of the buccal nerve 2 bursts may have caused the beginning of retraction to be misidentified in some cycles: retraction actually began somewhat earlier. (2) Although we discarded recordings and discontinued experiments whenever animals showed signs of overt behavioral rejection, some cycles, even within otherwise ingestive sequences, may nevertheless have been egestive, or, more precisely, may have been more egestive than others along a smooth ingestive-egestive continuum (see Discussion). (3) Finally, it is clear that behavioral retraction does not correspond exactly to the retraction defined by the electrical activity in buccal nerve 2. Examination of the profiles in Fig. 3, as well as individual retraction phases such as those marked by the grey rectangles in Fig. 1B, shows that there was some interval of time after the beginning of the buccal nerve 2 burst during which the firing of the ARC and other radula closer motor neurons had probably already closed the radula around the seaweed strip because the strip moved, but it moved outward. The radula must therefore still have been protracting at this time, and began retracting only later, some considerable time—half a second or longer—after the beginning of the the buccal nerve 2 burst. (At the end of retraction, there was a disparity too: overt behavioral retraction ended some time before the end of the buccal nerve 2 burst.) This initial outward movement was evident in most individual cycles in our dataset here, in the form of the obvious downward dip preceding each upward ratcheting of the seaweed in Figs. 1, A and B, 2C, 7A, and 9, for example, and clearly visible in the average profiles in Fig. 3. (Even though in physical reality the animal was pulling the seaweed strip downward, in the figures this is plotted inverted, as the length of seaweed already swallowed.) The initial outward movement is clear in each of the video segments at http://fulcrum.physbio.mssm.edu/~seaslug/Seaweed.html. Closure of the radula some time before the peak of protraction has previously been reported by Friedman et al. (2002, and S. C. Rosen, personal communication). A substantial initial outward movement of the food being swallowed before its inward movement in each cycle thus seems to be a systematic feature of Aplysia swallowing.
Much of this was indeed noted by Morton and Chiel (1993a,b). In their summary timing diagram for swallowing (Fig. 8B of Morton and Chiel 1993a), behavioral retraction begins 0.5–0.7 s after the beginning of the buccal nerve 2 burst, while the firing of B8, like the ARC firing here, begins a fraction of a second before the buccal nerve 2 burst. In these respects, therefore, our results here confirm and extend the findings of Morton and Chiel.
Variability of absolute values of representative parameters.
The profiles in Fig. 3 reveal the simultaneous multidimensional variability of the entire waveforms, but they do not lend themselves readily to further statistical treatment. A different quantification of the variability in the dataset is therefore presented in Fig. 4A. Here we have simply plotted the distributions of values of five representative parameters of the buccal nerve 2 and ARC electrical activity and movement of the seaweed strip, measured from all 2,755 cycles in the dataset. We will refer to such values measured from individual cycles as “absolute” values, in contrast to the relative cycle-to-cycle differences described below. The five parameters plotted are (Fig. 4A1 to A5) the retraction duration, the cycle period, the mean frequency of all buccal nerve 2 spikes in retraction, the mean frequency of all ARC spikes in retraction, and the length of seaweed swallowed in the cycle. Measurement of one single overall value of each parameter from each cycle discards detailed timing information; by the same token, it is relatively robust against such problems as the possible misidentification of the precise beginning and end of the retraction phase. The 10th, 25th, 50th, 75th, and 90th percentiles of each distribution are marked by the thin vertical lines. Clearly, each distribution is very broad; the values at the upper end are many-fold larger than those at the lower end. Note again, in Fig. 4A5, the number of cycles in which there was no seaweed movement at all or even negative movement, a net movement of the seaweed strip out of the mouth.
Figure 4.
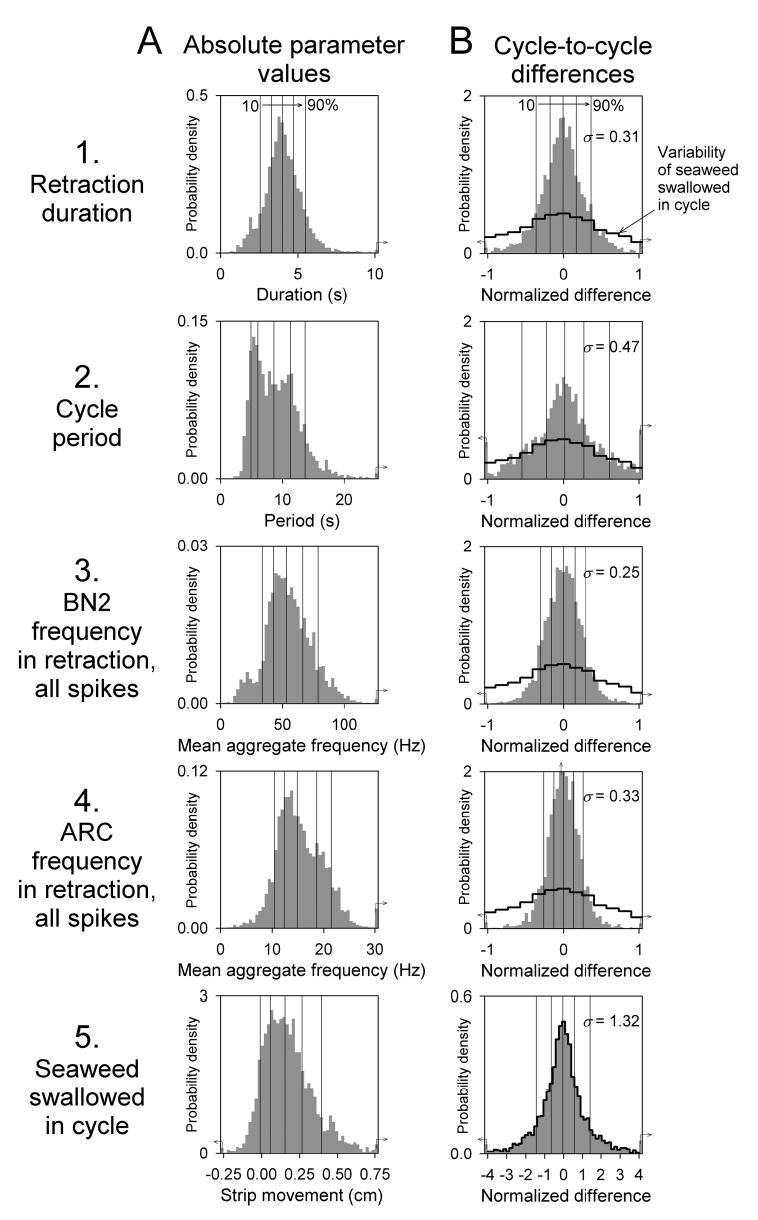
Variability of the absolute values and cycle-to-cycle differences of five representative parameters of the buccal nerve 2 and ARC electrical activity and movement of the seaweed strip. All cycles in the dataset (n = 2,755) were measured for their retraction duration, as defined by the duration of the buccal nerve 2 spike burst (row 1), cycle period (= retraction duration + duration of preceding protraction and interprogram interval; row 2), the mean frequency of all buccal nerve 2 (BN2) spikes in retraction, that is, in the retraction-defining burst (row 3), the mean frequency of all peaks or spikes in the ARC muscle record in retraction (row 4), and the length of seaweed swallowed in the cycle (row 5). A (left column): distributions of the absolute values of these five parameters, scaled so as to approximate probability density functions. The thin vertical lines indicate the 10th, 25th, 50th (median), 75th, and 90th percentiles of each distribution. B (right column): distributions of the cycle-to-cycle differences of the five parameters. As in A, except that the absolute parameter values were further processed by pairwise subtraction to yield the differences between each cycle and the immediately preceding cycle in the same strip. The differences in each strip were normalized by the mean of the absolute values of the parameter in that strip, so that −1 and +1 on the horizontal axis of the plots in B indicate decreases and increases, respectively, equal in magnitude to the mean of the parameter. In addition to the percentile lines, the standard deviation of each distribution, σ, is given. Note that the cycle-to-cycle distribution of the lengths of seaweed swallowed, in B5, is much broader, and is plotted over a more extended range, than the other cycle-to-cycle distributions. To emphasize this, the outline of the former is superimposed over each of the latter in B1-B4 (black outline labeled “Variability of seaweed swallowed in cycle”). In many of the plots, the first bar of the distribution contains pooled smaller values (small left-pointing arrow) and the last bar contains pooled larger values (small right-pointing arrow).
Variability of cycle-to-cycle differences of representative parameters.
The absolute-value distributions lump together all types of variability, including global components, relatively uninteresting to us here, such as those due to differences between animals and in the general state of the animal at different points in the experiment (see Horn et al. 2004). The absolute-value distributions will also reflect slow, progressive changes in the average values of the parameters of the motor programs, muscle contractions, and the behavior (Proekt et al. 2004; Zhurov et al. 2005a) that, while functionally very relevant, are to a first approximation independent of the fast cycle-to-cycle variability that is of interest in this paper: the fast variability appears essentially to be superimposed on the slow changes in average parameter values. To exclude these other components of variability, we examined a purely local measure of variability, pairwise cycle-to-cycle differences between the values of a parameter in successive cycles in the same strip. In Fig. 4B we have plotted the distributions of these differences for the same five parameters as in Fig. 4A. The differences in each strip were normalized by the mean of the absolute values of the parameter in that strip, so that −1 and +1 on the horizontal axis indicate decreases and increases, respectively, from one cycle to the next that are equal in magnitude to the mean of the parameter. In addition to the percentile lines, the standard deviation of each distribution, σ, is given. With the normalized values used, σ is a dimensionless measure similar to the coefficient of variation (see Horn et al. 2004). Again, the distributions are broad: there are numerous differences that are almost as large as, or in some parameters such as the cycle period even larger than, the mean. And it is the functional performance, the length of seaweed swallowed, that shows the most extreme variability. The distribution in Fig. 4B5 is much broader still (note that it is plotted over a more extended range) than the other cycle-to-cycle distributions. For comparison, the outline of the distribution of the seaweed swallowed from Fig. 4B5 is superimposed (black outline) over each of the other distributions in Fig. 4B1–B4.
Functional performance is not explained by any single parameter of CPG or neuromuscular activity
From examination of raw records such as those in Fig. 1 (and Figs. 7A and 9), it seems that there should be some parameter of the cycle timing or neuromuscular activity that would predict—and that would therefore be a good candidate to investigate as the causal determinant of—the length of seaweed swallowed in each cycle. For example, it often seemed (e.g., in Fig. 7A) that more seaweed was swallowed whenever the bursts of buccal nerve 2 and ARC activity were stronger.
To see whether we could identify any such parameter, in Fig. 5 we examined correlations between the parameters. Using multiple linear regression techniques (for details see Methods), we computed mutual pairwise correlations between ten parameters, the five basic parameters from Fig. 4 and additionally the duration of the interprogram interval and protraction in each cycle, the mean frequencies of the three separate classes of spikes, with small, medium, and large amplitudes, in buccal nerve 2 in retraction, and the length of seaweed swallowed in retraction. One representative correlation plot, between the retraction duration and the seaweed swallowed in retraction, is shown in Fig. 5A. Each point represents one of the 2,755 cycles in the dataset. The best cubic polynomial fit is shown (grey curve) and the value of the coefficient of determination, R2, is given. Fig. 5B then shows the strengths of the correlations—the values of R2, represented by the thickness of each line—between the absolute values of all pairwise combinations of the ten parameters, and Fig. 5C between the corresponding cycle-to-cycle differences. The two diagrams are quite similar, apart from a general strengthening of the correlations in Fig. 5C due to elimination of the global components of the variability, the systematic differences between strips and animals.7
The coefficient of determination R2—the fraction of the variance of the “dependent” parameter explained by the “independent” parameter—is a good single indicator of the strength of the correlation, bearing a close relationship both to the statistical significance of the correlation and to its magnitude or practical significance (see, e.g., Cohen 1992; Kirk 1996; and Methods). To make each of these two quantities explicit, however, Fig. 6 provides a table of numerical results expanding the more informative of the two diagrams in Fig. 5, that of the correlations between the cycle-to-cycle differences in Fig. 5C. Each cell in Fig. 6 represents one pairwise correlation and gives the numerical value of R2 (top number), the p value expressing the statistical significance of the correlation (middle number), and Cohen’s d, a standard measure of the magnitude of an effect (Cohen 1992; Kirk 1996), in this case the correlation (bottom number). The numbers in the table are roughly symmetrical about its principal diagonal, showing that to a first approximation it did not matter whether a parameter was taken to be the independent (rows) or dependent (columns) parameter in these correlations. (The diagrams in Fig. 5 show the stronger of each pair of reciprocal correlations.) The cells with grey numbers in Fig. 6 indicate correlations that are not statistically significant. The cells with large, bold numbers indicate correlations that not only are statistically significant, but are also “large” in magnitude (d ≥ 0.8) on Cohen’s scale [d = 0.2 is a “small,” d = 0.5 a “medium,” and d = 0.8 a “large” effect (Cohen 1992)].
The strongest correlations seen in Fig. 5, B and C, and found in the table in Fig. 6, are those that are expected simply by virtue of the fact that one of the correlated parameters is an inherent, and dominant, component of the other. So, for example, the duration of the interprogram interval and protraction is very strongly correlated with the cycle period; the frequencies of the three spike classes in buccal nerve 2 are correlated with the frequency of all buccal nerve 2 spikes; and the seaweed swallowed in retraction is correlated with the seaweed swallowed in the entire cycle. Looking beyond these obvious correlations, some other, albeit weaker correlations still stand out. Especially in the cycle-to-cycle differences, the frequency of the ARC spikes is well correlated with that of the buccal nerve 2 spikes, in particular, apparently, of the medium spikes in buccal nerve 2. But beyond this, what is striking is the lack of correlation between parameters that might be expected to be correlated if the system were truly working in a stereotyped fashion. There is, for instance, little correlation between the durations of the two phases that make up each cycle, the duration of retraction and that of protraction and the interprogram interval. There is relatively little mutual correlation between the frequencies of the three separate classes of spikes in buccal nerve 2. This again is a reflection of the variability, uncorrelated across parameters and so producing apparently random combinations of parameter values in each cycle, as was described by Horn et al. (2004) (see also Zhurov et al. 2005b).
In particular, there is no strong correlation from any other parameter to the functional performance, the length of seaweed swallowed in retraction or in the entire cycle. The only correlation to functional performance that has any strength at all in Fig. 5, B and C, and in the table in Fig. 6 (cells with heavy outline), is from retraction duration: the longer the retraction lasted, the longer was the piece of seaweed strip that the animal swallowed. (Thus, the “stronger” bursts of buccal nerve 2 and ARC activity that appeared to bring in more seaweed did so, presumably, simply because they lasted longer: there is little correlation in Figs. 5, B and C, and 6 between the buccal nerve 2 or ARC frequency and the length of seaweed swallowed, or indeed between the buccal nerve 2 or ARC frequency and the retraction duration.)
To probe this conclusion further, we extended our correlational study to see to what extent all of the other parameters—more precisely, those that were not obviously composite: the durations of retraction and of protraction and the interprogram interval, the three separate classes of buccal nerve 2 frequency, and the ARC frequency—could together explain the length of seaweed swallowed, and to what extent the retraction duration still retained its effect when considered within this entire ensemble of parameters.
To examine the first question, we computed the simultaneous correlation from all of the six non-composite parameters to the length of seaweed swallowed in the cycle (the results with the length of seaweed swallowed in retraction were similar). This correlation had R2 = 0.29, p < 0.00001 (from the F18,2736 distribution; see Methods), and d = 1.3 for the absolute values of the parameters, and R2 = 0.24, p < 0.00001 (from the F18,2593 distribution), and d = 1.1 for the cycle-to-cycle differences. Thus, all six parameters together could explain a statistically and indeed practically significant part (29 or 24%) of the variance of the seaweed swallowed—as expected, more than any one of the six parameters separately (compare with Fig. 6). Nevertheless, the greater part of the variance (71 or 76%) was still left unexplained by these particular parameters, even when taken all together.
To examine the second question, we then computed the partial correlation from the retraction duration to the length of seaweed swallowed in the cycle (the results with the length of seaweed swallowed in retraction were similar) in the presence of the other five parameters. This partial correlation had R2 = 0.23, p < 0.00001 (from the F3,2751 distribution), and d = 1.1 for the absolute parameter values, and R2 = 0.13, p < 0.00001 (from the F3,2608 distribution), and d = 0.77 for the cycle-to-cycle differences. Thus much, although not all, of the variance of the seaweed swallowed that was explained by all six parameters together—23% of the 29% for the absolute parameter values, and 13% of the 24% for the cycle-to-cycle differences—could be explained by just one of them, the retraction duration. To this extent, the retraction duration was a “sufficient” parameter. Conversely, comparison with Fig. 6 shows that, for the cycle-to-cycle differences, the presence of the other five parameters did not decrease the variance of the seaweed swallowed that was explained by the retraction duration by much, only from 17% to 13%. Thus, even in the presence of the other five parameters, the retraction duration retained most of its effect, showing that—within the ensemble of these particular parameters—its effect was direct, not through indirect correlation with one or more of the other parameters. To this extent, the retraction duration was a “necessary” parameter.
Altogether, then, it is possible to identify a parameter, such as retraction duration, that has a significant effect on functional performance. But the effect of retraction duration, while significant, still leaves the greater part of the functional performance unexplained. Of the parameters that we examined, no single parameter can very well explain why in some cycles a considerable length of strip was swallowed, while in others none at all. Future work might, of course, still reveal a single, simple parameter of CPG or neuromuscular activity, which we did not record or quantify here, that will explain functional performance in this way. However, the generalized, multidimensional, uncorrelated variability that Horn et al. (2004), Zhurov et al. (2005b), and now we here have found leads us to favor the idea that functional performance is not determined by one or a few such strong interactions, but rather emerges from a combination of the many weak interactions between the components of this system.
How does the variability relate to overall functional success?
Given that variability does emerge in the functional performance of the behavior, clues to the functional significance of the variability might be gained by relating the variability to the overall success of the behavior. Is behavior that is more variable more, or less, successful than behavior that is more regular? To answer questions of this sort, in the rest of our analysis in this paper we examined relationships between the degree of variability, expressed by the standard deviation of the various parameters of CPG and neuromuscular activity and of the performance itself, and the mean performance, that is, the mean length of seaweed swallowed per cycle, computed stripwise for each strip in the dataset.
Inspection of the raw records suggested that there might indeed be a relationship—an inverse relationship—between variability and overall success. For example, Fig. 7A shows a seaweed strip that was swallowed with particularly large variability in the records of buccal nerve 2 and ARC electrical activity as well as in the movement of the strip. And the mean movement per cycle was also small—it took many more cycles than usual to swallow even part of the strip, which finally broke or was cut by the animal. To see whether the relationship would hold more generally, in Fig. 7B we have plotted the standard deviation of our local measure of performance variability, the cycle-to-cycle differences of the seaweed swallowed (as in Fig. 4B5 but computed separately for each strip), as a function of the mean seaweed swallowed per cycle for each of the 143 strips (black points) in the dataset. Indeed, there is a clear inverse relationship. The superimposed bar graph shows, furthermore, that the 14 strips (~10% of the dataset) with the smallest mean had much larger standard deviation than the 14 strips with the largest mean. This difference in standard deviation was statistically highly significant (two-tailed t-test: t = 7.38, 26 degrees of freedom, p < 0.00001). On Cohen’s d scale, the magnitude of the difference was “large” (d = 2.8; see Methods). Thus, strips that were swallowed more successfully were swallowed in a relatively more regular manner; and, conversely, strips that were swallowed in a relatively more regular manner were swallowed more successfully.
However, recall that the cycle-to-cycle differences, much like the coefficient of variation, already express variability normalized by the mean. The points in Fig. 7B are in fact reasonably well fitted by a reciprocal of the mean (grey curve; see figure legend). This suggests that most of the change in the standard deviation seen in Fig. 7B was due simply to the change in its normalizing component, the mean. The non-normalized, absolute variability might therefore have been largely independent of the mean. Fig. 7C, plotting the standard deviation of the absolute lengths of seaweed swallowed (that is, of the distribution in Fig. 4A5 but computed separately for each strip) against the mean, shows that, to a first approximation, this was so. Comparing the strips with the smallest and largest means in this case found no statistically significant difference in standard deviation (t = 2.04, 26 degrees of freedom, p = 0.051; Cohen’s d = 0.75).
The picture is now therefore somewhat different. Strips that are swallowed more successfully are swallowed in a relatively more regular manner, and this may be very relevant for the functional significance of the variability. But it appears that the system generates a degree of absolute variability in the performance—the absolute size of the excursions in our records of seaweed movement—that is rather independent of the actual success of the performance—the mean rate of the seaweed movement. If the seaweed is being swallowed on the whole successfully, then the absolute variability assumes a smaller relative significance. If, for some reason, the seaweed is not being swallowed successfully, the variability assumes a large relative significance. In any case, the data clearly do not fit at all the simple model (dashed lines in Fig. 7, B and C) that the absolute variability scales proportionately to the mean—as might be expected, for example, between animals of different sizes—so that the movements of the seaweed, while changing in size, always have the same general shape.
It is the CPG that generates the variability, which then propagates through the neuromuscular system to emerge in the behavior (Horn et al. 2004). If the CPG and the neuromusculature operate in a more variable manner, we might expect the functional performance to be more variable as a consequence; if they operate in a more regular manner, the functional performance too might be more regular. Indeed, Fig. 8A shows that this was so. Rather than plotting the variability of all of the different parameters of CPG and neuromuscular activity separately, in Fig. 8 we have combined the variability of all of the independent parameters into one “CPG and neuromuscular variability index” (see Fig. 8 legend). Fig. 8A then shows that strips that had a low index—where the CPG and neuromusculature operated in a relatively regular manner—also had a small standard deviation of the cycle-to-cycle differences of the seaweed swallowed; conversely, strips that had a high index had a large standard deviation, a large variability of functional performance from cycle to cycle. Although there is considerable scatter of the individual points in Fig. 8A, the difference in standard deviation between the 10% of the strips with the lowest index and the 10% with the highest index is statistically highly significant (t = 5.96, 26 degrees of freedom, p < 0.00001) and “large” on Cohen’s scale (d = 2.3).8
The variability in the operation of the CPG and neuromuscular system translates, therefore, to variability in the functional performance. Does it alter, however, the overall success of the performance? In these experiments, it did not. Fig. 8B shows that there was no significant difference in the mean seaweed swallowed per cycle between strips that had low and high values of the variability index (t = 0.66, 26 degrees of freedom, p = 0.52; d = 0.25). Fig. 8C shows, conversely, that there was no significant difference in the variability index between strips that had small and large values of the mean seaweed swallowed per cycle (t = 1.32, 26 degrees of freedom, p = 0.20; d = 0.50). We will consider the meaning of these findings in the Discussion.
Seaweed strips of different widths are ingested at different rates, but in all cases with large variability
The foregoing may give the impression that the Aplysia feeding system operates in a self-contained, autonomous manner, paying little attention to the animal’s environment or indeed the outcome of its own actions. In certain respects, we propose that the system does in fact operate in such a manner (see Discussion). Nevertheless, it is quite capable of responding to different environmental demands. In all of the experiments so far, as already explained, we kept the environment as constant as possible, using, in particular, seaweed strips that were always 1 cm wide. In a few experiments, however, we tested also 0.5-, 1.5-, and 2-cm wide strips. The width clearly did make a difference, as can be seen in the excerpt from one of these experiments in Fig. 9. The wider the strip, the slower was the average rate of its ingestion—although, interestingly, the total amount of seaweed material ingested per unit time was rather similar in all cases. Note, furthermore, that the cycle-to-cycle variability that we have systematically analyzed in this paper with the 1-cm strips was present, to a first approximation to an equal degree, also when the strip was 0.5 or 1.5 cm wide. We made no systematic analysis of the strips of other widths. The effect of strip width on the average amount of seaweed ingested has already been studied, and the effect seen in Fig. 9 has been quantified, by Weiss et al. (1986) and Hurwitz and Susswein (1992) . For our purposes, it will clearly be very important to study the effect of strip width, and other environmental factors, also on the cycle-to-cycle variability. This will, however, require the collection of more data and, in general, a more elaborate experimental approach (see Discussion).
Discussion
Main results
In this work we have developed a technique to measure the functional performance of Aplysia swallowing, by continuously recording with a length transducer the movement of the seaweed strip that is being swallowed. In our previous work with single muscles or muscle pairs disassembled from the buccal musculature (Brezina et al. 2000b, 2003, 2005a; Brezina and Weiss 2000), we were able to devise performance measures only on the basis of plausible, but largely untested, assumptions about the functional task of the muscles. We now have a self-evident, time-continuous measure of performance in the intact, freely feeding animal.
Simultaneously with the measurement of performance, we have used chronically implanted electrodes to record electrical activity in buccal nerve 2 and the ARC muscle, providing information about the activity of each of the internal levels, the CPG, motor neurons, and muscles, of the feeding neuromusculature. This has allowed us to see how the timing of characteristic internal events, such as the burst of buccal nerve 2 spikes that in vitro is often taken as a marker of the radula-retraction phase, relates to the timing of actual behavioral events, such as the actual behavioral retraction. In this respect we have confirmed, and extended, the previous work of Morton and Chiel (1993a,b).
We have confirmed the previous finding of Horn et al. (2004) and Zhurov et al. (2005b) that essentially all parameters of the internal activity are very variable from cycle to cycle, and are only weakly correlated among themselves. Each of them is, furthermore, only weakly correlated to the functional performance, the length of seaweed swallowed in the cycle or, in practice, in retraction. The single best predictor of the length of seaweed swallowed in retraction is the duration of the retraction phase itself. In this respect, studies that investigate in vitro how various interneurons or neuromodulators modify the phase durations of the feeding motor program (e.g., Nargeot et al. 1999; Morgan et al. 2000; Dembrow et al. 2003; Hurwitz et al. 2003; Jing et al. 2003, 2004; Shetreat-Klein and Cropper 2004) are indeed focusing on parameters that may have real behavioral significance. However, even this best correlation is only very modest (R2 < 0.3). It appears that functional performance is not determined by one or a few strong interactions, but rather emerges from a combination of the many weak interactions between the components of this system.
Most importantly, the variability that is observed in the internal levels of the system does emerge in the behavior and its functional performance. The length of seaweed swallowed in the cycle is not less variable, and may indeed be more variable, than the parameters of the activity of the CPG, motor neurons, and muscles (Fig. 4B). If the variability of the internal parameters is particularly large, or particularly small, during the ingestion of a seaweed strip, so is the variability of the seaweed swallowed (Fig. 8A).
Finally, we have attempted to relate the variability in the internal levels of the system and in the performance to the overall performance, the overall success of the behavior.
Points (4) and (5) warrant further discussion.
Variability emerges in behavior
The traditional way to think about the internal variability in the system would be as “noise” that must be counteracted, reduced, if possible eliminated. Work in a number of systems has documented how the intrinsic variability of neuronal firing patterns (e.g., Wu et al. 1994; de Ruyter van Steveninck et al. 1997; Shadlen and Newsome 1998; Stevens and Zador 1998; Warzecha and Egelhaaf 1999; Kara et al. 2000) and muscle contractions (Hoover et al. 2002; Zoccolan et al. 2002) is reduced through synchronization, averaging, redundancy, population coding (Sparks et al. 1997; Selverston et al. 2000; Hoover et al. 2002; Zoccolan et al. 2002), and, more generally, degeneracy in the mapping from one level of the system to the next higher level (Beer et al. 1999) to achieve a reproducible final output of the system. Our most important finding here is that this does not happen in the Aplysia feeding system. The variability that is generated by the CPG (Horn et al. 2004) propagates through the levels of motor neuron firing, muscle contraction (Horn et al. 2004; Zhurov et al. 2004 Zhurov et al. 2005b), and buccal-mass biomechanics (Drushel et al. 1997, 1998; Neustadter et al. 2002a,b; Zhurov et al. 2005a) to emerge, undiminished, in the functional performance of the feeding behavior. Even when the task facing the feeding animal remains constant, as it did in the experiments here, successive cycles have very different profiles of instantaneous seaweed movement (Figs. 1, 2C, 3, 7A, 9), and some cycles pull in much more seaweed than others (Figs. 3 and 4). Some cycles pull in no seaweed at all or even expel seaweed that has already been swallowed. Such “dysfunctional” cycles have long been noted anecdotally (Hurwitz and Susswein 1992; Morton and Chiel 1993a; Horn et al. 2004), but never documented systematically. Rather than a discrete, stereotyped behavior with a stereotyped functional outcome, there is a continuum of outcomes, ranging from very successful ingestion through weak ingestion to what, in terms of outcome, would have to be called egestion. A similar ingestive-egestive continuum has been observed in the character of the feeding motor programs produced by the CPG in vitro (Morgan et al. 2002; Jing and Weiss 2002; Proekt et al. 2004).
It is instructive to compare the degree of variability in the Aplysia feeding behavior with that seen in other behaviors. Human locomotion, for instance, exhibits in its various kinematic and performance parameters coefficients of variation ranging from ~10% down to <1% (e.g., Masani et al. 2002; Terrier and Schutz 2003; Owings and Grabiner 2004), much less than the values of >100% that we have found for the equivalent measure, the standard deviation σ of the distribution of normalized cycle-to-cycle differences, of the performance of the Aplysia feeding behavior (Fig. 4B). Other human voluntary activities have similarly low coefficients of variation of performance (e.g., Kjellberg et al. 1998). In terms of performance, these behaviors are much more regular, precisely repeatable from cycle to cycle, than is Aplysia feeding. Human chewing, on the other hand, is rather variable from cycle to cycle (Plesh et al. 1987, 1988; Wintergerst et al. 2004), perhaps as variable as Aplysia feeding. It is worth noting, conversely, that it is not the case that Aplysia is simply incapable of producing precise, coordinated behavior. The coordination between the ARC neuromuscular systems on the two sides of the animal, for example, is very precise down to even the level of single motor neuron spikes and twitches of the muscle—the variability, albeit spatial rather than temporal, is much smaller than that described in this paper—whereas, interestingly, the coordination of the ARC systems with their antagonist, the radula opener system, is not precise at all (Zhurov et al. 2005b).
In view of the functional penalties that this incurs in some cycles, why does the Aplysia feeding CPG generate the variability? Our proposal, previously set out in Horn et al. (2004) (see also Brezina et al. 2005a; Zhurov et al. 2005b), is that the penalties in individual cycles are outweighed by higher-order benefits that the variability brings overall. We propose that the variability is an integral part of the animal’s strategy for dealing with a changing and uncertain environment. At any point in its meal in the wild, the animal may be confronted with any of a wide range of seaweed types and qualities that are best ingested with somewhat different feeding movements—in other words, it is confronted with a range of feeding tasks. It is likely, furthermore, that the precise requirements of the best movement at any point are unknown. External tactile and chemical cues cannot fully distinguish, for example, the toughness of a piece of seaweed. How the seaweed can best be eaten, indeed whether it can be eaten at all, can only be determined, by internal sensory feedback from the buccal mass and esophagus, once the attempt has actually been made. In these circumstances, a trial-and-error strategy may be best. The CPG randomly generates a wide range of movements that efficiently sample the entire space of likely possibilities. Some of these movements will fail—and in a herbivore the penalty for failure in any particular cycle is relatively low—but at least some will succeed. On average, this is likely to be at least an adequate, “just-good-enough” strategy (Hooper 2004). We propose, however, that it is in fact the optimal strategy. Demonstrating optimality is difficult: it requires, first, finding the right scale—that actually “used” by the real biological system—on which to evaluate functional performance, and then showing that, on that scale, the real actions of the system give better performance than any alternative. We are certainly not close to doing this for the variable feeding strategy in the intact Aplysia. We have, however, begun to investigate the question in models of the functioning of a representative subsystem, such as the ARC system, within the feeding neuromusculature (Brezina et al. 2005a,b). These modeling studies indeed suggest that the variable strategy can guarantee, on average, the best functional performance—better than could be achieved with any regular, fixed set of feeding movements—in an unknown, variable feeding environment. The variable strategy is particularly superior when the animal is modeled as swallowing long leaves or strips of seaweed—as in our experiments here, but with properties varying along the strip—of which each successive segment must be swallowed before the next segment can be reached. In such circumstances, the regular, fixed movements that are “tuned” to only a limited range of properties of the seaweed inevitably fail, whereas the variable movements always eventually include a movement that, through quasi-random trial and error, succeeds and allows the animal to move on to the next segment (Brezina et al. 2005b).
Note that the variable strategy absolutely requires the internal variability generated by the CPG to emerge in the feeding movements and indeed in the performance of the feeding behavior. If in our work here we had found, as traditionally would have been expected, that the internal variability was averaged, filtered, or otherwise eliminated already internally so that the same movements were produced in each cycle, the variable strategy would have been eliminated as a plausible scenario of how the Aplysia feeding system operates.
Variability in relation to overall success
The modeling studies (Brezina et al. 2005a,b) suggest that the variable strategy will give, overall, essentially the same, robust performance no matter what may be the composition of the mix of tasks confronting the animal in the successive cycles of its meal. There is, in that case, no need for the animal to have any precise information about the task requirements in any particular cycle. It need not—indeed it cannot, if the requirements are not known—tune its movements to that particular task. Conversely, it should pay little attention to the success or failure of any particular cycle. To the extent that the task requirements are unknown and might vary unpredictably from one cycle to the next, success or failure in one cycle will have little predictive value for success or failure in the next cycle. Clearly, the overall strategy relies, at some fundamental level, on “knowledge” about the feeding environment—about the range of likely tasks, and the statistics of their variability—that is built into the dynamics of the feeding system presumably by evolution (see Proekt et al. 2004; Brezina et al. 2005a). Expecting that fundamental knowledge to be correct, however, the system can operate in a self-contained, autonomous manner, paying little attention, certainly on a cycle-by-cycle basis, to the animal’s environment or the outcome of its own actions.
Our results in Figs. 7 and 8 are very consistent with this picture. The CPG appears to generate a relatively fixed degree of absolute variability in the internal parameters of the system, which emerges in the feeding movements and performance (Figs. 7C and 8A). If the movements happen to be on the whole successful, then the absolute variability assumes a smaller relative significance—the performance appears more regular. If the movements are less successful, the variability assumes a larger relative significance—the performance varies more from one cycle to the next (Fig. 7B). However, the CPG continues to generate, on average, the same degree of absolute variability regardless of the degree of success, and the degree of variability does not determine the degree of success (Fig. 8, B and C). Variable movements are as successful as regular movements.
However, variable movements are not more successful than regular movements, and in general the lack of coupling between variability and success, while consistent with the operation of the variable feeding strategy under these circumstances, provides no particular further insight into it. This is the drawback of the fact that in all experiments analyzed in this paper we tested the animals in the same, fixed feeding environment, always with the same, regular seaweed strip. We did this to test unambiguously, without any confounding variability reflecting that of the environment, the critical prediction that the internal variability generated by the CPG emerges in the behavior. And indeed, it is remarkable that even in the completely regular environment, faced with a completely regular, constant feeding task, the CPG still continues to generate large variability. The modeling studies (Brezina et al. 2005a,b) suggest that, with a regular task, regular movements will perform better (although not much better) than variable movements—provided the task requirements are known so that the movements can be specifically tuned to them.9 In this light, the continuing production of variable movements suggests that, as proposed by the variable strategy scenario, the task requirements are not known, or, more generally, are disregarded by the system because the system has evolved to operate in—its built-in “knowledge” leads it to expect—a variable environment. To dissect further the contribution of the variability to the success of the behavior we must therefore study the behavior in a variable environment. Furthermore, we must not merely let the system run spontaneously as we did here, but we must analytically perturb either the generation of the internal variability, for which methods may exist (Horn et al. 2004), or the variability of the environment, for instance by varying the temporal sequence of seaweed strip widths (Fig. 9), or both, to examine the mutual relationship of the two types of variability and their effect on performance. The simple, robust performance measurement technique that we have developed in this paper now gives us the tool to do such experiments.
Acknowledgments
We thank Dr. F. S. Vilim for help with video conversion and the reviewers of the paper for helpful suggestions. This work was funded by NIH grant R01 NS41497 to V.B.
Footnotes
It could be argued that the stimulus was not constant because, once inside the mouth and esophagus, the seaweed strip might have fragmented in a complex manner, adding, perhaps, a varying component to the overall stimulus experienced by the animal in each cycle. This cannot be completely ruled out. However, preliminary experiments show that variability of electrical activity and functional performance very much like that described in this paper is seen also when the animal swallows plastic tubing—smooth-surfaced, relatively large-diameter (e.g., 2-mm) tubing, of which the animal can be induced to swallow many centimeters, that bends but not very freely, so that, once a length has been swallowed, it must run clear through the mouth and esophagus deeply into the gut. This tubing certainly does not fragment: it can be pulled out (or is eventually rejected by the animal itself) completely intact. In any case, variation of this type, where the animal’s own response in previous cycles, rather than an intrinsically varying environment, may alter the effective stimulus or functional task in subsequent cycles, is a type of variation that we wish, on some level, to include in our analysis.
Much of the buccal nerve 2 activity also probably represents firing of feeding-related motor neurons that participate in radula retraction and jaw closure, such as identified motor neuron B10 (Morton and Chiel 1993a,b).
Such electrical activity recorded in the ARC muscle has in previous work been decomposed into the firing frequencies of the motor neurons B15 and B16 that were then used to reconstruct the muscle contraction shapes (Brezina et al. 2005a), but for simplicity we chose not to do so formally in this paper.
Horizontal movement of the head was ignored, and its movement in the third dimension, toward or away from the camera, would not have been seen by the camera at all. However, head movement in either of these dimensions, orthogonal to the direction of movement of the seaweed strip, would have contributed little to the strip movement registered by the length transducer.
Certainly the combined spikes in buccal nerve 2, but probably even the separate classes, as well as the peaks or spikes in the ARC muscle record represent the firing not of individual neurons but of populations; the frequencies are therefore higher, aggregate frequencies and are marked as such in all of the figures. When, furthermore, we refer to the ARC “spikes,” ARC “firing”, or ARC “frequency,” it must be remembered that these spikes, firing, and frequency are those of the ARC motor neurons, as reflected in the ARC muscle record, not of the ARC muscle itself, which does not spike at all (Cohen et al. 1978).
As discussed by Horn et al. (2004), profiles computed in this way, independently at each timepoint, somewhat exaggerate the variability: the waveforms of the individual cycles in the dataset are expected to be less extreme than the corresponding percentile profiles of the ensemble. However, the variability of the individual cycles, seen for example in the distributions of their representative parameters in Fig. 4A, is still very substantial.
Simply normalizing the absolute values by their mean in each strip, even before taking the cycle-to-cycle differences, already produced correlations (not shown) almost as strong as those in Fig. 5C.
Since the variability index correlates with the standard deviation of the cycle-to-cycle differences of the seaweed swallowed (Fig. 8A), yet does not correlate with the mean seaweed swallowed (Fig. 8B), this suggests that in this case, in contrast to Fig. 7, B and C, the variability index should correlate also with the standard deviation of the absolute lengths of seaweed swallowed. Indeed, this was so: the plot was similar to that in Fig. 8A, with a highly significant difference (p < 0.00001) and “large” d between the absolute standard deviations of the 10% of the strips with the lowest and highest values of the variability index.
In this context, it might be thought that, in the analysis in Figs. 7 and 8, strips that by chance happened to be more swallowed with more regular movements—thus matching the regular feeding task represented by the strip—would be swallowed more successfully. Figs. 7C and 8B show no evidence of this, however, and they are unlikely to do so because, by chance, the regular movements will still not be tuned to the correct task requirements.
References
- Beer RD, Chiel HJ, Gallagher JC. Evolution and analysis of model CPGs for walking: II. General principles and individual variability. J Comput Neurosci. 1999;7:119–147. doi: 10.1023/a:1008920021246. [DOI] [PubMed] [Google Scholar]
- Bernstein N.The Co-ordination and Regulation of Movement. Oxford: Pergamon Press, 1967.
- Brezina V, Horn CC, Weiss KR. Modeling neuromuscular modulation in Aplysia. III. Interaction of central motor commands and peripheral modulatory state for optimal behavior. J Neurophysiol. 2005a;93:1523–1556. doi: 10.1152/jn.00475.2004. [DOI] [PubMed] [Google Scholar]
- Brezina V, Orekhova IV, Weiss KR. The neuromuscular transform: the dynamic, nonlinear link between motor neuron firing patterns and muscle contraction in rhythmic behaviors. J Neurophysiol. 2000a;83:207–231. doi: 10.1152/jn.2000.83.1.207. [DOI] [PubMed] [Google Scholar]
- Brezina V, Orekhova IV, Weiss KR. Optimization of rhythmic behaviors by modulation of the neuromuscular transform. J Neurophysiol. 2000b;83:260–279. doi: 10.1152/jn.2000.83.1.260. [DOI] [PubMed] [Google Scholar]
- Brezina V, Orekhova IV, Weiss KR. Neuromuscular modulation in Aplysia. II. Modulation of the neuromuscular transform in behavior. J Neurophysiol. 2003;90:2613–2628. doi: 10.1152/jn.01093.2002. [DOI] [PubMed] [Google Scholar]
- Brezina V, Proekt A, and Weiss KR. Cycle-to-cycle variability as an optimal behavioral strategy. Neurocomputing, submitted, 2005b. [DOI] [PMC free article] [PubMed]
- Brezina V, Weiss KR. The neuromuscular transform constrains the production of functional rhythmic behaviors. J Neurophysiol. 2000;83:232–259. doi: 10.1152/jn.2000.83.1.232. [DOI] [PubMed] [Google Scholar]
- Cohen J. A power primer. Psychol Bull. 1992;112:155–159. doi: 10.1037//0033-2909.112.1.155. [DOI] [PubMed] [Google Scholar]
- Cohen JL, Weiss KR, Kupfermann I. Motor control of buccal muscles in Aplysia. J Neurophysiol. 1978;41:157–180. doi: 10.1152/jn.1978.41.1.157. [DOI] [PubMed] [Google Scholar]
- Cropper EC, Kupfermann I, Weiss KR. Differential firing patterns of the peptide-containing cholinergic motor neurons B15 and B16 during feeding behavior in Aplysia. Brain Res. 1990a;522:176–179. doi: 10.1016/0006-8993(90)91598-b. [DOI] [PubMed] [Google Scholar]
- Cropper EC, Price D, Tenenbaum R, Kupfermann I, Weiss KR. Release of peptide cotransmitters from a cholinergic motor neuron under physiological conditions. Proc Natl Acad Sci USA. 1990b;87:933–937. doi: 10.1073/pnas.87.3.933. [DOI] [PMC free article] [PubMed] [Google Scholar]
- Dembrow NC, Jing J, Brezina V, Weiss KR. A specific synaptic pathway activates a conditional plateau potential underlying protraction phase in the Aplysia feeding central pattern generator. J Neurosci. 2004;24:5230–5238. doi: 10.1523/JNEUROSCI.5649-03.2004. [DOI] [PMC free article] [PubMed] [Google Scholar]
- Dembrow NC, Jing J, Proekt A, Romero A, Vilim FS, Cropper EC, Weiss KR. A newly identified buccal interneuron initiates and modulates feeding motor programs in Aplysia. J Neurophysiol. 2003;90:2190–2204. doi: 10.1152/jn.00173.2003. [DOI] [PubMed] [Google Scholar]
- de Ruyter van Steveninck RR, Lewen GD, Strong SP, Koberle R, Bialek W. Reproducibility and variability in neural spike trains. Science. 1997;275:1805–1808. doi: 10.1126/science.275.5307.1805. [DOI] [PubMed] [Google Scholar]
- Drushel RF, Neustadter DM, Hurwitz I, Crago PE, Chiel HJ. Kinematic models of the buccal mass of Aplysia californica. J Exp Biol. 1998;201:1563–1583. doi: 10.1242/jeb.201.10.1563. [DOI] [PubMed] [Google Scholar]
- Drushel RF, Neustadter DM, Shallenberger LL, Crago PE, Chiel HJ. The kinematics of swallowing in the buccal mass of Aplysia californica. J Exp Biol. 1997;200:735–752. doi: 10.1242/jeb.200.4.735. [DOI] [PubMed] [Google Scholar]
- Due MR, Jing J, Weiss KR. Dopaminergic contributions to modulatory functions of a dual-transmitter interneuron in Aplysia. Neurosci Lett. 2004;358:53–57. doi: 10.1016/j.neulet.2003.12.058. [DOI] [PubMed] [Google Scholar]
- Elliott CJH, Susswein AJ. Comparative neuroethology of feeding control in molluscs. J Exp Biol. 2002;205:877–896. doi: 10.1242/jeb.205.7.877. [DOI] [PubMed] [Google Scholar]
- Friedman AK, Rosen SC, and Kupfermann I. Rasp vs. grasp: parametric differences between two modes of ingestive feeding behavior in Aplysia Program 67.26, 2002 Abstract Viewer Washington, DC: Society for Neuroscience, online, 2002.
- Friedman H. Magnitude of experimental effect and a table for its rapid estimation. Psychol Bull. 1968;70:245–251. [Google Scholar]
- Hooper SL. Variation is the spice of life. Focus on “Cycle-to-cycle variability of neuromuscular activity in Aplysia feeding behavior. J Neurophysiol. 2004;92:40–41. doi: 10.1152/jn.00182.2004. [DOI] [PubMed] [Google Scholar]
- Hoover NJ, Weaver AL, Harness PI, Hooper SL. Combinatorial and cross-fiber averaging transform muscle electrical responses with a large stochastic component into deterministic contractions. J Neurosci. 2002;22:1895–1904. doi: 10.1523/JNEUROSCI.22-05-01895.2002. [DOI] [PMC free article] [PubMed] [Google Scholar]
- Horn CC, Kupfermann I. Egestive feeding responses in Aplysia persist after sectioning of the cerebral-buccal connectives: evidence for multiple sites of control of motor programs. Neurosci Lett. 2002;323:175–178. doi: 10.1016/s0304-3940(02)00155-6. [DOI] [PubMed] [Google Scholar]
- Horn CC, Zhurov Y, Orekhova IV, Proekt A, Kupfermann I, Weiss KR, Brezina V. Cycle-to-cycle variability of neuromuscular activity in Aplysia feeding behavior. J Neurophysiol. 2004;92:157–180. doi: 10.1152/jn.01190.2003. [DOI] [PubMed] [Google Scholar]
- Hurwitz I, Kupfermann I, Weiss KR. Fast synaptic connections from CBIs to pattern-generating neurons in Aplysia: initiation and modification of motor programs. J Neurophysiol. 2003;89:2120–2136. doi: 10.1152/jn.00497.2002. [DOI] [PubMed] [Google Scholar]
- Hurwitz I, Neustadter D, Morton DW, Chiel HJ, Susswein AJ. Activity patterns of the B31/B32 pattern initiators innervating the I2 muscle of the buccal mass during normal feeding movements in Aplysia californica. J Neurophysiol. 1996;75:1309–1326. doi: 10.1152/jn.1996.75.4.1309. [DOI] [PubMed] [Google Scholar]
- Hurwitz I, Susswein AJ. Adaptation of feeding sequences in Aplysia oculifera to changes in the load and width of food. J Exp Biol. 1992;166:215–235. [Google Scholar]
- Jing J, Cropper EC, Hurwitz I, Weiss KR. The construction of movement with behavior-specific and behavior-independent modules. J Neurosci. 2004;24:6315–6325. doi: 10.1523/JNEUROSCI.0965-04.2004. [DOI] [PMC free article] [PubMed] [Google Scholar]
- Jing J, Vilim FS, Wu J-S, Park J-H, Weiss KR. Concerted GABAergic actions of Aplysia feeding interneurons in motor program specification. J Neurosci. 2003;23:5283–5294. doi: 10.1523/JNEUROSCI.23-12-05283.2003. [DOI] [PMC free article] [PubMed] [Google Scholar]
- Jing J, Weiss KR. Interneuronal basis of the generation of related but distinct motor programs in Aplysia: implications for current neuronal models of vertebrate intralimb coordination. J Neurosci. 2002;22:6228–6238. doi: 10.1523/JNEUROSCI.22-14-06228.2002. [DOI] [PMC free article] [PubMed] [Google Scholar]
- Kabotyanski EA, Baxter DA, Cushman SJ, Byrne JH. Modulation of fictive feeding by dopamine and serotonin in Aplysia. J Neurophysiol. 2000;83:374–392. doi: 10.1152/jn.2000.83.1.374. [DOI] [PubMed] [Google Scholar]
- Kara P, Reinagel P, Reid RC. Low response variability in simultaneously recorded retinal, thalamic, and cortical neurons. Neuron. 2000;27:635–646. doi: 10.1016/s0896-6273(00)00072-6. [DOI] [PubMed] [Google Scholar]
- Kirk RE. Practical significance: a concept whose time has come. Educ Psychol Measurement. 1996;56:746–759. [Google Scholar]
- Kjellberg K, Lindbeck L, Hagberg M. Method and performance: two elements of work technique. Ergonomics. 1998;41:798–816. doi: 10.1080/001401398186658. [DOI] [PubMed] [Google Scholar]
- Kupfermann I. Feeding behavior in Aplysia: a simple system for the study of motivation. Behav Biol. 1974;10:1–26. doi: 10.1016/s0091-6773(74)91644-7. [DOI] [PubMed] [Google Scholar]
- Kupfermann I, Brezina V, Cropper EC, Deodhar D, Probst WC, Rosen SC, Vilim FS, and Weiss KR. Reconfiguration of the peripheral plant during various forms of feeding behaviors in the mollusc Aplysia In: Neurons, Networks, and Motor Behavior, edited by Stein PSG, Grillner S, Selverston AI, and Stuart DG. Cambridge, MA: MIT Press, 1997, p. 217–222.
- Masani K, Kouzaki M, Fukunaga T. Variability of ground reaction forces during treadmill walking. J Appl Physiol. 2002;92:1885–1890. doi: 10.1152/japplphysiol.00969.2000. [DOI] [PubMed] [Google Scholar]
- Morgan PT, Jing J, Vilim FS, Weiss KR. Interneuronal and peptidergic control of motor pattern switching in Aplysia. J Neurophysiol. 2002;87:49–61. doi: 10.1152/jn.00438.2001. [DOI] [PubMed] [Google Scholar]
- Morgan PT, Perrins R, Lloyd PE, Weiss KR. Intrinsic and extrinsic modulation of a single central pattern generating circuit. J Neurophysiol. 2000;84:1186–1193. doi: 10.1152/jn.2000.84.3.1186. [DOI] [PubMed] [Google Scholar]
- Morton DW, Chiel HJ. In vivo buccal nerve activity that distinguishes ingestion from rejection can be used to predict behavioral transitions in Aplysia. J Comp Physiol A. 1993a;172:17–32. doi: 10.1007/BF00214712. [DOI] [PubMed] [Google Scholar]
- Morton DW, Chiel HJ. The timing of activity in motor neurons that produce radula movements distinguishes ingestion from rejection in Aplysia. J Comp Physiol A. 1993b;173:519–536. doi: 10.1007/BF00197761. [DOI] [PubMed] [Google Scholar]
- Nargeot R, Baxter DA, Byrne JH. Contingent-dependent enhancement of rhythmic motor patterns: an in vitro analog of operant conditioning. J Neurosci. 1997;17:8093–8105. doi: 10.1523/JNEUROSCI.17-21-08093.1997. [DOI] [PMC free article] [PubMed] [Google Scholar]
- Nargeot R, Baxter DA, Byrne JH. In vitro analog of operant conditioning in Aplysia I Contingent reinforcement modifies the functional dynamics of an identified neuron. J Neurosci. 1999;19:2247–2260. doi: 10.1523/JNEUROSCI.19-06-02247.1999. [DOI] [PMC free article] [PubMed] [Google Scholar]
- Neustadter DM, Drushel RF, Chiel HJ. Kinematics of the buccal mass during swallowing based on magnetic resonance imaging in intact, behaving Aplysia californica. J Exp Biol. 2002a;205:939–958. doi: 10.1242/jeb.205.7.939. [DOI] [PubMed] [Google Scholar]
- Neustadter DM, Drushel RF, Crago PE, Adams BW, Chiel HJ. A kinematic model of swallowing in Aplysia californica based on radula/odontophore kinematics and in vivo magnetic resonance images. J Exp Biol. 2002b;205:3177–3206. doi: 10.1242/jeb.205.20.3177. [DOI] [PubMed] [Google Scholar]
- Olejnik S, Algina J. Measures of effect size for comparative studies: applications, interpretations, and limitations. Contemp Educ Psychol. 2000;25:241–286. doi: 10.1006/ceps.2000.1040. [DOI] [PubMed] [Google Scholar]
- Owings TM, Grabiner MD. Variability of step kinematics in young and older adults. Gait Posture. 2004;20:26–29. doi: 10.1016/S0966-6362(03)00088-2. [DOI] [PubMed] [Google Scholar]
- Plesh O, Bishop B, McCall W. Mandibular movements and jaw muscles’ activity while voluntarily chewing at different rates. Exp Neurol. 1987;98:285–300. doi: 10.1016/0014-4886(87)90243-3. [DOI] [PubMed] [Google Scholar]
- Plesh O, Bishop B, McCall WD. Comparison of automatic and voluntary chewing patterns and performance. Exp Neurol. 1988;99:326–341. doi: 10.1016/0014-4886(88)90151-3. [DOI] [PubMed] [Google Scholar]
- Proekt A, Brezina V, Weiss KR. Dynamical basis of intentions and expectations in a simple neuronal network. Proc Natl Acad Sci USA. 2004;101:9447–9452. doi: 10.1073/pnas.0402002101. [DOI] [PMC free article] [PubMed] [Google Scholar]
- Proekt A, Weiss KR. Convergent mechanisms mediate preparatory states and repetition priming in the feeding network of Aplysia. J Neurosci. 2003;23:4029–4033. doi: 10.1523/JNEUROSCI.23-10-04029.2003. [DOI] [PMC free article] [PubMed] [Google Scholar]
- Selverston AI, Rabinovich MI, Abarbanel HDI, Elson R, Szücs A, Pinto RD, Huerta R, Varona P. Reliable circuits from irregular neurons: a dynamical approach to understanding central pattern generators. J Physiol (Paris) 2000;94:357–374. doi: 10.1016/s0928-4257(00)01101-3. [DOI] [PubMed] [Google Scholar]
- Shadlen MN, Newsome WT. The variable discharge of cortical neurons: implications for connectivity, computation, and information coding. J Neurosci. 1998;18:3870–3896. doi: 10.1523/JNEUROSCI.18-10-03870.1998. [DOI] [PMC free article] [PubMed] [Google Scholar]
- Shaffer JP. Multiple hypothesis testing. Annu Rev Psychol. 1995;46:561–584. [Google Scholar]
- Shetreat-Klein AN, Cropper EC. Afferent-induced changes in rhythmic motor programs in the feeding circuitry of Aplysia. J Neurophysiol. 2004;92:2312–2322. doi: 10.1152/jn.00137.2004. [DOI] [PubMed] [Google Scholar]
- Sparks DL, Kristan WB, and Shaw BK. The role of population coding in the control of movement. In Neurons, Networks, and Motor Behavior, ed Stein PSG, Grillner S, Selverston AI, Stuart DG, p 21–32. Cambridge, MA: MIT Press, 1997.
- Stevens CF, Zador AM. Input synchrony and the irregular firing of cortical neurons. Nature Neurosci. 1998;1:210–217. doi: 10.1038/659. [DOI] [PubMed] [Google Scholar]
- Susswein AJ, Rosen SC, Gapon S, Kupfermann I. Characterization of buccal motor programs elicited by a cholinergic agonist applied to the cerebral ganglion of Aplysia californica. J Comp Physiol A. 1996;179:509–524. doi: 10.1007/BF00192317. [DOI] [PubMed] [Google Scholar]
- Terrier P, Schutz Y. Variability of gait patterns during unconstrained walking assessed by satellite positioning (GPS) Eur J Appl Physiol. 2003;90:554–561. doi: 10.1007/s00421-003-0906-3. [DOI] [PubMed] [Google Scholar]
- von Neumann J. Probabilistic logics and the synthesis of reliable organisms from unreliable components. In: Automata Studies, edited by Shannon CE and McCarthy J. Princeton, NJ: Princeton Univ. Press, 1956, p. 43–98.
- Warzecha A-K, Egelhaaf M. Variability in spike trains during constant and dynamic stimulation. Science. 1999;283:1927–1930. doi: 10.1126/science.283.5409.1927. [DOI] [PubMed] [Google Scholar]
- Weiss KR, Chiel HJ, Koch U, Kupfermann I. Activity of an identified histaminergic neuron, and its possible role in arousal of feeding behavior in semi-intact Aplysia. J Neurosci. 1986;6:2403–2415. doi: 10.1523/JNEUROSCI.06-08-02403.1986. [DOI] [PMC free article] [PubMed] [Google Scholar]
- Wintergerst AM, Buschang PH, Throckmorton GS. Reducing within-subject variation in chewing cycle kinematics—a statistical approach. Arch Oral Biol. 2004;49:991–1000. doi: 10.1016/j.archoralbio.2004.07.010. [DOI] [PubMed] [Google Scholar]
- Wu J-S, Jing J, Díaz-Ríos M, Miller MW, Kupfermann I, Weiss KR. Identification of a GABA-containing cerebral-buccal interneuron 11 in Aplysia californica. Neurosci Lett. 2003;341:5–8. doi: 10.1016/s0304-3940(03)00052-1. [DOI] [PubMed] [Google Scholar]
- Wu J-Y, Tsau Y, Hopp H-P, Cohen LB, Tang AC, Falk CX. Consistency in nervous systems: trial-to-trial and animal-to-animal variations in the responses to repeated applications of a sensory stimulus in Aplysia. J Neurosci. 1994;14:1366–1384. doi: 10.1523/JNEUROSCI.14-03-01366.1994. [DOI] [PMC free article] [PubMed] [Google Scholar]
- Zhurov Y, Proekt A, Weiss KR, Brezina V. Changes of internal state are expressed in coherent shifts of neuromuscular activity in Aplysia feeding behavior. J Neurosci. 2005a;25:1268–1280. doi: 10.1523/JNEUROSCI.3361-04.2005. [DOI] [PMC free article] [PubMed] [Google Scholar]
- Zhurov Y, Weiss KR, and Brezina V. Intraburst variability of motor neuron spike timing shapes contractions of the ARC muscle of Aplysia Abstract 537.5, 2004 Abstract Viewer Washington, DC: Society for Neuroscience, online, 2004.
- Zhurov Y, Weiss KR, and Brezina V. Tight or loose coupling between components of the feeding neuromusculature of Aplysia? J Neurophysiol 10.1152/jn.01338.2004 (March 9, 2005), online, 2005b. [DOI] [PubMed]
- Zoccolan D, Pinato G, Torre V. Highly variable spike trains underlie reproducible sensorimotor responses in the medicinal leech. J Neurosci. 2002;22:10790–10800. doi: 10.1523/JNEUROSCI.22-24-10790.2002. [DOI] [PMC free article] [PubMed] [Google Scholar]