

Abstract
OBJECTIVE
To characterize structural changes and the metabolic profile in the foot muscles and correlate them with diabetic neuropathy measurements using a phosphorus-31 (31P) rapid acquisition with relaxation enhancement (RARE) MRI method.
RESEARCH DESIGN AND METHODS
Twelve control subjects, nine non-neuropathic and 12 neuropathic diabetic patients were studied using 31P RARE and proton (1H) MRI at 3 Tesla. The ratio of the total cross-sectional area of the foot to that of the muscle tissue was calculated from trans-axial 1H and 31P images. The average 31P concentration across the metatarsal head region was measured from the 31P images.
RESULTS
The muscle/total-area ratio was different among all three groups: 0.55 ± 0.04 (means ± SD); 0.44 ± 0.05; and 0.06 ± 0.06 for controls, non-neuropathic and neuropathic subjects respectively, (p <0.0001). The average 31P concentration was also different among all groups: 27.7 ± 3.8 mM; 21.7 ± 4.8; and 7.9 ± 8.8 for controls, non-neuropathic and neuropathic subjects respectively, (p <0.0001). The muscle/total-area ratios strongly correlated with clinical measurements: Neuropathy Disability Score (NDS) (r = −0.83, p <0.0001), Vibration Perception Threshold (VPT) (r= −0.79, p <0.0001) and Semmes-Weinstein Monofilaments (SWM) (r = −0.87, p <0.0001).
CONCLUSIONS
Small muscle atrophy is present in diabetes before clinical peripheral neuropathy can be detected using standard techniques available in clinical practice. The 31P RARE MRI method evaluates the severity of muscle atrophy, even in the early stages when neuropathy is absent. This technique may prove a useful diagnostic tool that can identify early stage diabetic foot problems.
Keywords: peripheral neuropathy, small muscle atrophy, phosphorus MRI, RARE MRI
Atrophy of the small muscles of the foot is common in diabetes and is related to peripheral motor neuropathy (1). The atrophy is believed to be the main factor that is responsible for the development of an imbalance between the flexor and extensor muscles, which results in clawing of the toes, prominent metatarsal heads and the development of high foot pressures that play a direct role in the development of foot ulceration (2). Currently, there are no established methods to evaluate and follow the progress of small muscle atrophy in diabetic patients. As a result of the lack of such methods, little information is available regarding the onset of muscle changes and the natural history of their progression in diabetic patients.
The concentrations of the phosphorus-31 (31P) cellular metabolites in skeletal muscle change immediately with the onset of ischemia and return to normal levels quickly in viable muscle tissue upon reperfusion (3, 4). Thus a method that can accurately quantify the 31P metabolite concentrations in the muscle of the foot in vivo, and spatially map the resulting values to an anatomical radiological image of the foot would be a sensitive and direct indicator of the health of muscle tissue in the diabetic foot. Magnetic resonance imaging (MRI) and magnetic resonance spectroscopy (MRS) provide data for the non-invasive assessment of deep-lying soft tissue anatomy (5–7). Recent studies performed at our facility and elsewhere have demonstrated that the MRI pulse sequence known as rapid acquisition with relaxation enhancement (RARE), which was developed for 1H MRI can be modified to directly acquire images of human skeletal muscle and myocardium that are spatial mappings of the 31P metabolites with improved temporal and spatial resolution compared to 31P MRS methods (8–11).
In the present study, we have used a RARE MRI method to acquire 31P images of the forefeet of neuropathic diabetic patients, non-neuropathic diabetic patients and healthy control subjects. The main aims of the study were to characterize changes in the foot small muscles and correlate them with clinical measurements of diabetic neuropathy.
RESEARCH DESIGN AND METHODS
Subjects
Twelve neuropathic, nine non-neuropathic and 12 healthy non-diabetic subjects were included in the study. The diagnosis of type 1 or type 2 diabetes was established according to the recommendations of the American Diabetes Association (ADA) Expert Committee (12). Subjects with open lesions on their feet, peripheral vascular disease [symptoms of claudication and absence of peripheral pulses, ankle brachial index (ABI) < 0.7], any other serious chronic diseases requiring active treatment or a contraindication to MRI examination were excluded from the study. The study protocol was approved by the Institutional Review Board of Beth Israel Deaconess Medical Center and all participants gave written informed consent.
Methods
Clinical evaluation
The medical history evaluation included age, sex, weight, height, body mass index (BMI), history of alcohol consumption, type and duration of diabetes, and the presence of other micro- and macrovascular complications.
Neuropathy evaluation
The presence of diabetic peripheral neuropathy was defined according to the principles of the San Antonio Consensus criteria (13). For this, the Neuropathy Symptom Score (NSS) and the Neuropathy Disability Score (NDS) were evaluated as previously described (14). The Vibration Perception Threshold (VPT) was evaluated by the use of a biothesiometer (Biomedical Instruments, Newbury, Ohio). The Cutaneous Pressure Perception Threshold (CPPT) was also evaluated by the use of a set of eight Semmes-Weinstein monofilaments that apply a pressure from 1 to 100 grams. Details about these techniques have been described elsewhere (14). Neuropathy was diagnosed when two or more measurements were abnormal.
MRI Data Acquisition
Phosphorus-31 RARE and 1H MRI were performed on all of the study subjects using a 3T whole body MR scanner (General Electric Medical Systems, Milwaukee, WI). A “birdcage” RF coil was designed specifically for this application and constructed at our facility. The RF coil was designed to acquire both 31P and 1H MR data (15, 16). Thus, 31P images and high-resolution 1H registration images could be acquired without moving the subject’s foot, which resulted in improved registration of the 31P and 1H images. A reference standard containing an aqueous solution of 220 mM inorganic phosphate (Pi) was rigidly attached to the RF coil. The standard was present during all MR imaging and served two purposes: 1) the measurement of the 31P concentration and 2) as a fiduciary marker for the co-registration of 31P and 1H images. All of the acquisitions were performed in the axial plane. The subjects were placed on the scanning bed in the supine position with their knees elevated by approximately 30 cm using a foam cushion. One foot was placed into the birdcage radio frequency (RF) coil so that the metatarsal heads were at the center of the coil.
To acquire detailed images of the anatomy and to delineate regions of edema, fatty infiltration and scar tissue, T2-Weighted (T2-W) 1H spin-echo imaging was first performed on all of the subjects (TR = 1.5 s, TE = 30 ms, field-of-view (FOV) = 15 cm, matrix = 256 x 256, slice thickness = 2.5 mm, scan time = 6 min 24 s). Images oriented in the axial plane were acquired at each of 10 contiguous locations. The ten slice locations of the 1H acquisition were prescribed so that the maximum extent of coverage in the axial direction was identical to that of the single slice 31P RARE image acquisition described below.
Axial 31P image data were acquired using the RARE pulse sequence (2 echo trains, 32 echoes per echo train, receiver bandwidth = 4 KHz. TR = 12 s, FOV = 30 cm, matrix = 64 x 64, slice thickness = 25 mm, 10 signal averages, scan time = 4 min, voxel volume= 0.55 cm3). In the RARE pulse sequence the time spacing between the echoes can be adjusted to facilitate constructive or destructive interference of the 3 adenosine triposphate (ATP) resonances (10, 17). The echo spacing and effective TE were selected to maximize the destructive interference of the ATP resonances. This substantially suppressed the ATP contribution to the 31P images. The resulting image intensities where proportional to the combined concentrations of the Pi and PCr cellular metabolites.
Data Processing
Image data were analyzed using Interactive Data Language (IDL) software (Research Systems Inc., Boulder, CO). The background noise of each 31P image was measured and a threshold technique was used to eliminate it, leaving only the 31P signal from muscle and the reference standard. An outline of the muscle tissue and the reference standard was created by using a contour mapping function set to a single level that was equal to the noise threshold value. The 31P muscle outline was registered to one of the central 1H T2-W images using the reference standard as a fiduciary marker. The average 31P concentration values were measured and calculated using the 31P reference standard and a method previously described (10).
The in-plane area across the entire axial view of the foot was calculated for each subject. The ten 1H T2-W images were added together to create a single image that represented the range covered by the 31P imaging. The in-plane (cross-sectional) area of each pixel was calculated from knowledge of the image field-of-view and the number of pixels in the image (matrix size). The pixels that represented signal from the tissues of the foot were then counted and the resulting number was multiplied by the pixel size. The cross-sectional area of the muscle tissue was calculated by counting the number of pixels in the 31P images in the same manner.
Statistical analysis
The Minitab statistical package (Minitab, State College, Pennsylvania) for personal computers was used for the statistical analysis. The analysis of variance (ANOVA) test was used, followed by the Fisher’s test to identify differences among the various groups. Correlation between variables was tested using Pearson correlation analysis. All of the tests were two-tailed with an alpha set at 0.05. Data are presented as mean ± SD.
RESULTS
The clinical characteristics of the studied groups are shown in Table 1. A history of foot ulceration was present in 5 (50%) neuropathic diabetic patients. There was no history of foot ulceration in any participant included in the other two groups while there were no ulcers present in any participant of all three groups at the time of the study.
Table 1.
Characteristics of the study population
| Control Group (C) | Non-neuropathic group (D) | Neuropathic Group (DN) | |
|---|---|---|---|
| Total subjects | 12 | 9 | 10 |
| Age (years) | 52 ± 14 | 56 ± 8 | 51 ± 7 |
| Sex (M/F) | 8/4 | 6/3 | 8/2 |
| Body mass index | 29.6 ± 6.9 | 32.0 ± 6.0 | 33.0 ± 4.7 |
| Diabetes type (1/2) | -- | 0/7 | 2/8 |
| Diabetes duration (years) * | -- | 6 ± 6 | 23 ± 12 |
| Ankle Brachial Index¶ | 1.1 ± 0.1 | 1.1 ± 0.1 | 0.9 ± 0.2 |
| Neuropathy Symptom Score¶ | 0 ± 0 | 2 ± 2 | 4 ± 2 |
| Neuropathy Disability Score § | 0 ± 0 | 2 ± 1 | 13 ± 8 |
| Vibration Perception Threshold § | 8 ± 3 | 13 ± 6 | 37 ± 16 |
| Semmes-Weinstein monofilament § | 3.88 ± 0.36 | 4.08 ± 0.54 | 6.16 ± 0.77 |
Data are n or means ± SD. *: D vs DN, p <0.01, ¶: C, D vs DN, p < 0.01, §: C, D vs DN
p <0.0001
The 31P and 1H MRI images that were obtained using the 3T whole body MR scanner from a healthy, non-diabetic subject and a non-neuropathic diabetic patient, are shown in Figure 1. As described in the figure legend, despite the fact that no clinical neuropathy is present, changes can be clearly seen in both the 31P and 1H MRI images that were acquired from the diabetic patient, indicating that these changes precede the development of clinical neuropathy.
Figure 1.
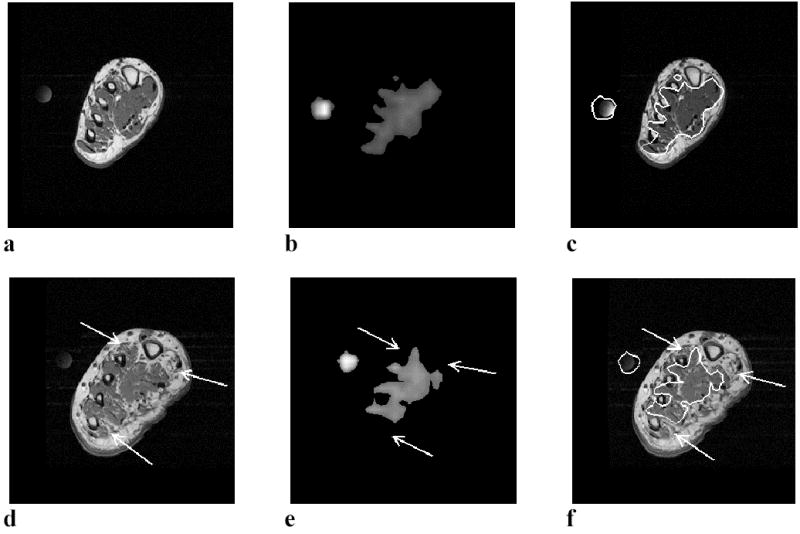
31Phosphorus and 1H MRI results of a normal control subject (a, b, and c) and a non-neuropathic diabetic patient (d, e, and f). The images in a and d, are 1H T2-W MR images that provide anatomical information while the b and e images are 31P images. The c and f images show the registration of the outline of the 31P images onto the 1H T2-W images. The circular object to the left of the foot in the images is the 31P reference standard, which was also used as a fiduciary marker to aid in the registration of the 31P outline to the 1H image. Muscle is the only tissue of the foot with enough 31P concentration to be detectable by MRI. Thus, the 31P images (b and e) represent only the muscle tissue and the 31P reference standard. Fat, bone and connective tissue do not appear in the 31P image. The non-neuropathic subject depicted in images d. e and f, had NDS, VPT and SWM values 2, 20 and 3.22 respectively. Although this subject is non-neuropathic, structural changes are clear in the 1H T2-W image (1d), where focal regions of fatty infiltration are visible near the large and small toes (arrows). The 31P concentration is absent in the regions of the 31P image (arrows in Fig. 1e) that correspond to the regions of fatty infiltration in 1H image. The average 31P concentration across the entire muscle area calculated from the signal intensity of the normal subject (b) is 28.2 millimolar (mM) while that of the non-neuropathic diabetic subject is 21.5 mM. The total-area/muscle-area ratio of the normal subject is 0.56 while that of the non-neuropathic diabetic subject is 0.44. The 31P/1H registration image (figure 1f) shows the correspondence between the regions of undetectable 31P concentration in Fig. 1e and the regions of fatty infiltration in the 1H image of Fig. 1d.
The results of the muscle-area/total-area ratio calculation were different among all three groups. The ratios were 0.55 ± 0.04 (mean ± SD) for the control group, 0.44 ± 0.05 for the non-neuropathic patients and 0.06 ± 0.06 for the neuropathic patients (p <0.0001) (Figure 2a). Differences in the average 31P concentration were also found to be different among all three groups. The results of the average 31P concentration measurements were 27.7 ± 3.8 mM for the control group, 21.7 ± 4.8 for the non-neuropathic patients and 7.9 ± 8.8 for the neuropathic patients (p <0.0001) (Figure 2b). No differences were observed between the measurements in males and females (data not shown).
Figure 2.
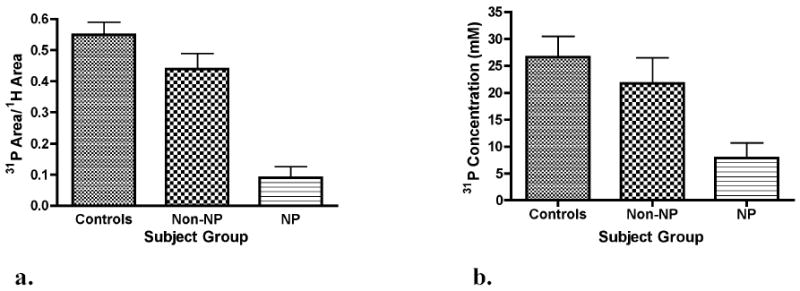
The ratio of muscle cross-sectional area to total cross-sectional area (a) and the mean 31P concentration (b) across the metatarsal head region of healthy control subjects, non-neuropathic diabetic (non-NP) and neuropathic (NP) subjects. Significant differences in the cross-sectional area ratios existed among all three groups with the mean area being higher in the control group and lower in the neuropathic group (p <0.0001). The mean 31P concentration was also significantly different among all three groups ((p <0.0001).
When all subjects were considered as one group, the muscle-area/total-area ratios strongly correlated to clinical measurements of the severity of neuropathy, including the Neuropathy Disability Score (NDS) (r = −0.83, p <0.0001) (figure 3), Vibration Perception Threshold (VPT) (r= −0.79, p <0.0001) and Semmes-Weinstein Monofilaments (SWM) (r = −0.87, p <0.0001). It also correlated with diabetes duration (r = −0.56, p <0.05) and ABI (r = 0.75, p <0.0001) while no correlations were observed with age or BMI. Multivariate regression analysis showed that only NDS was an independent factor.
Figure 3.
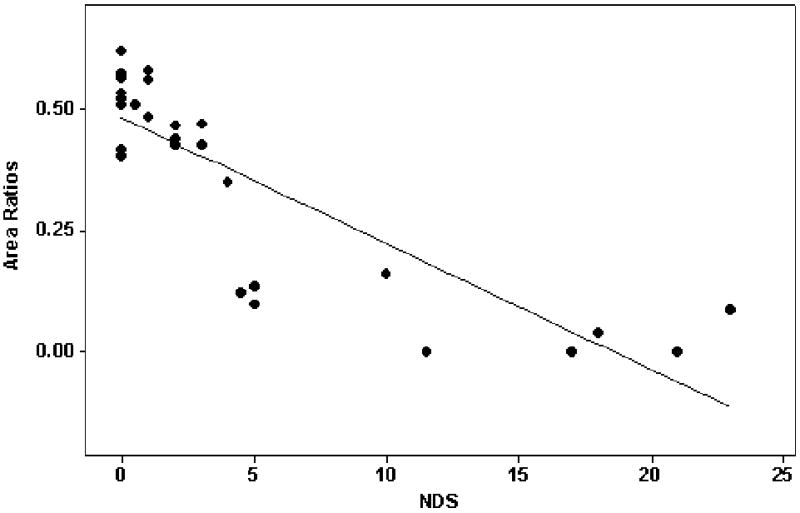
Plot of the ratio of muscle-area/total area against the Neuropathy Disability Score (NDS). A strong correlation was observed when all subjects were considered as one group (r = −0.83, p <0.0001).
The 31P concentration also correlated to NDS (r= −0.73, p <0.001), VPT (r= −0.69, p <0.05), SWM (r = −0.75, p <0.01) and ABI (r = 0.73, p <0.001). Multivariate regression analysis showed that only SWM was an independent factor.
CONCLUSIONS
In the present study, 31P RARE and 1H T2-W spin-echo MRI were performed on the feet of neuropathic patients, non-neuropathic patients and normal control subjects. A reduced ratio of viable muscle tissue to all other types of tissue was observed in the feet of both non-neuropathic and neuropathic diabetic patients as compared to normal controls. Similarly, a reduction was observed in the average 31P concentration in both the non-neuropathic and neuropathic diabetic patients when compared to the healthy non-diabetic control subjects. Furthermore, the observed changes strongly correlated with clinical measurements of peripheral nerve function, indicating an association between muscle atrophy and diabetic neuropathy. Our results indicate that muscle changes in the diabetic foot begin during the subclinical stage of diabetic neuropathy, before the development of clinical signs of the disease.
Small muscle atrophy is a well-known process in the diabetic foot and is related to the development of diabetic motor neuropathy. However, given the paucity of techniques that can quantify muscle atrophy, these changes have not been adequately studied. Instead, motor neuropathy has been mainly evaluated by measuring the motor peroneal conduction velocity while sensory neuropathy has been evaluated by employing quantitative sensory testing (18). As small muscle atrophy is the main process that leads to anatomical foot changes, such as clawing of the toes and prominent metatarsal heads, which are directly related to the development of foot ulceration, the direct evaluation of muscle changes rather than nerve function may prove more helpful in clinical research studies. More specifically, the evaluation of changes in the ratio of viable muscle tissue to all other types of foot tissues using 1H MRI and metabolic images based on the 31P cellular metabolite activity of muscle has the potential to allow the detection of both anatomical and metabolic changes and associate these changes to the development of foot ulceration and to the wound healing potential.
All previously published studies that have employed 1H MRI agree about the existence of small muscle atrophy in neuropathic diabetic patients (6, 7, 19, 20). However, there have been no reports of atrophy in non-neuropathic patients. We believe that the difference between our results and those of the previous studies is related to the employed techniques. Previous studies have utilized T1-W (20) or T2-W (6) imaging methods and T2 mapping techniques (6) to evaluate the cross-sectional area of muscle tissue. However, as muscle atrophy occurs, the T1 and T2 relaxation rates in regions containing muscle increase causing the different tissue types to become nearly iso-intense with each other. This obscures the tissue boundaries making it very difficult or impossible to segment or threshold the muscle tissue from adjacent tissues as acknowledged by the authors of one study (6). In contrast to segmentation and thresholding methods, the distinction between muscle tissue and other tissues in the foot using 31P RARE MRI is straight forward because muscle is the only tissue of the foot that has 31P concentrations that are detectable by MRI. Therefore, the 31P RARE method offers a more accurate evaluation of viable muscle tissue, which allowed us to identify relatively small changes that existed between the healthy non-diabetic subjects and the non-neuropathic patients.
In a recently published study, Andersen et al calculated the total volume of the muscles of the foot from 1H MRI by segmenting the muscle tissue using an image intensity threshold method (20). Although the total muscle volume was significantly reduced in neuropathic diabetic patients compared to control subjects, no difference was found between the non-neuropathic diabetic patients and the control group. As the total muscle volume is related to the foot size, the results of the above study may have been influenced by differences in the foot size among the various groups. In the present study we compared the ratio of the cross-sectional muscle area to the total cross-sectional area at the same location in the foot as this ratio gives a better indication of the amount of muscle loss by eliminating differences in foot size between population groups. In addition, we employed 31P RARE imaging, which provided a direct measurement of the amount of muscle tissue. This difference in methodological approach resulted in a sensitive technique that enabled us to detect differences in muscle atrophy between different groups more accurately. We believe that this was the main reason for the observed difference between our results and the results of the previous study.
Magnetic resonance spectroscopy (MRS) was employed in one previous study that examined changes between diabetic patients and healthy controls (5). The results of that study indicated changes in the 31P metabolites and an increased fat-to-water ratio in diabetic patients with superficial ulcers compared with diabetic patients without ulcers and healthy subjects while no differences were observed between diabetic patients without foot ulceration and healthy controls. As with the previous studies, we also believe that the difference between our findings and the results of the MRS study is related to the techniques employed. The 31P MRS method used in the previous study resulted in 31P data sets with a spatial resolution of 11.25 cm3 (requiring a scan time of more than fifty minutes) while in the present study the 31P images had a spatial resolution of 0.55 cm3 (requiring a scan time of four minutes). The improved spatial resolution of the 31P RARE method resulted in better identification of focal regions of reduced 31P concentration when compared to the previous MRS methods. In addition, the higher spatial resolution of the 31P RARE method allowed a more accurate delineation of the boundaries and contours of the muscle tissue providing better registration with 1H anatomical images and a more accurate measurement of muscle cross-sectional area.
The concentration of various 31P metabolites is also influenced by the presence of ischemia. Thus, when muscle is ischemic the concentration of phosphocreatine (PCr) decreases from its normal value while the concentration of inorganic phosphate (Pi) increases (3, 4). Preliminary ongoing studies at our facility indicate that the grading of the degree of ischemia is feasible and can be achieved by using the 31P RARE method to create separate PCr and Pi images in the diabetic foot. However, in the present study we used 31P RARE MRI to acquire data that reflected the combined concentrations of both PCr and Pi as we aimed to identify metabolically active muscle tissue and not to grade the degree of muscle ischemia.
In the present study, in agreement with previous studies, we observed strong correlations between quantitative clinical measurements of the severity of neuropathy and the muscle-area/total area ratio or 31P measurements (5, 20). In addition, strong correlations were observed between the muscle-area/total area ratio or 31P concentration measurements and the duration of diabetes and the ABI. However, as multiple regression analysis excluded these parameters as independent factors, it can be concluded that the severity of neuropathy was the only factor that influenced these measurements. Finally, there were no differences between males and females in the muscle-area/total area ratio or 31P measurements while no correlations were also noticed between BMI and the above measurements. These findings further indicate that the size of the foot did not influence the observed results.
A word of caution should be added at this point. The term “non-neuropathic diabetic patient” indicates a patient in whom there was no evidence of the existence of clinical neuropathy using standard techniques that are currently widely employed in clinical practice. However, the existence of subclinical neuropathy in these patients cannot be excluded. As previous studies using sophisticated experimental techniques have shown subclinical nerve function abnormalities in the vast majority of diabetic patients, it seems reasonable to suspect that such changes were also present in the non-neuropathic patients who participated in this study. Despite this, we believe that the results of our study are still interesting and the conclusions are still valid as they indicate changes in the foot muscles before the detection of changes in the nerve function using standard techniques that are available to the practicing clinician.
In summary, in the present study we have shown that small muscle atrophy is present in diabetes before clinical peripheral neuropathy can be detected using standard techniques available in clinical practice. The 31P RARE MRI method can adequately evaluate the severity of the muscle atrophy, even in the early stages when neuropathy is absent. Furthermore, the muscle tissue in patients can be non-invasively evaluated within a very short MRI examination time compared to existing localized MRS methods. This technique may prove a useful diagnostic tool that can facilitate the conduction of clinical trials in the early stages of diabetic foot problems as well as monitor the response to treatment.
Acknowledgments
The study was supported in part by a research grant by Juvenile Diabetes Research Foundation International (JDRF 5-2002-329), by a National Institutes of Health research grant (R01 HL0 75678-01) to AV, by a National Institutes of Health research grant (R21 DK58651) to RLG and in part by grant RR 01032 to the Beth Israel Deaconess Medical Center General Clinical Research Center from the National Institutes of Health.
References
- 1.Boulton A. The diabetic foot: from art to science. The 18th Camillo Golgi lecture. Diabetologia. 2004;47:1343–1353. doi: 10.1007/s00125-004-1463-y. [DOI] [PubMed] [Google Scholar]
- 2.Caselli A, Pham H, Giurini J, Armstrong D, Veves A: The forefoot/rearfoot plantar pressure ratio is increased in severe diabetic neuropathy and can predict foot ulceration. Diabetes Care 25, 2002 [DOI] [PubMed]
- 3.Hands L, Bore P, Galloway G, Morris P, Radda G. Muscle metabolism in patients with peripheral vascular disease investigated by 31P nuclear magnetic resonance spectroscopy. Clin Sci. 1986;71:283–290. doi: 10.1042/cs0710283. [DOI] [PubMed] [Google Scholar]
- 4.Martin P, Gibson H, Edwards R: MRS of Muscle. In MR Spectroscopy - Clinical Applications and Techniques Young I, Charles H, Eds., Martin Dunitz, Ltd., 1996
- 5.Suzuki E, Kashiwag A, Hidaka H, Maegawa H, Nishio Y, Kojima H, Haneda M, Yasuda H, Morikawa S, Inubushi T, Kikkawa R. 1H and 31P-magnetic resonance spectroscopy and imaging as a new diagnostic tool to evaluate neuropathic foot ulcers in type II diabetes. Diabetologia. 2000;43:165–172. doi: 10.1007/s001250050025. [DOI] [PubMed] [Google Scholar]
- 6.Bus SA, Yang QX, Wang JH, Smith MB, Wunderlich R, Cavanagh PR. Intrinsic muscle atrophy and toe deformity in the diabetic neuropathic foot: a magnetic resonance imaging study. Diabetes Care. 2002;25:1444–1450. doi: 10.2337/diacare.25.8.1444. [DOI] [PubMed] [Google Scholar]
- 7.Brash P, Fostert J, Vennart W, Anthony P, Tooke J. Magnetic resonance imaging techniques demonstrate soft tissue damage in the diabetic foot. Diabetic Medicine. 1999;16:55–61. doi: 10.1046/j.1464-5491.1999.00005.x. [DOI] [PubMed] [Google Scholar]
- 8.Greenman RL, Elliott MA, Vandenborne K, Schnall MD, Lenkinski RE. Fast imaging of phosphocreatine using a RARE pulse sequence. Magn Reson Med. 1998;39:851–854. doi: 10.1002/mrm.1910390523. [DOI] [PubMed] [Google Scholar]
- 9.Greenman RL, Axel L, Ferrari VA, Lenkinski RE. Fast imaging of phosphocreatine in the normal human myocardium using a three-dimensional RARE pulse sequence at 4 Tesla. J Magn Reson Imaging. 2002;15:467–472. doi: 10.1002/jmri.10081. [DOI] [PubMed] [Google Scholar]
- 10.Greenman RL. Quantification of the 31P metabolite concentration in human skeletal muscle from RARE signal intensity. Magn Reson Med. 2004;52:1036–1042. doi: 10.1002/mrm.20258. [DOI] [PubMed] [Google Scholar]
- 11.Chao H, Bowers JL, Holtzman D, Mulkern RV. RARE imaging of PCr in human forearm muscles. J Magn Reson Imaging. 1997;7:1048–1055. doi: 10.1002/jmri.1880070617. [DOI] [PubMed] [Google Scholar]
- 12.The Expert Committee on the Diagnosis and Classification of Diabetes Mellitus Report of the Expert Committee on the Diagnosis and Classification of Diabetes Mellitus. Diabetes Care. 1997;20:1183–1197. doi: 10.2337/diacare.20.7.1183. [DOI] [PubMed] [Google Scholar]
- 13.Consensus Statement 1988 Report and Recommendations of the San Antonio Conference on Diabetic Neuropathy. Diabetes 37:1000–1004, 1988 [DOI] [PubMed]
- 14.Pham H, Armstrong DG, Harvey C, Harkless LB, Giurini JM, Veves A. Screening techniques to identify people at high risk for diabetic foot ulceration: a prospective multicenter trial. Diabetes Care. 2000;23:606–611. doi: 10.2337/diacare.23.5.606. [DOI] [PubMed] [Google Scholar]
- 15.Hayes CE, Edelstein WA, Schenck JF, Mueller OM, Eash M. An efficient, highly homogeneous radiofrequency coil for whole-body NMR imaging at 1. 5 T J Magn Reson. 1985;63:622–628. [Google Scholar]
- 16.Isaac G, Schnall M, Lenkinski R, Vogele K. A design for a double-tuned birdcage coil for use in an integrated MRI/MRS examination. J Magn Reson. 1990;89:41–50. [Google Scholar]
- 17.Chao MS, Bowers JL, Holtzman D, Mulkern RV. Multi-echo 31P spectroscopic imaging of ATP: A scan time reduction strategy. J Magn Reson Imaging. 1997;7:425–433. doi: 10.1002/jmri.1880070229. [DOI] [PubMed] [Google Scholar]
- 18.Veves A: Diagnosis of diabetic neuropathy. In The Clinical Management of Diabetic Neuropathy Veves A, Ed. Totowa, NJ, Humana Press, 1998, p. 61–75
- 19.Andersen H, Gadeberg P, Brock B, Jakobsen J. Muscular atrophy in diabetic neuropathy: a stereological magnetic resonance imaging study. Diabetologia. 1997;40:1062–1069. doi: 10.1007/s001250050788. [DOI] [PubMed] [Google Scholar]
- 20.Andersen H, Gjerstad M, Jakobsen J. Atrophy of foot muscles: a measure of diabetic neuropathy. Diabetes Care. 2004;27:2382–2385. doi: 10.2337/diacare.27.10.2382. [DOI] [PubMed] [Google Scholar]