

Abstract
Biotin affects the abundance of mRNA coding for approximately 10% of genes expressed in human-derived hepatocarcinoma (HepG2) cells. Here, we determined whether effects of biotin on gene expression are associated with changes in the abundance of distinct proteins in cell signaling and structure. HepG2 cells were cultured in media containing the following concentrations of biotin: 0.025 nmol/L (denoted “deficient”), 0.25 nmol/L (“physiological” = control), and 10 nmol/L (“pharmacological”) for 10 d before harvesting. The abundance of 1,009 proteins from whole cell extracts was quantified by using high-throughput immunoblots. The abundance of 44 proteins changed by at least 25% in biotin-deficient and biotin-supplemented cells compared with physiological controls. One-third of these proteins participate in cell signaling. Specifically, proteins associated with receptor tyrosine kinase-mediated signaling were identified as targets of biotin; the abundance of these proteins was greater in biotin-deficient cells compared with controls. This was associated with increased DNA-binding activities of transcription factors Fos and Jun, and increased expression of a reporter gene driven by AP1-binding elements in biotin-deficient cells compared with physiological controls. The abundance of selected signaling proteins was not paralleled by the abundance of mRNA, suggesting that biotin affects expression of these genes at a posttranscriptional step. Additional clusters of biotin-responsive proteins were identified that play roles in cytoskeleton homeostasis, nuclear structure and transport, and neuroscience. This study is consistent with the existence of clusters of biotin-responsive proteins in distinct biological processes, including signaling by Fos/Jun; the latter might mediate pro-inflammatory and anti-apoptotic effects of biotin deficiency.
Keywords: biotin, cell signaling, HepG2 cells, human, tyrosine kinase
INTRODUCTION
In mammals, biotin serves as a covalently bound coenzyme for acetyl-CoA carboxylase, pyruvate carboxylase, propionyl-CoA carboxylase (PCC)4, and 3-methylcrotonyl-CoA carboxylase (1). These enzymes catalyze essential steps in the metabolism of glucose, amino acids, and fatty acids (1). Biotin deficiency is associated with decreased carboxylase activities in humans (2) and other species (3, 4). Consistent with the essential roles of carboxylases in intermediary metabolism, biotin deficiency may decrease rates of cell proliferation (5, 6), impair immune function (7–9), and derange fetal development (10–12).
Biotin also plays an important role in cell signaling, mediating some of the adverse effects of biotin deficiency and overdose. DNA microarrays have aided in the identification of 270 and 1,803 biotin-dependent genes in human lymphocytes and hepatocarcinoma (HepG2) cells, respectively (13, 14). Effects of biotin on gene expression are mediated by various cell signals, including the transcription factors NF-κB, (15), Sp1 and Sp3 (16), the biotin metabolite biotinyl-AMP (17), and the covalent linkage of biotin to histones (DNA-binding proteins) (18).
The abundance of a given protein is not only determined by the transcriptional activity of the corresponding gene but also by posttranscriptional events. We have provided evidence that the expression of some ribosomal proteins and eukaryotic translation initiation factor 5A is greater in biotin-deficient HepG2 cells compared with biotin-sufficient controls (14); theoretically, this may increase the translational activity in biotin-deficient cells. Moreover, we have provided evidence that supplementation of human cells with pharmacological doses of biotin impairs the posttranslational processing of proteins in the endoplasmic reticulum (J. B. Griffin and J. Zempleni, unpublished observation). These effects of biotin are mediated by decreased expression of sarco/endoplasmic reticulum ATPase3, diminishing transport of calcium from the cytoplasm into the endoplasmic reticulum. A low concentration of calcium in the endoplasmic reticulum impairs protein folding by calcium-dependent calnexin (19, 20), BiP (21), and protein disulfide isomerase (21). This is associated with high proteolytic activity (22), increased expression of chaperones that mediate protein folding (23, 24), and low overall translational activity (25).
In the present study we tested the hypothesis that biotin affects the abundance of distinct proteins in HepG2 cells. Specifically, we focused on signaling proteins, given that biotin-dependent synthesis of these proteins may have important effects on the transcriptional activity of numerous genes (15, 16, 26). For protein analysis we applied a novel proteomics technique that permits quantification of about 1,009 proteins in one single run. HepG2 cells were selected as a cell model based on the following lines of reasoning: 1) HepG2 cells express a variety of proteins in large quantities (27); 2) effects of biotin on mRNA abundance have been quantified in previous DNA microarray studies in HepG2 cells (14); and 3) effects of biotin concentrations in culture media on biotin homeostasis in HepG2 cells have been well characterized (14, 17).
MATERIALS AND METHODS
Cell culture
HepG2 cells were purchased from American Type Culture Collection (Manassas, VA). Cells were cultured in the following biotin-defined media for 10 d prior to sample collection (5% CO2 at 37ºC in humidified atmosphere): 0.025 nmol/L of biotin (denoted “deficient”), 0.25 nmol/L of biotin (“physiological”), and 10 nmol/L of biotin (“pharmacological”). Culture media were replaced with fresh media every 48 h. Media were prepared by using biotin-depleted fetal bovine serum as described previously (6); biotin concentrations in media were confirmed by avidin-binding assay (28) with modifications (6). Cultures were trypsinized and split before cells reached confluence. For the assays described below, cell pellets were collected at 60% to 70% confluence.
Biotin concentrations in media were chosen based on the following lines of reasoning: (i) 0.25 nmol/L of biotin represents the physiological concentration of biotin in plasma from healthy adults (29); (ii) 0.025 nmol/L of biotin is greater than two standard deviations below the mean physiological concentration in normal plasma (29); thus 0.025 nmol/L equals a deficient concentration of biotin; (iii) ingestion of a typical biotin supplement providing 25 times the Adequate Intake of biotin for adults (30) is associated with plasma concentrations of approximately 10 nmol/L of biotin in healthy adults (31); thus, this concentration represents a pharmacological concentration of biotin in plasma. Culturing HepG2 cells in biotin-defined media for 10 d provides for sufficient time to achieve new intracellular steady-state concentrations of biotin, as judged by activities of biotin-dependent PCC and by biotinylation of carboxylases (6, 32).
Biotin-dependent carboxylases
Biotin-dependent carboxylases are reliable markers for cellular biotin (1). Biotinylated carboxylases in cell extracts were resolved by polyacrylamide gel electrophoresis and were probed using streptavidin peroxidase (6); signal intensities were quantified by using gel densitometry (16). The activities of PCC in cell extracts were quantified as described previously (6).
Immunoblotting
For preparation of cell extracts, adherent cells in 75 cm2 tissue culture flasks were rinsed with phosphate-buffered saline, and the saline was discarded. Three milliliters of boiling lysis buffer (10 mmol/L Tris, pH 7.4, 1 mmol/L sodium vanadate, 35 mmol/L lauryl sulfate) were added per flask; the solution was swirled to ensure rapid protein denaturation. The cell lysate was collected with a cell scraper, and the sample was heated in a water bath at 100ºC for 30 s. The cellular DNA was sheared by passing the cell lysate 10 times through a 25-gauge needle. Samples were frozen in liquid nitrogen and stored at −80º for 2 d before analyses.
High-throughput immunoblotting (“PowerBlot”) of cell lysates was conducted using a commercial facility (BD Biosciences Pharmingen, San Diego, CA) as described (33). Briefly, proteins (200 μg/gel) were resolved using 2-D electrophoresis, followed by electroblotting onto polyvinylidene fluoride membranes. Proteins on membranes were probed using an array of antibodies to 1,009 human proteins; the identities of these proteins are provided on the facility’s website (33). Proteins were quantified by using appropriate fluorophore-labeled secondary antibodies and the Odyssey Infrared Imaging System (LI-COR, Lincoln, NE). Immunoblots were run in triplicate. Changes in protein abundance in response to biotin were ranked by order of confidence in data quality, using a scale from 1 to 10 (10 = highest level of confidence); ranking was based primarily on signal quality, consistency of data within triplicates, and magnitude of the observed change (treatment vs. physiological control) (33). Here, only data from confidence levels 7–10 were included in analysis: level 10 = ratio of the signal “treatment to control” (or “control to treatment”) >2, good quality signals, pass visual inspection; level 9 = signal ratio 1.5–1.9, good quality signals, pass visual inspection; level 8 = signal ratio 2, low signals, pass visual inspection; and level 7 = signal ratio 1.25–1.5, good quality signals, pass visual inspection.
The abundance of selected proteins in cell extracts was confirmed individually using one-dimensional gel electrophoresis as described (34); antibodies were purchased from BD Biosciences Pharmingen, Inc. As a control, we quantified histone H4 in nuclear extracts (35); anti-human histone H4 antibody was purchased from Santa Cruz Biotechnology (Santa Cruz, CA).
Reverse transcriptase polymerase chain reaction (RT-PCR)
Expression of genes encoding SAM68, AF6, GRB2, and histone H4 (control) was quantified by RT-PCR as described (36). Test genes and control gene were analyzed simultaneously in separate tubes in the same thermocyler. The following customized primers were used for PCR (Integrated DNA Technologies, Coralville, IA): (i) 5’-GTCCCACTATGAATATCTC-3’ and 5’-AGCTGCCCTATTTAGTAGA-3’ for human AF6 (GenBank accession number U02478); (ii) 5’-CTGTATTGGGAAAGGGCTCA-3’ and 5’-CCCCTTGACTCTGGCTGTAA-3’ for human SAM68 (GenBank accession number NM_130405); (iii) 5’-GAGCTTAATGGAAAAGACG-3’ and 5’-TTGACTCTTAGACGTTCCG-3’ for human GRB2 (GenBank accession number NM_002086); and (iv) 5’-ATGTCTGGTAGAGGCAAAGGTGGTAAA-3’ and 5’-TCAGCCACCAAAGCCGTACAGAGTGCG-3’ for human histone H4 (GenBank accession number M60749). cDNA was quantified by gel densitometry using the Kodak EDAS 290 Documentation and Analysis System (Rochester, NY); only values from within the exponential phase of PCR amplification were considered for data analysis. The abundance of mRNA encoding SAM68, AF6, and GRB2 was normalized by the abundance of mRNA encoding histone H4.
Electrophoretic mobility shift assays (EMSA)
The data presented below are consistent with effects of biotin on signaling by receptor tyrosine kinases. Signaling by receptor tyrosine kinases converges on transcription factors Fos and Jun, which have affinity for AP1 elements in regulatory regions of genes (37). EMSA were used to determine whether putative effects of biotin on tyrosine kinase signaling affect the AP1-binding activity in HepG2 cell nuclei. Nuclear extracts were prepared as described previously (16). AP1-binding factors in nuclear extracts were probed by EMSA (15), using a 32P-labeled double-stranded oligonucleotide probe with an AP1 consensus site: 5′-CGCTTGATGAGTCAGCCGGAA-3′ and 5′-TTCCGGCTGACTCATCAAGCG-3′ (Promega, Inc., Madison, WI). The nuclear protein-binding activity to ets1 sites (control) was quantified by using the following oligonucleotide probes: 5′-GTATTGTTGTTCCTCCATTTCTAGAATATT-3′ and 5′-AATATTCTAGAAATGGAGGAACAACAATAC-3′ (IDTDNA Technologies; Coralville, IA) (38). Additional controls were prepared by omitting nuclear extracts from incubation mixtures, and by incubating nuclear extracts with radiolabeled probe in the presence of a molar excess of unlabeled probe. In some cases, transcription factor-oligonucleotide-complexes were supershifted by using polyclonal rabbit IgG anti-human antibody to c-Jun (Santa Cruz Biotechnology, Inc., Santa Cruz, CA). These samples were prepared by incubating 5 μg of nuclear protein with 2 μg of antibody to c-Jun for 60 min at 4ºC prior to adding oligonucleotide probes. Note that incubation of nuclear proteins with antibodies (i) may prevent formation of transcription factor-oligonucleotide complexes (if antibodies block oligonucleotide-binding sites of transcription factors); or (ii) may decrease the electrophoretic mobility of the transcription factor-oligonucleotide-complex (if antibodies bind to transcription factors without blocking their oligonucleotide-binding sites).
Reporter-gene constructs
The following constructs were used to determine whether the biotin concentration in culture media affects the transcriptional activity of AP1-dependent genes: (i) a construct of the luciferase reporter gene driven by a basic promoter element (TATA box) and seven AP1 enhancer elements (denoted “AP1-Luc”) was purchased from Stratagene, Inc. (La Jolla, CA); (ii) a promoter-free plasmid containing the luciferase gene (“pGL3-Basic”; Promega, Inc.) was used to quantify baseline luciferase expression in cells; and (iii) a construct of the SV40 promoter and enhancer linked to the β-galactosidase reporter gene (“pSV-β-Galactosidase”; Promega, Inc.) was used to quantify transfection efficiency.
Cells were transfected with reporter-gene constructs by using FuGene 6 (Roche, Indianapolis, IN) according to the manufacturer’s instructions. Forty-eight hours after transfection, luciferase and β-galactosidase activities were quantified in cell lysates as described (32). Luciferase activities were normalized for transfection efficiency by using β-galactosidase activities. Data are expressed as ratios of luciferase activities in cells transfected with AP1-Luc to activities in cells transfected with pGL3-Basic.
Statistical Analysis
Homogeneity of variances among groups was tested using Bartlett’s test (39). If variances were heterogeneous data were log-transformed before further statistical analysis. Significance of differences among groups was tested by one-way ANOVA. Fisher’s Protected Least Significant Difference procedure was used for posthoc testing (39). StatView 5.0.1 (SAS Institute; Cary, NC) was used to perform all calculations. Differences were considered significant if P < 0.05. Data are expressed as mean ± SD or as median (and 33th, 66th percentile); replicates represent data collected from assays of separate cultures as opposed to assaying the same sample from one culture multiple times.
RESULTS
Biotin-dependent carboxylases
Biotinylation of carboxylases in HepG2 cells depended on biotin concentrations in culture media. If cells were cultured in biotin-deficient medium, biotinylated pyruvate carboxylase, PCC, and 3-methylcrotonyl-CoA carboxylase were barely detectable in cell extracts, using streptavidin peroxidase as a probe (Fig. 1A). Note that the biotin-containing α-chains of PCC (molecular mass = 80 kDa) and 3-methylcrotonyl-CoA carboxylase (molecular mass = 83 kDa) migrate as one single band on the polyacrylamide gels used here. The abundance of holocarboxylases was similar in cells cultured in media containing deficient and physiological concentrations of biotin, as judged by gel densitometric analysis of streptavidin blots (Fig. 1B). In contrast, holocarboxylases were 6.3 to 62 times more abundant in biotin-supplemented cells compared with cells cultured in media containing deficient or physiological concentrations of biotin. Acetyl-CoA carboxylase was barely detectable in cell extracts (Fig. 1A), consistent with previous studies in human cell cultures (6, 40); hence, acetyl-CoA carboxylase was not quantified by gel densitometry. PCC activities in HepG2 cells depended on the concentration of biotin in culture media [units = pmol bicarbonate fixed/(min x mg protein)]: biotin-deficient medium = 21 ± 2.5; physiological medium = 45 ± 3.2; and pharmacological medium = 266 ± 22 (P < 0.01 among all treatment groups; n = 3 separate experiments). These findings are consistent with the hypothesis that biotin concentrations in culture media affect intracellular biotin concentrations.
Fig. 1.
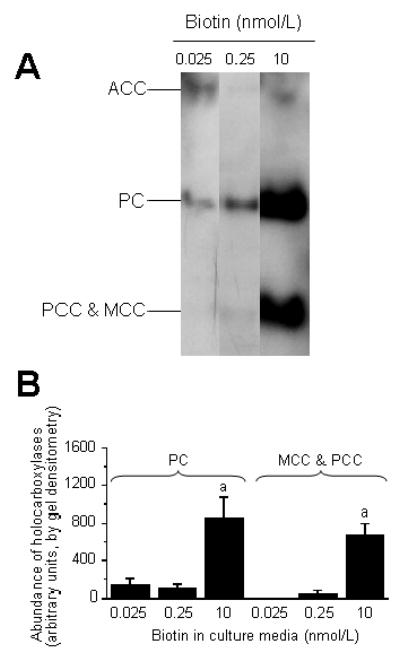
Biotin concentrations in culture media affect the abundance of holocarboxylases in HepG2 cells. Cells were cultured in media containing deficient (0.025 nmol/L), physiological (0.25 nmol/L), and pharmacological (10 nmol/L) concentrations of biotin for 10 d. Panel A: Representative Western blot depicting acetyl-CoA carboxylase (ACC), pyruvate carboxylase (PC), α-chain of propionyl-CoA carboxylase (PCC), and α-chain of 3-methylcrotonyl-CoA carboxylase (MCC). Panel B: Gel densitometric analysis of Western blots. Values are means ± SD (n = 3 separate experiments). aSignificantly different from the abundance of the same carboxylase in cells cultured in physiological medium (P < 0.01).
Immunoblot analysis
Biotin affected the abundance of 44 proteins in HepG2 cells, as judged by high-throughput immunoblot analysis; this equals 4.4% of the proteins tested. The abundance of 12 proteins increased by >25% in response to biotin deficiency compared with physiological controls; the abundance of 17 proteins decreased by >25% in response to biotin deficiency (see Appendix). The abundance of three proteins increased by >25% in response to pharmacological concentrations of biotin in culture medium compared with physiological controls; the abundance of 16 proteins decreased by >25% in response to biotin supplementation (see Appendix). The following proteins exhibited the largest increase in biotin-deficient cells compared with physiological controls (see the Appendix for Swiss Prot ID numbers): GRB2 (410% increase), SAM68 (324% increase), LRII/SorLA/gp250 (169% increase), and A-RAF (134% increase). The following genes exhibited the largest decrease in biotin-deficient cells compared with physiological controls: AF6 (not detectable in biotin-deficient cells), GGA2 (69% decrease), E-cadherin (53% decrease), and EBP50 (51% decrease). The following proteins exhibited the largest increase in biotin-supplemented cells compared with physiological controls: gelsolin (950% increase), CTCF (76% increase), and No55 (67% increase). The following genes exhibited the largest decrease in biotin-supplemented cells compared with physiological controls: annexin II (83% decrease), mEPHX (61% decrease), ATP synthase b (59% decrease), and TNIK (55% decrease).
Comparative analysis of protein abundance by high-throughput 2D-immunoblots and one-dimensional gel electrophoresis produced similar trends. Here, we selected three proteins that were increased in response to biotin deficiency, as judged by high-throughput immunoblotting (see above): SAM68, GRB2, and RAF. When these proteins were assayed by using one-dimensional gel electrophoresis and gel densitometry, the abundance was greater in biotin-deficient cells compared with other treatment groups (Fig. 2): SAM68 = 87% increase; GRB2 = 32% increase; and RAF = 12% increase. The abundance of histone H4 (loading control) was not affected by biotin (data not shown). These data are consistent with the notion that data obtained by high-throughput 2D-immunoblots are precise.
Fig. 2.
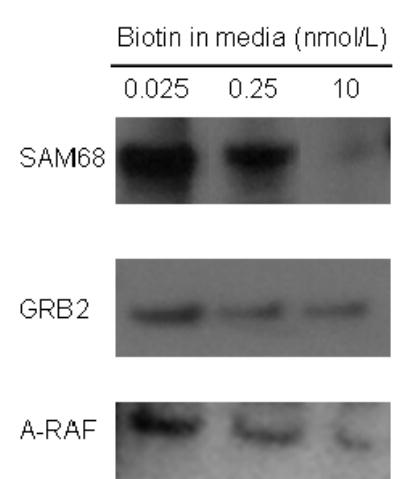
The relative abundance of proteins from high-throughput immunoblot analysis was confirmed by using one-dimensional gel electrophoresis. HepG2 cells were cultured in media containing deficient (0.025 nmol/L), physiological (0.25 nmol/L), and pharmacological (10 nmol/L) concentrations of biotin for 10 d. High-throughput immunoblot analysis suggested that the abundance of the following proteins increased in response to biotin deficiency: SAM68 (SwissProt ID: Q07666); GRB2 (SwissProt ID: P29354); A-RAF (SwissProt ID: P04627). Here, these findings were validated by Western blot analysis using a one-dimensional gel electrophoresis system.
Protein clusters
Biotin-responsive proteins were not randomly distributed in the genome. Rather, biotin-responsive proteins clustered in classes of distinct molecular and biological functions (Table 1). The quantitatively most important cluster comprised proteins that play roles in cell signaling. Twelve out of a total of 44 biotin-responsive proteins were associated with this cluster; five of these biotin-responsive signaling proteins are linked to receptor tyrosine kinase pathways as described below. Biotin also affected the abundance of protein clusters that play roles in nuclear structure and transport (10 proteins), formation of the cytoskeleton (6), neuroscience (6), and cell biology (5); proteins with other molecular and biological functions accounted for the remainder of the biotin-responsive proteins (5). Five biotin-responsive proteins decreased in both biotin-deficient and biotin-supplemented cells compared with physiological controls (Table 1; see Discussion).
TABLE 1.
Biotin concentrations in culture media affect the abundance of protein clusters in HepG2 cells
| Treatment (biotin in culture medium)1 |
|||
|---|---|---|---|
| Protein cluster2 | Confidence level3 | Deficient | Pharmacological |
| Protein abundance (compared with physiological controls)1 | |||
| Cell signaling | |||
| GRB2 | 10 | Increase | |
| Sam68 | 10 | Increase | |
| AF6 | 10 | Decrease | |
| Annexin II | 10 | Decrease | |
| A-RAF | 9 | Increase | |
| TNIK | 9 | Decrease | |
| CDC42GAP | 8 | Decrease | Decrease4 |
| PSD-95 | 8 | Decrease | |
| Tpl-2 | 8 | Decrease | Decrease4 |
| GAP1m | 8 | Decrease | |
| IRS-1 | 7 | Decrease | |
| c-Cbl | 7 | Increase | |
| Nucleus and nuclear transport | |||
| Ku70 | 9 | Decrease | |
| Smad4/DPC4 | 8 | Decrease | |
| ICBP90 | 7 | Decrease | |
| No55 | 7 | Increase | |
| RanBP3 | 7 | Decrease | |
| Stat2 | 7 | Increase | |
| hSlu7 | 7 | Decrease | |
| FIP-2 | 7 | Decrease | |
| CTCF | 7 | Increase | |
| TIP49b | 7 | Decrease | |
| Cytoskeleton | |||
| E-Cadherin | 9 | Decrease | |
| EBP50 | 9 | Decrease | |
| Gelsolin | 8 | Increase | |
| EB1 | 7 | Increase | |
| CLP-36 | 7 | Decrease | |
| L-caldesmon | 7 | Decrease | |
| Neuroscience | |||
| Amphiphysin | 8 | Decrease | Decrease4 |
| Nogo A | 8 | Decrease | Decrease4 |
| b1-Calcium channel | 8 | Decrease | Decrease4 |
| Nurr | 7 | Decrease | |
| Syntaxin 4 | 7 | Increase | |
| PCMT-I/II | 7 | Increase | |
| Cell biology | |||
| mEPHX | 10 | Decrease | |
| ATP synthase b | 9 | Decrease | |
| GGA2 | 9 | Decrease | |
| Bpntase | 7 | Decrease | |
| LR11/SorLA | 9 | Increase | |
| Others | |||
| E-Cadherin | 9 | Decrease | |
| eIF-4F | 7 | Increase | |
| LRP | 7 | Increase | |
| FKBP65 | 7 | Decrease | |
| CDC27 | 7 | Increase | |
HepG2 cells were cultured in media containing 0.025 nmol/L biotin (“deficient”), 0.25 nmol/L biotin (“physiological” = control), and 10 nmol/L biotin (“pharmacological”) for 10 d.
SwissProt IDs of proteins are provided in the Appendix.
The “Confidence level” is a measure for data quality on a scale from 1 to 10 (10 being the highest; see Materials and Methods for Details).
The abundance of this protein decreased in response to both deficient and pharmacological concentrations of biotin compared with physiological controls.
Signaling by receptor tyrosine kinase pathways
Biotin deficiency was associated with increased abundance of proteins that play roles in receptor tyrosine kinase signaling. In this section, we provide both data on protein abundance and a brief review of receptor tyrosine kinase signaling for clarity. Receptor tyrosine kinases span the cell membrane in mammalian cells (Fig. 3) (37). Various ligands have affinity for the ligand-binding domain located in the extracellular domain of receptor tyrosine kinases; ligands include platelet-derived growth factor, insulin, thrombin, and various other compounds. Binding of ligands causes dimerization of receptors and activation of the tyrosine kinase domain in the cytoplasmic domain; this is associated with autophosphorylation of the C-terminus of the receptor. Phosphorylated receptor has affinity for GRB2 (and perhaps its homolog SAM68) and SOS. In the present study the abundance [median (33th, 66th percentile)] of GRB2 and SAM68 was 410% (250%, 1249%) and 324% (247%, 404%) greater, respectively, in biotin-deficient HepG2 cells compared with physiological controls. Binding of the G protein SOS to the phosphorylated receptor tyrosine kinase triggers a substitution of GTP for GDP in the serine/threonine kinase RAS, mediating catalytic activity. In the present study, the abundance of the Ras-interacting protein AF6 decreased to non-detectable levels in response to biotin deficiency, presumably further enhancing Ras activity (41, 42). Ras mediates phosphorylation of the serine/threonine kinase RAF1, causing activation of RAF1. In the present study, the abundance of RAF1 was 134% (101%, 145%) greater in biotin-deficient cells compared to physiological controls. RAF1 catalyzes phosphorylation and, hence, activation of MAP kinase kinases (MAPKK or MEK). In the present study, the abundance of the MAP kinase kinase kinase Tpl2 decreased to non-detectable levels in both biotin-deficient and biotin-supplemented cells compared with physiological controls. Phosphorylated MEK catalyze phosphorylation and, hence, activation of mitogen-activated protein kinases (MAPK) such as ERK1 and ERK2. Phosphorylated ERK mediate phosphorylation of Fos and Jun, enhancing the transcriptional activity of genes driven by AP1 and NF-κB binding motifs.
Fig. 3.
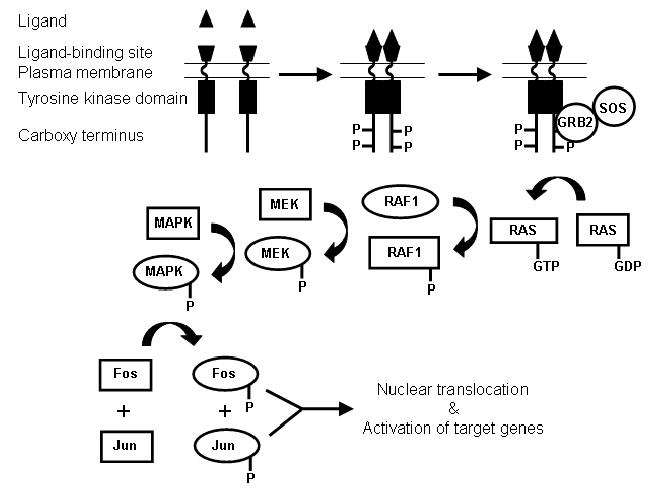
Flow chart of receptor tyrosine kinase-mediated cell signaling in human cells. Binding of ligand to receptor tyrosine kinases causes dimerization and autophosphorylation. Signaling proteins such as GRB2 and SOS associate with phosphorylated tyrosine receptor kinases, triggering signaling cascades involving kinases such as RAS, RAF, MEK, and MAPK. Ultimately, the transcription factors Fos and Jun are phosphorylated and translocate to the nucleus, where they activate AP1-dependent genes.
EMSA
The AP1-binding activity was greater in nuclear extracts from biotin-deficient cells compared with extracts from cells cultured in physiological or pharmacological media (Fig. 4, lanes 1–3); no band was observed in the absence of nuclear extract (negative control, lane 4). The following findings suggest that the binding of transcription factors to AP1 sites was a specific event: (i) band intensities decreased substantially if nuclear extracts were incubated with radiolabeled oligonucleotides in the presence of a 50-fold molar excess of unlabeled oligonucleotides (Fig. 4, lanes 5–7); and (ii) bands were supershifted by incubation with antibody to c-Jun before conducting EMSA (lanes 8–10). Finally, biotin deficiency was not associated with increased protein-binding activity to ets1 sites (Fig. 4A, lanes 11–13). Rather, biotin deficiency was associated with a moderate decrease in protein-binding activity to ets1 sites. This is consistent with the hypothesis that biotin supplementation specifically increased the nuclear activity of AP1-binding transcription factors as opposed to causing a global increase in the nuclear translocation of various transcription factors.
Fig. 4.
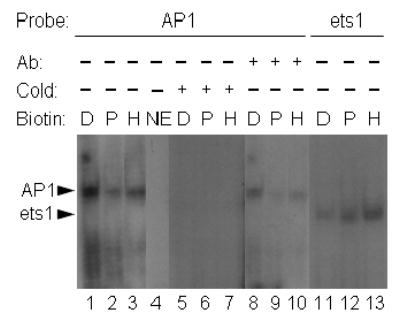
Nuclear translocation of AP1-binding proteins increases in response to biotin deficiency. HepG2 cells were cultured in media containing deficient (“D”, 0.025 nmol/L), physiological (“P”, 0.25 nmol/L), and pharmacological (“H” = high, 10 nmol/L) concentrations of biotin for 10 d. Transcription factors in nuclear extracts were probed by EMSA, using the following oligonucleotide probes and conditions: lanes 1–3 = oligonucleotide containing an AP1 consensus site; lane 4 = AP1 oligonucleotide in the absence of nuclear extract; lanes 5–7 = 50-fold molar excess of unlabeled compared to radiolabeled AP1 oligonucleotide; lanes 8–10 = AP1 oligonucleotide, supershifted by using an antibody to c-Jun; lanes 11–13 = oligonucleotide containing an ets1 site. Abbreviations: NE = no extract; Ab = antibody (supershift experiments); cold = excess of cold (unlabeled) probe.
Transcriptional activities of AP1-dependent reporter genes
The transcriptional activity (luciferase activity) of a reporter gene (AP1-Luc) driven by five AP1 elements was 23–45% greater in biotin-deficient cells compared cells cultured in media containing physiological or pharmacological concentrations of biotin (units = ratio of AP1-Luc to pGL3-basic): 0.025 nmol/L biotin = 1.6 ± 0.3 units; 0.25 nmol/L biotin = 1.1 ± 0.2 units; and 10 nmol/L biotin = 1.3 ± 0.04 units (P < 0.05 for 0.025 nmol/L biotin versus 0.25 nmol/L; n = 3).
Gene expression analysis
Biotin-dependent changes in protein abundance appeared independent of transcription. As models, we selected three proteins that were more abundant in biotin-deficient HepG2 cells than in physiological controls: SAM68 (324% increase of protein), AF6 (not detectable in physiological control), and GRB2 (410% increase of protein). The following data were obtained for the abundance of SAM68 mRNA (units = % of mRNA in physiological controls, 0.25 nmol/L): 0.025 nmol/L biotin = 98 ± 14%; 0.25 nmol/L biotin = 100 ± 30%; and 10 nmol/L biotin = 90 ± 53 units (P > 0.05; n = 5). The following data were obtained for the abundance of AF6 mRNA (units = % of mRNA in physiological controls, 0.25 nmol/L): 0.025 nmol/L biotin = 92 ± 36%; 0.25 nmol/L biotin = 100 ± 46%; and 10 nmol/L biotin = 69 ± 54% (P > 0.05; n = 5). The following data were obtained for the abundance of GRB2 mRNA (units = % of mRNA in physiological controls, 0.25 nmol/L): 0.025 nmol/L biotin = 114 ± 35%; 0.25 nmol/L biotin = 100 ± 22%; and 10 nmol/L biotin = 127 ± 40% (P > 0.05; n = 4).
DISCUSSION
The present study provides evidence 1) that biotin affects the abundance of proteins in HepG2 cells; 2) that these biotin-responsive proteins can be grouped in distinct clusters based on biological function; 3) that about one-third of these biotin-responsive proteins are associated with cell signaling pathways; 4) that biotin deficiency causes increased abundance of proteins that play roles in signaling by receptor tyrosine kinases; 5) that activation of receptor tyrosine kinase pathways is associated with nuclear translocation of AP1-binding proteins and transcriptional activation of AP1-dependent genes in biotin-deficient cells; and 6) that biotin affects gene expression at both the transcriptional level (e.g., AP1-mediated transcriptional activation) and the posttranscriptional level (e.g., translation of SAM68, AF6, and GRB2) in HepG2 cells.
The findings reported here are consistent with the hypothesis that biotin affects gene expression by modulating the nuclear translocation of Fos and Jun. Fos/Jun heterodimers bind AP1 sites with 30 times greater affinity compared with Jun homodimers, whereas Fos homodimers do not have AP1-binding affinity (43). In the present study, incubation of samples with an antibody to Jun caused a supershift in EMSA, suggesting that Jun participates in biotin-dependent cell signaling. We cannot formally exclude the possibility that Fos and other AP1-binding proteins (e.g., Fras = Fos-related antigens) account for some of the increased AP1-binding activity in biotin-deficient cells. Note that biotinyl-AMP, Sp1 and Sp3, and NF-κB also mediate effects of biotin on gene expression (15–17). Future studies are likely to identify additional biotin-dependent signaling pathways involving the proteins listed in the appendix of this manuscript.
What are the biological consequences of activating AP1-dependent genes in response to biotin deficiency? We speculate that Fos and Jun mediate increased expression of the biotin transporters SMVT and MCT1 in response to biotin deficiency (6, 40). The regulatory region of the human SMVT gene contains four AP1 sites and one AP1-like site (44), whereas regulatory region of the human MCT1 gene contains two AP1 sites (45). In addition to its putative effects on biotin transporter expression, nuclear translocation of Fos and Jun might enhance stress resistance of biotin-deficient cells (46–48) in analogy to effects of biotin on NF-κB (15). We speculate that the increased nuclear abundance of both Fos/Jun and NF-κB observed in biotin-deficient cells might contribute to pro-inflammatory and anti-apoptotic effects of biotin deficiency.
This study provides evidence for the feasibility of identifying nutrient-responsive proteins by using high-throughput immunoblot screening. The level of confidence in this approach is high, based on the following lines of evidence. First, observations from high-throughput immunoblot screening were confirmed by using one-dimensional gel electrophoresis. Second, distinct proteins from a given signaling pathway (receptor kinase signaling) showed synergistic changes in response to biotin deficiency. Third, changes in the abundance of signaling proteins were paralleled by changes in downstream events, i.e., transcriptional activity of target genes. The application of high-throughput immunoblot screens to various test situations is likely to result in the identification of novel nutrient-dependent pathways.
At a first glance the number of biotin-responsive proteins identified here may seem small (44 proteins). However, on a relative basis, these 44 proteins represent 4.4% of the proteins screened for. This is moderately less than the percentage of biotin-dependent transcripts identified in the same cell line: 1,803 out of 14,000 tested genes (=13%) (14). Please note that not all the proteins included in our high-throughput immunoblot screening are actually expressed in liver cells. Hence, the true percentage of biotin-dependent proteins is larger than the number provided above. In the present study we applied very stringent selection criteria when screening for biotin-responsive proteins (see Materials and Methods). Using less stringent criteria would have resulted in a much larger number of biotin-responsive proteins (data not shown). Finally, liver cells also express proteins that were not included in this high-throughput screen. Hence, it is likely that some biotin-responsive proteins escaped detection in the studies presented here.
In the present study, the abundance of SAM68, AF6, and GRB2 increased in response to biotin deficiency; this increase was not paralleled by the abundance of mRNA encoding these proteins. Based on these observations we concluded that biotin deficiency enhances the expression of SAM68, AF6, and GRB2 at a posttranscriptional step. Note that we cannot formally exclude effects of biotin deficiency on the transcriptional activity of genes coding for SAM68, AF6, and GRB2. For example, alternative splicing of RNA, cell type, and life cycle may considerably affect mRNA abundance (49). These variables were not considered in the present study.
A limitation not specifically addressed in the study presented here is the following. The abundance of some proteins decreased in both biotin-deficient and biotin-supplemented cells compared with physiological controls. We speculate that any non-physiological concentration of biotin (i.e., deficient and supra-physiological) might decrease the abundance of some proteins. Notwithstanding this minor uncertainty, the high-throughput immunoblot screening used here has proven an excellent tool to identify clusters of biotin-dependent proteins. Further analysis of this data set is likely to generate additional insights into biotin-dependent cell signaling.
APPENDIX
The following proteins increased by at least 25% in biotin-deficient cells compared to physiological controls (SwissProt ID): GRB2 (P29354), SAM68 (Q07666), A-RAF (P04627), LRII/sorLA/gp250 (Q92673), c-Cbl (P22681), EB1 (Q15691), eIF-4E (P29338), LRP (Q14764), CDC27 (P30260), PCMT-I/II (P22061), stat2 (P52630), and syntaxin-4 (Q12846). The following proteins decreased by at least 25% in biotin-deficient cells compared to physiological controls (SwissProt ID): AF6 (P55196), E-cadherin (P12830), EBP50 (Q14745), GGA2 (Q9UJY4), Ku70 (P23475), b1 calcium channel (Q02641), CDC426AP (Q07960), Gap1m (Q63713), Nogo A (Q9JK11), Tpl-2 (Q63562), CLP-36 (Q00151), FKBP65 (Q61576), L-caldesmon (Q05682), Nurr (Q06219), RanBP3 (Q9HGZ4), TIP49G (Q9Y230), and amphiphysin (P49418). The following proteins increased by at least 25% in cells cultured in medium containing a pharmacological concentration of biotin compared to physiological controls (SwissProt ID): gelsolin (P06396), CTCF (P49711), and No55 (Q92791). The following proteins decreased by at least 25% in cells cultured in medium containing a pharmacological concentration of biotin compared to physiological controls (SwissProt ID): annexin II (P07355), mEPHX (P07099), TNIK (Q9UKE5), b1-calcium channel (Q02641), ATP synthase b (P83483), CDC42GAP (Q07960), amphiphysin (P49418), Nogo A Q9JK11), PSD-95 (P31016), Smad4 (Q13485), Tpl-2 (Q63562), BPntase (Q9Z051), Flp-2 (Q96CV9), hSlu7 (AAD13774), ICBP90 (Q9P115), and IRS (P39570).
Footnotes
This work was supported by NIH grants DK 60447 and DK 063945, by NSF EPSCoR grant EPS-0346476, and by a grant from the University of Nebraska Agricultural Research Division. This paper is a contribution of the University of Nebraska Agricultural Research Division, Lincoln, NE 68583 (Journal Series No. 14957)
Abbreviations: EMSA, electrophoretic mobility shift assay; PCC, propionyl-CoA carboxylase; RT-PCR, reverse transcriptase polymerase chain reaction
References
- 1.Zempleni, J. (2001) Biotin. In: Present Knowledge in Nutrition (B. A. Bowman and R. M. Russell, eds.). ILSI Press, Washington, D.C.
- 2.Mock DM, Henrich CL, Carnell N, Mock NI, Swift L. Lymphocyte propionyl-CoA carboxylase and accumulation of odd-chain fatty acid in plasma and erythrocytes are useful indicators of marginal biotin deficiency. J Nutr Biochem. 2002;13:462–470. doi: 10.1016/s0955-2863(02)00192-4. [DOI] [PubMed] [Google Scholar]
- 3.Rodriguez-Melendez R, Perez-Andrade ME, Diaz A, Deolarte A, Camacho-Arroyo I, Ciceron I, Ibarra I, Velazquez A. Differential effects of biotin deficiency and replenishment on rat liver pyruvate and propionyl-CoA carboxylases and on their mRNAs. Mol Genet Metabol. 1999;66:16–23. doi: 10.1006/mgme.1998.2777. [DOI] [PubMed] [Google Scholar]
- 4.Mock DM, Mock NI. Lymphocyte propionyl-CoA carboxylase is an early and sensitive indicator of biotin deficiency in rats, but urinary excretion of 3-hydroxypropionic acid is not. J Nutr. 2002;132:1945–1950. doi: 10.1093/jn/132.7.1945. [DOI] [PMC free article] [PubMed] [Google Scholar]
- 5.Dakshinamurti, K., Chalifour, L. E. & Bhullar, R. J. (1985) Requirement for biotin and the function of biotin in cells in culture. In: Biotin (K. Dakshinamurti and H. N. Bhagavan, eds.). New York Academy of Science, New York, NY. [DOI] [PubMed]
- 6.Manthey KC, Griffin JB, Zempleni J. Biotin supply affects expression of biotin transporters, biotinylation of carboxylases, and metabolism of interleukin-2 in Jurkat cells. J Nutr. 2002;132:887–892. doi: 10.1093/jn/132.5.887. [DOI] [PubMed] [Google Scholar]
- 7.Rabin BS. Inhibition of experimentally induced autoimmunity in rats by biotin deficiency. J Nutr. 1983;113:2316–2322. doi: 10.1093/jn/113.11.2316. [DOI] [PubMed] [Google Scholar]
- 8.Báez-Saldaña A, Díaz G, Espinoza B, Ortega E. Biotin deficiency induces changes in subpopulations of spleen lymphocytes in mice. Am J Clin Nutr. 1998;67:431–437. doi: 10.1093/ajcn/67.3.431. [DOI] [PubMed] [Google Scholar]
- 9.Petrelli F, Moretti P, Campanati G. Studies on the relationships between biotin and the behaviour of B and T lymphocytes in the guinea pig. Experientia. 1981;37:1204–1206. doi: 10.1007/BF01989920. [DOI] [PubMed] [Google Scholar]
- 10.Watanabe T. Teratogenic effects of biotin deficiency in mice. J Nutr. 1983;113:574–581. doi: 10.1093/jn/113.3.574. [DOI] [PubMed] [Google Scholar]
- 11.Watanabe T, Dakshinamurti K, Persaud TVN. Biotin influences palatal development of mouse embryos in organ culture. J Nutr. 1995;125:2114–2121. doi: 10.1093/jn/125.8.2114. [DOI] [PubMed] [Google Scholar]
- 12.Zempleni J, Mock DM. Marginal biotin deficiency is teratogenic. Proc Soc Exp Biol Med. 2000;223:14–21. doi: 10.1046/j.1525-1373.2000.22303.x. [DOI] [PubMed] [Google Scholar]
- 13.Wiedmann S, Rodriguez-Melendez R, Ortega-Cuellar D, Zempleni J. Clusters of biotin-responsive genes in human peripheral blood mononuclear cells. J Nutr Biochem. 2004;15:433–439. doi: 10.1016/j.jnutbio.2004.02.005. [DOI] [PubMed] [Google Scholar]
- 14.Rodriguez-Melendez, R., Griffin, J. B. & Zempleni, J. (2005) The expression of genes encoding ribosomal subunits and eukaryotic translation initiation factor 5A depends on biotin and bisnorbiotin in HepG2 cells. J. Nutr. Biochem. (in press). [DOI] [PubMed]
- 15.Rodriguez-Melendez R, Schwab LD, Zempleni J. Jurkat cells respond to biotin deficiency with increased nuclear translocation of NF-κB, mediating cell survival. Int J Vitam Nutr Res. 2004;74:209–216. doi: 10.1024/0300-9831.74.3.209. [DOI] [PubMed] [Google Scholar]
- 16.Griffin JB, Rodriguez-Melendez R, Zempleni J. The nuclear abundance of transcription factors Sp1 and Sp3 depends on biotin in Jurkat cells. J Nutr. 2003;133:3409–3415. doi: 10.1093/jn/133.11.3409. [DOI] [PubMed] [Google Scholar]
- 17.Solorzano-Vargas RS, Pacheco-Alvarez D, Leon-Del-Rio A. Holocarboxylase synthetase is an obligate participant in biotin-mediated regulation of its own expression and of biotin-dependent carboxylases mRNA levels in human cells. Proc Natl Acad Sci USA. 2002;99:5325–5330. doi: 10.1073/pnas.082097699. [DOI] [PMC free article] [PubMed] [Google Scholar]
- 18.Zempleni, J. (2005) Uptake, localization, and noncarboxylase roles of biotin. Annu. Rev. Nutr. (in press). [DOI] [PubMed]
- 19.Bergeron JJM, Brenner MB, Thomas DY, Williams DB. Calnexin: a membrane-bound chaperone of the endoplasmic reticulum. Trends Biochem Sci. 1994;19:124–128. doi: 10.1016/0968-0004(94)90205-4. [DOI] [PubMed] [Google Scholar]
- 20.Hebert DN, Foellmer B, Helenius A. Glucose trimming and reglycosylation determine glycoprotein association with calnexin in the endoplasmic reticulum. Cell. 1995;81:425–433. doi: 10.1016/0092-8674(95)90395-x. [DOI] [PubMed] [Google Scholar]
- 21.Macher DRJ, Koch GLE. Identification of a set of calcium-binding proteins in reticuloplasm, the luminal content of the endoplasmic reticulum. J Cell Sci. 1988;91:61–70. doi: 10.1242/jcs.91.1.61. [DOI] [PubMed] [Google Scholar]
- 22.Pahl HL. Signal transduction from the endoplasmic reticulum to the cell nucleus. Physiol Rev. 1999;79:683–700. doi: 10.1152/physrev.1999.79.3.683. [DOI] [PubMed] [Google Scholar]
- 23.Yoshida H, Matsui T, Yamamoto A, Okada T, Mori K. XBP1 mRNA is induced by ATF6 and spliced by IRE1 in response to ER stress to produce a highly active transcription factor. Cell. 2001;107:881–891. doi: 10.1016/s0092-8674(01)00611-0. [DOI] [PubMed] [Google Scholar]
- 24.Rao RV, Peel A, Logviniva A, Rio Gd, Hermel E, Yokota T, Goldsmith PC, Ellerby LM, Ellerby HM, Bredesen DE. Coupling endoplasmic reticulum stress to the cell death program: role of the ER chaperone GRP78. FEBS Lett. 2002;514:122–128. doi: 10.1016/s0014-5793(02)02289-5. [DOI] [PMC free article] [PubMed] [Google Scholar]
- 25.Sidrauski, C., Brickner, J. H. & Walter, P. (2002) The unfolded protein response. In: Protein Targeting, Transport & Translocation (R. E. Dalbey and G. von Heijne, eds.). Academic Press, San Diego, CA.
- 26.Rodriguez-Melendez R, Griffin JB, Zempleni J. Biotin supplementation increases expression of the cytochrome P450 1B1 gene in Jurkat cells, increasing the occurrence of single-stranded DNA breaks. J Nutr. 2004;134:2222–2228. doi: 10.1093/jn/134.9.2222. [DOI] [PubMed] [Google Scholar]
- 27.American Type Culture Collection (2003) www.atcc.org (accessed 1/30/2003).
- 28.Mock, D. M. (1997) Determinations of biotin in biological fluids (D. B. McCormick, J. W. Suttie and C. Wagner). Academic Press, New York, NY. [DOI] [PubMed]
- 29.Mock DM, Lankford GL, Mock NI. Biotin accounts for only half of the total avidin-binding substances in human serum. J Nutr. 1995;125:941–946. doi: 10.1093/jn/125.4.941. [DOI] [PubMed] [Google Scholar]
- 30.National Research Council (1998) Dietary reference intakes for thiamin, riboflavin, niacin, vitamin B6, folate, vitamin B12, pantothenic acid, biotin, and choline (Institute of Medicine Food and Nutrition Board). National Academy Press, Washington, DC. [PubMed]
- 31.Zempleni J, Helm RM, Mock DM. In vivo biotin supplementation at a pharmacologic dose decreases proliferation rates of human peripheral blood mononuclear cells and cytokine release. J Nutr. 2001;131:1479–1484. doi: 10.1093/jn/131.5.1479. [DOI] [PubMed] [Google Scholar]
- 32.Rodriguez-Melendez R, Camporeale G, Griffin JB, Zempleni J. Interleukin-2 receptor γ-dependent endocytosis depends on biotin in Jurkat cells. Am J Physiol Cell Physiol. 2003;284:C415–C421. doi: 10.1152/ajpcell.00365.2002. [DOI] [PubMed] [Google Scholar]
- 33.Pharmingen (2003) BD PowerBlot: The Power of Proteomics. http://bioinfo.clontech.com/powerblot/(accessed 7/26/2004).
- 34.Griffin JB, Stanley JS, Zempleni J. Synthesis of a rabbit polyclonal antibody to the human sodium-dependent multivitamin transporter. Int J Vitam Nutr Res. 2002;72:195–198. doi: 10.1024/0300-9831.72.4.195. [DOI] [PubMed] [Google Scholar]
- 35.Camporeale G, Shubert EE, Sarath G, Cerny R, Zempleni J. K8 and K12 are biotinylated in human histone H4. Eur J Biochem. 2004;271:2257–2263. doi: 10.1111/j.1432-1033.2004.04167.x. [DOI] [PubMed] [Google Scholar]
- 36.Zempleni J, Stanley JS, Mock DM. Proliferation of peripheral blood mononuclear cells causes increased expression of the sodium-dependent multivitamin transporter gene and increased uptake of pantothenic acid. J Nutr Biochem. 2001;12:465–473. doi: 10.1016/s0955-2863(01)00162-0. [DOI] [PubMed] [Google Scholar]
- 37.Hesketh, R. (1997) The Oncogene and Tumour Suppressor Gene FactsBook. Academic Press Harcourt Brace and Company, London, UK.
- 38.Ohbo K, Takasawa N, Ishii N, Tanaka N, Nakamura M, Sugamura K. Functional analysis of the human interleukin-2 receptor γ chain promoter. J Biol Chem. 1995;270:7479–7486. doi: 10.1074/jbc.270.13.7479. [DOI] [PubMed] [Google Scholar]
- 39.SAS Institute (1999) StatView Reference SAS Publishing, Cary, NC.
- 40.Crisp SERH, Camporeale G, White BR, Toombs CF, Griffin JB, Said HM, Zempleni J. Biotin supply affects rates of cell proliferation, biotinylation of carboxylases and histones, and expression of the gene encoding the sodium-dependent multivitamin transporter in JAr choriocarcinoma cells. Eur J Nutr. 2004;43:23–31. doi: 10.1007/s00394-004-0435-9. [DOI] [PubMed] [Google Scholar]
- 41.Yamamoto T, Harada N, Kawano Y, Taya S, Kaibuchi K. In vivo interaction of AF-6 with activated Ras and ZO-1. Biochem Biophys Res Commun. 1999;259:103–107. doi: 10.1006/bbrc.1999.0731. [DOI] [PubMed] [Google Scholar]
- 42.Linnemann T, Geyer M, Jaitner BK, Block C, Kalbitzer HR, Wittinghofer A, Herrmann C. Thermodynamic and kinetic characterization of the interaction between the Ras binding domain of AF6 and members of the Ras subfamily. J Biol Chem. 1999;274:13556–13562. doi: 10.1074/jbc.274.19.13556. [DOI] [PubMed] [Google Scholar]
- 43.Latchman, D. S. (1998) Eukaryotic transcription factors Academic Press, San Diego, CA.
- 44.Dey S, Subramanian VS, Chatterjee NS, Rubin SA, Said HM. Characterization of the 5′ regulatory region of the human sodium-dependent multivitamin transporter, hSMVT. Biochim Biophys Acta. 2002;1574:187–192. doi: 10.1016/s0167-4781(02)00226-9. [DOI] [PubMed] [Google Scholar]
- 45.Hadjiagapiou, C., Borthakur, A., Dahdal, R. Y., Gill, R. K., Malakooti, J., Ramaswamy, K. & Dudeja, P. K. (2005) Role of USF1 and USF2 as potential repressor proteins for human intestinal monocarboxylate transporter 1 (MCT1) promoter. Am. J. Physiol. Gastrointest. Liver Physiol. (in press). [DOI] [PubMed]
- 46.Inoue H, Tateno M, Fujimura-Kamada K, Takaesu G, Adachi-Yamada T, Ninomiya-Tsuji J, Irie K, Nishida Y, Matsumoto K. A Drosophila MAPKKK, D-MEKK1, mediates stress responses through activation of p38 MAPK. EMBO J. 2001;20:5421–5430. doi: 10.1093/emboj/20.19.5421. [DOI] [PMC free article] [PubMed] [Google Scholar]
- 47.Ramet M, Lanot R, Zachary D, Manfruelli P. JNK signaling pathway is required for efficient wound healing in Drosophila. Dev Biol. 2002;241:145–156. doi: 10.1006/dbio.2001.0502. [DOI] [PubMed] [Google Scholar]
- 48.Sluss HK, Han Z, Barrett T, Davis RJ, Ip YT. A JNK signal transduction pathway that mediates morphogenesis and an immune response in Drosophila. Genes Dev. 1996;10:2745–2758. doi: 10.1101/gad.10.21.2745. [DOI] [PubMed] [Google Scholar]
- 49.Wray GA, Hahn MW, Abouheif E, Balhoff JP, Pizer M, Rockman MV, Romano LA. The evolution of transcriptional regulation in eukaryotes. Mol Biol Evol. 2003;20:1377–1419. doi: 10.1093/molbev/msg140. [DOI] [PubMed] [Google Scholar]