

Abstract
The study of lung emphysema dates back to the beginning of the 17th century. Nevertheless, a number of important questions remain unanswered because a quantitative localized characterization of emphysema requires knowledge of lung structure at the alveolar level in the intact living lung. This information is not available from traditional imaging modalities and pulmonary function tests. Herein, we report the first in vivo measurements of lung geometrical parameters at the alveolar level obtained with 3He diffusion MRI in healthy human subjects and patients with severe emphysema. We also provide the first experimental data demonstrating that 3He gas diffusivity in the acinus of human lung is highly anisotropic. A theory of anisotropic diffusion is presented. Our results clearly demonstrate substantial differences between healthy and emphysematous lung at the acinar level and may provide new insights into emphysema progression. The technique offers promise as a clinical tool for early diagnosis of emphysema.
Chronic obstructive pulmonary disease in general and emphysema in particular are leading causes of death in industrialized countries and account for a substantial portion of health care spending (1). Several definitions of emphysema have been formulated by scientific bodies: according to ref. 2, emphysema is “a condition of the lung characterized by abnormal, permanent enlargement of air spaces distal to the terminal bronchioles, accompanied by destruction of their walls, without fibrosis.” This definition means that an accurate characterization of emphysema requires diagnostic methods that are noninvasive and sensitive to the regional lung microstructure at the alveolar level in the living lung. Diffusion MRI of 3He gas, which has become available after recent advances in the physics of optical pumping and semiconductor diode lasers (see, for example, refs. 3–5), can provide this sensitivity.‖ Previously, we and others have suggested (6–10) that measurement of 3He gas diffusivity in the lung air spaces has potential for identifying changes in lung structure from emphysema at the alveolar level.
In any medium, atoms or molecules diffuse; that is, atoms perform a Brownian-motion random walk. In time interval Δ, in the absence of restricting walls or barriers, molecules will move a rms distance l0 = (2D0Δ)1/2 along any axis. The parameter D0 is termed the free diffusion coefficient, which for 3He in air at 37°C is D0 = 0.88 cm2/sec. Hence 3He gas atoms can wander distances on the order of 1 mm in times as short as 1 ms. The alveolar walls, as well as the walls of bronchioles, alveolar ducts, sacs, and other branches of the airway tree, serve as obstacles to the path of diffusing 3He atoms and reduce 3He displacement. Indeed, the MR-measured average 3He diffusion coefficient (the so-called apparent diffusion coefficient or ADC) in healthy human lungs is about 0.20 cm2/sec, more than a factor of four smaller than the free diffusion coefficient of 3He in air (6, 7). In emphysema, the restrictions to diffusion are lessened because of expansion of alveoli and airways and destruction of tissue, both of which result in increased diffusivity. Measurements in patients with severe emphysema reveal a wide distribution of values with an average ADC near 0.55 cm2/sec, an increase by a factor of 2.7 compared to normal lung (6, 7). This increase points to a large potential for clinical applications of ADC measurements with hyperpolarized 3He gas. However, it is not yet clear what specific features of the lung microstructure are probed by gas ADC measurements; this communication provides such understanding.
Previously, the discussion of restricted diffusion of gas in lungs has centered on alveolar size. However, alveoli are not closed objects, and the above displacement estimate indicates that 3He atoms can wander the length of several alveoli during the MR diffusion measurement of several milliseconds. Thus the structures we focus on here are cylindrical airways covered by alveolar sleeves, as represented in Fig. 1. Because gas motion along the axis of an airway is less restricted than perpendicular to the axis, diffusion in the lung is anisotropic. We show that this anisotropy manifests itself in the MRI signal, even though each imaging voxel contains a very large number of differently oriented airways that cannot be resolved by direct imaging. In particular, the anisotropy of diffusion results in nonexponential MR signal decay as a function of the weight b of the diffusion-sensitizing gradients, allowing the diffusion rates along and across the airways to be separately determined. A mathematical model relating the measurements of 3He gas diffusivity and lung microstructure is presented, including a relationship between airway radius and transverse diffusion rate. In vivo measurements of airway structure at the subacinar level in human lung are reported in healthy subjects and patients with emphysema.
Figure 1.

Schematic structure of two levels of respiratory airways. Open spheres represent alveoli forming an alveolar sleeve around each airway. Each respiratory airway can be considered geometrically as a cylindrical object consisting of a tube embedded in the alveolar sleeve. The diagram defines inner (r) and outer (R) radii (as in figure 1 in ref. 19). Inset schematically represents the structure of the same airways in emphysema, scaled down for clarity.
Theoretical Background
Diffusion Imaging.
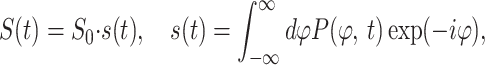
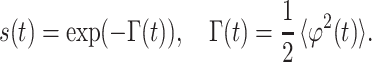
The simplest MR measurement of diffusion is the Stejskal–Tanner pulsed field gradient experiment (11), in which a free-induction decay MR signal is interrupted by two opposite-polarity gradient pulses (Fig. 2)—the so-called diffusion-sensitizing gradients. In the presence of gradient pulses, nuclear spins suffer a net phase shift proportional to their displacement during the diffusion time; the result is a decreased spin signal amplitude. In the case of unrestricted diffusion, the MR signal S decays S = S0 exp(−b D0). Here, S0 is the MR signal intensity in the absence of diffusion-sensitizing gradients, and the b value is determined by the gradient waveform shape. For the gradient pulses in Fig. 2, the corresponding b value is (12):
 |
1 |
 |
In all the experimental measurements reported in this paper, we use the following parameters for the diffusion-sensitizing gradient waveform:
 |
2 |
For Δ = 1.8 msec and the free diffusion coefficient of infinitely diluted 3He in N2 or air, D0 = 0.88 cm2/sec, the characteristic free displacement is equal to l0 = 0.56 mm.
Figure 2.

Pulse gradient waveform used to sensitize the MR signal to 3He gas molecular diffusion. Characteristic parameters of the waveform are the maximum gradient amplitude, Gm, the diffusion time Δ, the pulse width δ, and the ramp time τ. Parameter values used in the present experiments are listed in Eq. 2.
In the presence of barriers such as lung airway walls, the diffusive motion is restricted, and the MR signal decay is usually described in terms of the ADC:
 |
3 |
Contrary to the free diffusion case, where ADC is equal to D0 and depends only on the molecular properties, the ADC for restricted diffusion evaluated from Eq. 3 also depends on the tissue structure and timing details of the gradient waveform, as discussed below.
Lung Model.
To better understand the relationship between the measured ADC and lung structure, we first need to be able to describe the lung in terms of some basic geometrical elements. The structure of lung airways is usually considered as branching trees (13) or confluent rivers (14). In the model of branches, the hierarchy of the airway tree begins at the trachea and leads through bronchi and bronchioles to the terminal bronchiole that feeds each acinus—the major gas exchange unit in the lung. In humans, there are 14 generations of airways prior to the terminal bronchioles and another nine inside the acini (13). Gas ventilation in the trachea, bronchi, bronchioles, and terminal bronchioles occurs by convection (bulk flow), whereas diffusion is the primary ventilation mechanism beyond the terminal bronchioles—in the acini, where about 95% of gas resides (15). Functionally, the acinus is defined as the largest airway unit in which all airways participate in gas exchange (13). Geometrically, it represents the complex of all airways distal to a terminal bronchiole, starting with a first-order respiratory bronchiole. A large number of studies have been devoted to acinar geometry (see, for example, refs. 16–19). According to ref. 19, essentially all airways in the acinus are decorated by alveoli forming an alveolar sleeve (Fig. 1). In humans, an average acinar volume is about 187 mm3; intraacinar airways branch dichotomously over about nine generations; and the internal airway radius r falls from 250 to 135 μm, whereas the outer radius R (including the sleeve of alveoli) remains constant at 350 μm (19).
Anisotropic Diffusion.
The characteristic diffusion length l0 = 0.56 mm is much larger than the average alveolar radius of 0.15 mm; gas can diffuse out of alveoli and across the airways in the several-millisecond time duration of the MR ADC measurement. Thus, in our model of gas diffusion in lung, we consider airways rather than alveoli as the elementary geometrical units. We approximate the airways as long cylinders—either smooth (trachea, bronchi, and broncheoli) or covered with alveolar sleeves (respiratory broncheoli, alveolar ducts, and alveolar sacs). The alveolar walls, as well as the walls of alveolar ducts and other branches of the airway tree, serve as obstacles to the path of diffusing 3He atoms and reduce 3He diffusivity. Crucially, these restrictions are substantially less along the airway axis than perpendicular to it. If the diffusion-sensitizing gradient is applied along or perpendicular to the tube axis, the signal attenuation can be written in the form of Eq. 3 with ADC = DL or DT, the longitudinal or transverse ADC, respectively. For the case of an airway with the principal axis tilted from the field gradient direction by angle α, the ADC can be presented as (20)
 |
4 |
With the spatial resolution of several millimeters currently available with 3He MRI, each voxel contains hundreds of airways with different orientations. For each individual airway with orientation α, the signal attenuation is exponential with respect to b, according to Eqs. 3 and 4. Because of the ADC dependence on orientation angle α (Eq. 4), after summing the signals over all airways, the signal decay becomes nonexponential. This problem is mathematically similar to the problem of water diffusion in randomly oriented uniaxial layers (20). Because of the large number of acinar airways in each imaging voxel, their orientation distribution function can be taken as uniform, g(α) = sin α/2. Therefore, the signal S can be written as
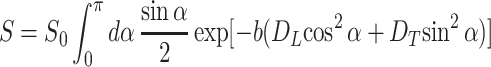 |
5 |
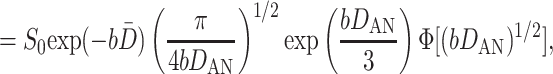 |
where Φ(x) is the error function, and the quantities D̄ and DAN
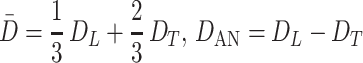 |
6 |
represent the mean ADC and the anisotropy of ADC, respectively. Eq. 5 assumes that all airways are similar; i.e., all airways have the same geometrical parameters and, consequently, the same values of DT and DL. Ideally, the expression for signal S should be further averaged with respect to the different airways' geometrical parameters. To keep the number of parameters small in the model, we assume that the diffusivities DT and DL already represent averaged values. We note that most of the gas resides in the acinus, and less than 5% of the gas resides in larger airways.
Introducing ADC similar to Eq. 3, we find from Eq. 5 that
 |
7 |
Thus, information about the orientationally averaged diffusivity is carried in the initial decay slope, whereas the anisotropy of diffusion determines the extent of nonexponential decay. At small b values, the exponent b ⋅ ADC is small for all orientations, so all airways contribute nearly equally to the measured signal. For large b values, the airways nearly parallel to the field gradient (G) have b ⋅ ADC ≫ 1, so the signal will be generated primarily by the other airways with smaller ADC (assuming DL > DT).
One important difference between the ADC for an individual airway (Eq. 4), which is anisotropic, and the isotropic averaged ADC obtained over a large voxel should be mentioned. The individual's airway ADC (Eq. 4) does not depend on the field gradient amplitude, Gm, whereas the ADC obtained over the large voxel does, because of the nonexponential dependence of the signal on b (Eq. 5), which in turn is a result of orientation averaging of the MR signals from the airways. A similar situation arises in the study of diffusion in randomly oriented closed yeast cells (21).
Relationship Between ADC and Airway Size.
Because alveoli are open polygons with openings nearly the same size as their diameters (Fig. 1), the gas diffusion perpendicular to the acinar airway direction can be approximated by the transverse diffusion in open smooth tubes. The characteristic radius R here is the outer radius of the airway. The signal attenuated by the diffusion-sensitizing gradients oriented perpendicular to the tube (airway) axes can be obtained from Eqs. A.2, A.5, and A.6 of the Appendix and are conveniently written in the form of Eq. 3 with the b value given by Eq. 1 and ADC = DT, an ADC for the transverse direction:
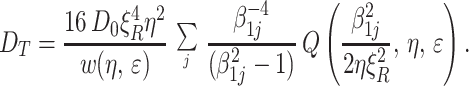 |
8 |
Here we have introduced dimensionless parameters
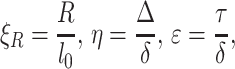 |
9 |
and the function w is defined as
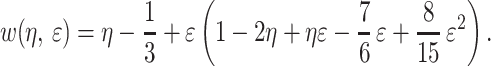 |
10 |
We recall that β1j is the jth (nonzero) root of the equation J′1(x) = 0, where J1 is the first order Bessel function, and function Q is defined by Eq. A.6. For small-to-moderate values, ξR ≤ 2, the general expression (Eq. 8) for DT can be approximated by the first term in the sum in Eq. 8 with the numerical coefficient β11 ≈ 1.84. In this range, the approximation describes the transverse ADC with an error that does not exceed 2%.
The ratio DT/D0 versus ξR, calculated by means of Eq. 8, is plotted in Fig. 3 for the present gradient waveform parameters (Eq. 2). Fig. 3 shows that for ξR < 0.5 (R < l0/2 = 0.28 mm), the transverse ADC, DT, is very small—less than 5% of the free diffusion coefficient D0. Qualitatively, the very small DT results from motional averaging effect during each half (+ or −) of the gradient pulse. Then, in the interval l0/2 < R < 2l0 (0.28 mm < R < 1.1 mm), the transverse diffusivity DT grows sharply to about 65% of D0. With further increase in the tube radius R, DT increases very slowly and approaches the 3He free diffusion coefficient D0 as 1/R, which means that for all airways with radius less then 1.1 mm, 3He diffusivity is substantially restricted (DT < D0).
Figure 3.

Transverse 3He diffusivity DT as a function of the airway external radius R. D0 is the 3He free diffusion coefficient in air, and l0 = (2D0 Δ)1/2 is the characteristic diffusion length. The gradient waveform parameters Δ = δ = 1.8 msec, and τ = 0.5 msec are described in Fig. 2.
Two main features restrict diffusion along the acinar airways and lead to a reduction in the longitudinal ADC, DL, compared to the free diffusion coefficient D0. First, the airways are decorated by alveolar sleeves as in Fig. 1; second, some airways (alveolar sacs) are open only from one side, where they are connected to alveolar ducts and respiratory bronchioles. From the point of view of longitudinal diffusion, the alveolar sleeves play the role of “traps,” effectively blocking long-range motion along the tube axis. For diffusion times Δ much shorter than the characteristic diffusion time across alveoli, longitudinal diffusion remains largely unrestricted and can be approximated by the free diffusion coefficient D0. For longer diffusion times Δ such as are used here, DL can be approximated as D0(r/R)2. This expression is valid only for open airways and can be further reduced in alveolar sacs that are open only from one side.
Methods
Eq. 5 is the basis for separation of longitudinal and transverse ADCs. Indeed, by collecting a series of MR images with different b values and fitting the data to Eq. 5 on a pixel-by-pixel basis, we can create maps of the mean and anisotropic ADCs, D̄ and DAN. The transverse and longitudinal ADCs are then obtained from Eq. 6, and the mean airway radius R is obtained from Eq. 8 or Fig. 3. The 3He free diffusion coefficient D0 entering Eq. 8 varies slightly with the concentration of 3He in the lung. For each subject, D0 is taken from the ADC measured in the trachea where diffusion is unrestricted. We use an imaging technique for 3He diffusion measurement with six two-dimensional gradient echo sequences combined so that each has its own same small-angle radio frequency (RF) pulse and its own same slice selection, phase encode, and read-out gradients. Data are collected in an interleaved manner by collecting the same line in k space for all six images before stepping to the next line, ensuring reduced sensitivity to motion artifacts. The standard central reordering of phase encoding is used to reduce the possible influence of signal decay during acquisition. All six sequences, except the first one, include diffusion-sensitizing gradients with increasing amplitudes, Gm, and consisting of one bipolar pulse pair as in Fig. 2. The corresponding b values are 0, 1.5, 3, 4.5, 6, and 7.5 sec/cm2. The diffusion gradient is applied perpendicular to the long axis of the body. For a typical experiment, we use a slice thickness of 20 mm and an in-plane resolution of 7 × 7 mm (225 × 450 mm field of view with 32 × 64 k space samples). Each of the 32 lines in k space uses an RF excitation of about 7°, allowing for repeated acquisition from the same hyperpolarized spins. The gradient echo time in all sequences is 7.2 ms.
All images were acquired with a 1.5-T whole-body Siemens (Iselin, NJ) Magnetom Vision scanner. Homemade double-tuned RF Helmholtz coils were used to transmit and receive the MRI signal at the 1H and 3He resonance frequencies. Switching of the operating frequency was performed without moving the subject, allowing for better registry and comparison between 3He and 1H scout images. After the RF coils were placed above and below the chest, the subject was positioned supine in the MR magnet. First, scout images were obtained by using conventional proton MRI. These proton images were used to select the slices and orientations for the 3He images and for anatomic reference to the 3He images. Then, the hyperpolarized 3He gas mixed with nitrogen was delivered to the subject through plastic ventilator tubing connected to a mouthpiece. Imaging was performed during breathhold at the end of full inhalation. Four slices were obtained from each subject in less then 10 sec, except for one normal volunteer with only three slices because of inadequate signal-to-noise ratio (SNR). Diffusivity maps were obtained by fitting experimental data to Eq. 5 on a pixel-by-pixel basis by using Bayesian probability theory with uninformative prior probabilities. Two normal volunteers and four patients with severe emphysema selected for lung volume reduction surgery were studied.
Results and Discussion
Diffusion MRI with hyperpolarized 3He gas was performed with sufficient SNR (>100) to allow the separate determination of longitudinal and transverse ADCs at each pixel. In all subjects, both normal and emphysema patients, gas diffusivity is anisotropic, with the mean longitudinal ADC being usually two to three times as large as the mean transverse ADC. Representative maps of ADCs and the mean radii of acinar airways deduced from DT (Eq. 8 and Fig. 3) are shown in Fig. 4 for one normal subject and two patients with severe emphysema. Results for all subjects are summarized in Table 1. The following points are evident from our results.
Figure 4.

Representative single-slice maps of diffusivities for a normal subject (N1) and two patients with severe emphysema (P1 and P2). From left to right, the columns display the orientationally averaged diffusivity D̄, the longitudinal ADC value DL, the transverse ADC value DT, and the mean airway radius R. The color scale on the right represents diffusivity coefficients in cm2/sec and airway radii in millimeters. Each color corresponds to 0.05 unit. Brown arrows point to an area of emphysematous lung with minor airway destruction, pink arrows point to an area of emphysematous lung with moderate airway destruction, and green arrows point to a lung area with severe emphysema. The small high-diffusivity regions in N1 are the two major bronchi just below their branching from the trachea.
Table 1.
Summary of results obtained from two normal subjects (N1 and N2) and four patients with severe emphysema selected for lung volume reduction surgery (P1–P4)
| D̄ | DL | DT | R | DL/DT | |
|---|---|---|---|---|---|
| N1 | 0.23 | 0.42 | 0.13 | 0.38 | 3.23 |
| 0.21 | 0.40 | 0.12 | 0.37 | 3.48 | |
| 0.20 | 0.38 | 0.11 | 0.36 | 3.55 | |
| 0.19 | 0.38 | 0.10 | 0.36 | 3.68 | |
| N2 | 0.18 | 0.31 | 0.11 | 0.36 | 2.87 |
| 0.18 | 0.31 | 0.11 | 0.37 | 2.85 | |
| 0.16 | 0.28 | 0.09 | 0.35 | 2.99 | |
| P1 | 0.43 | 0.75 | 0.27 | 0.56 | 2.79 |
| 0.38 | 0.70 | 0.21 | 0.49 | 3.25 | |
| 0.36 | 0.68 | 0.20 | 0.47 | 3.41 | |
| 0.48 | 0.79 | 0.31 | 0.61 | 2.55 | |
| P2 | 0.49 | 0.82 | 0.32 | 0.64 | 2.53 |
| 0.48 | 0.82 | 0.31 | 0.63 | 2.60 | |
| 0.45 | 0.78 | 0.28 | 0.58 | 2.80 | |
| 0.41 | 0.74 | 0.24 | 0.53 | 3.05 | |
| P3 | 0.57 | 0.91 | 0.39 | 0.73 | 2.36 |
| 0.50 | 0.85 | 0.32 | 0.64 | 2.66 | |
| 0.36 | 0.71 | 0.18 | 0.46 | 3.89 | |
| 0.26 | 0.51 | 0.13 | 0.39 | 3.97 | |
| P4 | 0.38 | 0.67 | 0.23 | 0.52 | 2.85 |
| 0.35 | 0.63 | 0.21 | 0.48 | 3.03 | |
| 0.32 | 0.60 | 0.18 | 0.44 | 3.39 | |
| 0.31 | 0.59 | 0.17 | 0.44 | 3.43 |
Rows for each subject represent mean data (ADC values in cm2/sec and airway radii R in millimeters) for individual axial lung sections, in descending order from apices to lung base.
In healthy subjects, transverse diffusivity is strongly restricted, with the mean DT almost eight times smaller than the 3He free diffusion coefficient in air (D0 = 0.88 cm2/sec). The maps defining DT and the resulting external radii R of the acinar airways (including the alveolar sleeves depicted in Fig. 1) are highly homogeneous. The mean R changes between 0.38 and 0.36 mm from apices to base for the first subject and from 0.36 to 0.35 mm for the second subject. Given that our in vivo measurements were made during full inhalation, this result is in remarkable agreement with the in vitro measurements of mean R = 0.35 mm (19). In these subjects, the mean longitudinal ADCs, DL, are less than half of the 3He free diffusion coefficient, which is mainly the result of the restrictions to diffusion imposed by the walls separating neighboring alveoli along the same airway, as depicted in Fig. 1. In the healthy subjects, both DT and DL decrease from apices to base; similar variation is present in some patients. As our subjects are supine, gravity effects do not explain this variation.
In patients with severe emphysema, nearly all transverse ADC maps show increased DT as compared to normal subjects, but the diffusion is still restricted (DT < D0). The increase in DT is consistent with an increase in the mean airway radius R. The longitudinal ADC, DL, is also substantially elevated, becoming practically unrestricted in some parts of the lungs (DL ≅ D0). This effect is consistent with the approximation DL ≈ D0 (r/R)2 discussed above and with an inflation of the airways that results in r approaching the value of R (see Fig. 1, Inset).
The relationship 8 between transverse ADC and airway radius R was derived under the assumption that the diffusing 3He atoms cannot penetrate through the alveolar walls. However, alveolar walls always have pores. In normal lung, the number of pores (known as pores of Kohn) is very small, generally smaller than 10 μm in diameter (22); hence, their effect on DL and DT and relationship 8 is negligible. However, in emphysematous lung, many more pores (known as fenestrae) of variable sizes occur in alveolar walls (23). The destruction of alveolar walls in emphysema will contribute to the above-discussed increases in longitudinal and transverse ADCs. Thus, in light of tissue destruction in emphysema, the relationship 8 should be considered an approximation, and the calculated R should be regarded as an apparent radius of the airways.
The average ADCs here, D̄, are similar to previously reported ADC measurements for healthy subjects and patients with severe emphysema (6, 7, 10). However, previous work used only two b values and effectively assumed exponential signal decay as a function of b through the diffusion-sensitizing gradient strength. As is evident from present results and analysis (see, for example, Eq. 7), the ADC in lungs determined from the two-b method depends on b value and approaches the true orientation-average value D̄ from below only in the limit of vanishing b. The D̄ values reported herein provide a more objective result, because they do not depend on the diffusion-sensitizing gradient strength. At the same time, all ADCs measured with our technique still depend on the timing parameters of the diffusion-sensitizing gradients (see Fig. 2), providing opportunities to study diffusion on different time scales to probe the lung structure on different spatial length scales.
The above analysis allows us to draw some general conclusions about gas diffusivity in normal and emphysematous lungs and to develop some notions about emphysema progression. Our patient pool has been selected for lung-volume reduction surgery and therefore has very heterogeneous presentations of the disease. As a result, most of the DT and DL maps in the patients are highly inhomogeneous, showing regions of nearly normal as well as very abnormal lung tissue. This inhomogeneity provides an opportunity to follow the dynamics of lung destruction through the progression of emphysema by examining the variations within each patient, as well as between patients. For example, brown arrows in Fig. 4 point to a quasinormal area of lung in Patient 1. Here, transverse diffusivity is only 30% increased compared to a normal lung (see similar area in the image above). This transverse diffusivity corresponds to a mean airway external radius of R = 0.42 mm, according to Fig. 3. However, the longitudinal diffusivity in this area of the lung is increased by about 60%. Pink arrows point to an area of lung that has an intermediate level of emphysema (Patient 2)—here DT is increased by almost 100% (corresponding to R = 0.52 mm), whereas DL is elevated by about 80%, nearly equal to unrestricted value. Up to this stage, we can envision that emphysema progresses by expansion of airways without substantial destruction of alveolar walls; this picture is entirely consistent with recent findings (24). Green arrows point to a highly emphysematous lung region in Patient 2, where the transverse ADC is 0.62 cm2/sec—more than four times as large as in normal lung—whereas the longitudinal ADC is only 90% elevated. This result indicates that, according to Fig. 3, the mean external airway radius has become larger than 1 mm. The large increase in apparent radius R and the concomitant decrease in anisotropy (DL/DT) suggest substantial tissue destruction in this region. These data indicate that the longitudinal ADC, DL, is the more sensitive parameter for identifying early stages of emphysema, whereas the transverse ADC, DT, is the more sensitive parameter for identifying lung tissue destruction as emphysema progresses (because DL cannot increase beyond D0).
If very large improvements in spatial resolution were achieved, the measured anisotropy of 3He ADC could be used to trace the connections between airways, similar to neuronal fiber tracking in brain (25).
Conclusions
Different methods have been used in the past to evaluate lung microstructure. The most powerful, x-ray-computed tomography, is capable of providing local in vivo measurements of lung-tissue density but does not have sufficient resolution to reveal the structure of acinar airways. In principle, the in vitro gold standard—histology—can provide information on this structure but is invasive and restricted to a very small number of lung tissue samples. The noninvasive approach described herein is based on 3He diffusion MRI. Analysis of the nonexponential signal decay on a pixel-by-pixel basis yields separate values for the ADC along and across the acinar airways, despite the fact that individual airways are too small to be resolved directly. A mathematical model links the transverse ADC and the mean airway radius R. Our in vivo measurements of R in normal lungs are in excellent agreement with previous in vitro results. The results demonstrate substantial differences between healthy and emphysematous lung at the acinar level and may provide new insights into emphysema progression.
Acknowledgments
We are grateful to Drs. R. Gilbert Jost, Joseph J. H. Ackerman, Marcus E. Raichle, and Robert C. McKinstry for helpful discussions. We appreciate the very substantial and helpful comments of an anonymous reviewer. This work was supported by a Scholar award from the Radiology Society of North America (D.A.Y.).
Abbreviation
- ADC
apparent diffusion coefficient
Appendix
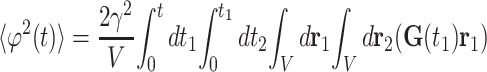
The MR signal produced by a system of precessing spins is the sum of the signals produced by the individual spins at time t after the RF pulse:
 |
A.1 |
where the coefficient, S0, describes the MR signal that would exist in the absence of diffusion sensitizing gradients, and P(ϕ, t) is the phase distribution function. According to the Gaussian phase distribution approach (26, 27), the function P(ϕ, t) is Gaussian, and the MR signal is:
 |
A.2 |
In the presence of an inhomogeneous magnetic field,
B = B(r, t) =G(t)⋅r (G is the field
gradient), the Larmor frequency ω = γB (γ is the
gyromagnetic ratio) also varies with spatial location of the spin;
therefore the phase ϕi(t) accumulated by a
spin takes the form ϕi(t) =
∫ dt1
ω(rk(t1), t1).
This phase depends not only on the time t and the initial
position of the spin, r
dt1
ω(rk(t1), t1).
This phase depends not only on the time t and the initial
position of the spin, r , but on
all the points along the trajectory rk(t)
as well. Therefore, making use of the Markovian character of diffusion
processes, the quantity 〈ϕ2〉 can be
written in the form
, but on
all the points along the trajectory rk(t)
as well. Therefore, making use of the Markovian character of diffusion
processes, the quantity 〈ϕ2〉 can be
written in the form
 |
 |
A.3 |
where the propagator function P(r1,r2, t) describes the probability of a particle initially at r1 moving to the point r2 during the time interval t. The integration in Eq. A.3 is over the system volume, V. When the field gradient is perpendicular to the airway principal axis, the propagator is a solution of the two-dimensional diffusion equation within a circle of radius R (see, e.g., ref. 28):
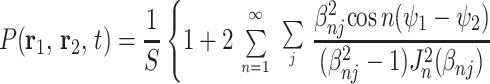 |
A.4 |
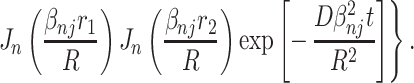 |
Here r = r (cos ψ, sin ψ) is a two-dimensional vector, S = 4πR2, Jn are the Bessel functions, and βnj is the jth (nonzero) root of the equation J′n(x) = 0 (prime denotes derivative with respect to the argument).
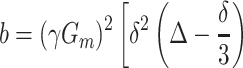
Substituting Eq. A.4 into Eq. A.3, after tedious but straightforward calculation, we obtain the transverse attenuation exponent, ΓT,
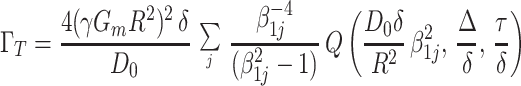 |
A.5 |
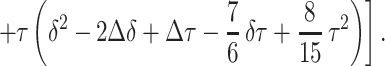
The function Q(a, η, ɛ) is given by
 |
A.6 |
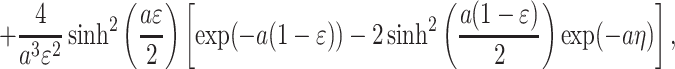 |
where a =
D0β δ/R2, η =
Δ/δ, ɛ = τ/δ. If the field gradient waveform has no
ramp (τ = 0), Eq. A.5 reduces to the well known
result (e.g., refs. 27, 29). However, we should emphasize that in real
experiments, the ramp time τ is of the same order as the gradient
pulse duration δ, and therefore it cannot be neglected.
δ/R2, η =
Δ/δ, ɛ = τ/δ. If the field gradient waveform has no
ramp (τ = 0), Eq. A.5 reduces to the well known
result (e.g., refs. 27, 29). However, we should emphasize that in real
experiments, the ramp time τ is of the same order as the gradient
pulse duration δ, and therefore it cannot be neglected.
Footnotes
This paper was submitted directly (Track II) to the PNAS office.
Here diffusion refers to Brownian motion of 3He gas in the lung airspace; helium is virtually insoluble in tissue. Diffusion is unrelated to diffusing capacity, a measure of blood–gas interfacial area commonly determined by CO uptake.
References
- 1.Barnes P J. N Engl J Med. 2000;343:269–280. doi: 10.1056/NEJM200007273430407. [DOI] [PubMed] [Google Scholar]
- 2.Snider G L, Kleinerman J, Thurlbeck W M, Bengali Z H. Am Rev Respir Dis. 1985;132:182–185. [Google Scholar]
- 3.Happer W. Ann Phys Fr. 1985;10:645–657. [Google Scholar]
- 4.Walker T G, Happer W. Rev Mod Phys. 1997;69:629–642. [Google Scholar]
- 5.Leawoods J C, Yablonskiy D A, Saam B, Gierada D S, Conradi M S. Concepts Magn Reson. 2001;13:277–293. [Google Scholar]
- 6.Yablonskiy D A, Saam B T, Gierada D S, Lefrak S S, Cooper J D, Conradi M S. Radiology. 1999;213P:1061. [Google Scholar]
- 7.Saam B T, Yablonskiy D A, Kodibagkar V D, Leawoods J C, Gierada D S, Cooper J D, Lefrak S S, Conradi M S. Magn Reson Med. 2000;44:174–179. doi: 10.1002/1522-2594(200008)44:2<174::aid-mrm2>3.0.co;2-4. [DOI] [PubMed] [Google Scholar]
- 8.Chen X J, Moller H E, Chawla M S, Cofer G P, Driehuys B, Hedlund L W, Johnson G A. Magn Reson Med. 1999;42:721–728. doi: 10.1002/(sici)1522-2594(199910)42:4<721::aid-mrm14>3.0.co;2-d. [DOI] [PubMed] [Google Scholar]
- 9.Chen X J, Hedlund L W, Moller H E, Chawla M S, Maronpot R R, Johnson G A. Proc Natl Acad Sci USA. 2000;97:11478–11481. doi: 10.1073/pnas.97.21.11478. [DOI] [PMC free article] [PubMed] [Google Scholar]
- 10.Salerno M, Brookeman J R, de Lange E E, Knight-Scott J, Mugler J P., 3rd . Proceedings of the 8th Conference of International Society for Magnetic Resonance in Medicine, Denver, CO. 2000. p. 9. [Google Scholar]
- 11.Stejskal E O. J Chem Phys. 1965;43:3597–3603. [Google Scholar]
- 12.Basser P J, Mattiello J, LeBihan D. Biophys J. 1994;66:259–267. doi: 10.1016/S0006-3495(94)80775-1. [DOI] [PMC free article] [PubMed] [Google Scholar]
- 13.Weibel E. In: The Lung: Scientific Foundations. Crystal R G, West J B, Barnes P J, Cherniack N S, editors. New York: Raven; 1991. pp. 711–720. [Google Scholar]
- 14.Horsfield K. In: The Lung: Scientific Foundations. Crystal R G, West J B, Barnes P J, Cherniack N S, editors. New York: Raven; 1991. pp. 721–727. [Google Scholar]
- 15.West J B. Respiratory Physiology—The Essentials. Baltimore: Williams & Wilkins; 1995. [Google Scholar]
- 16.Phalen R F, Oldham M J. Am Rev Respir Dis. 1983;128:S1–S4. doi: 10.1164/arrd.1983.128.2P2.S1. [DOI] [PubMed] [Google Scholar]
- 17.Plopper C G, Mariassy A T, Lollini L O. Am Rev Respir Dis. 1983;128:S4–S7. doi: 10.1164/arrd.1983.128.2P2.S4. [DOI] [PubMed] [Google Scholar]
- 18.Bastacky J, Hayes T L, von Schmidt B. Am Rev Respir Dis. 1983;128:S7–S13. doi: 10.1164/arrd.1983.128.2P2.S7. [DOI] [PubMed] [Google Scholar]
- 19.Haefeli-Bleuer B, Weibel E R. Anat Rec. 1988;220:401–414. doi: 10.1002/ar.1092200410. [DOI] [PubMed] [Google Scholar]
- 20.Callaghan P T. Principles of Nuclear Magnetic Resonance Microscopy. New York: Oxford Univ. Press; 1991. p. 349. [Google Scholar]
- 21.Cheng Y, Cory D G. J Am Chem Soc. 1999;121:7935–7936. [Google Scholar]
- 22.Nagai A, Thurlbeck W M, Konno K. Am J Respir Crit Care Med. 1995;151:635–639. doi: 10.1164/ajrccm/151.3_Pt_1.635. [DOI] [PubMed] [Google Scholar]
- 23.Nagai A, Thurlbeck W M. Am Rev Respir Dis. 1991;144:901–908. doi: 10.1164/ajrccm/144.4.901. [DOI] [PubMed] [Google Scholar]
- 24.Coxson H O, Rogers R M, Whittall K P, D'Yachkova Y, Pare P D, Sciurba F C, Hogg J C. Am J Respir Crit Care Med. 1999;159:851–856. doi: 10.1164/ajrccm.159.3.9805067. [DOI] [PubMed] [Google Scholar]
- 25.Conturo T E, Lori N F, Cull T S, Akbudak E, Snyder A Z, Shimony J S, McKinstry R C, Burton H, Raichle M E. Proc Natl Acad Sci USA. 1999;96:10422–10427. doi: 10.1073/pnas.96.18.10422. [DOI] [PMC free article] [PubMed] [Google Scholar]
- 26.Douglass D C, McCall D W. J Phys Chem. 1958;62:1102–1107. [Google Scholar]
- 27.Neuman C H. J Chem Phys. 1973;60:4508–4511. [Google Scholar]
- 28.Carslaw H S, Jaeger J C. Conduction of Heat in Solids. Oxford: Claredon; 1959. [Google Scholar]
- 29.Wang L Z, Caprihan A, Fukushima E. J Magn Reson, Ser A. 1995;117:209–219. [Google Scholar]