

Abstract
The neural response to a stimulus presented as part of a rapid sequence is often quite different from the response to the same stimulus presented in isolation. In primary auditory cortex (A1), although the most common effect of preceding stimuli is inhibitory, most neurons can also exhibit response facilitation if the appropriate spectral and temporal separation of sequence elements is presented. In this study, we investigated whether A1 neurons in adult animals can develop context-dependent facilitation to a novel acoustic sequence. After repeatedly pairing electrical stimulation of the basal forebrain with a three-element sequence (high frequency tone–low frequency tone– noise burst), 25% of A1 neurons exhibited facilitation to the low tone when preceded by the high tone, compared with only 5% in controls. In contrast, there was no increase in the percent of sites that showed facilitation for the reversed tone order (low preceding high). Nearly 60% of sites exhibited a facilitated response to the noise burst when preceded by the two tones. Although facilitation was greatest in response to the paired sequence, facilitation also generalized to related sequences that were either temporally distorted or missing one of the tones. Pairing basal forebrain stimulation with the acoustic sequence also caused a decrease in the time to peak response and an increase in population discharge synchrony, which was not seen after pairing simple tones, tone trains, or broadband stimuli. These results indicate that context-dependent facilitation and response synchronization can be substantially altered in an experience-dependent fashion and provide a potential mechanism for learning spectrotemporal patterns.
More than 90% of primary auditory cortex (A1) neurons exhibit context-dependent facilitation to some combination of tones (1–5). Facilitated responses are most frequent when the two tones are separated by 1 octave and 100 ms. Although recent work has shown that context-dependent facilitation is common in both real and simulated neural networks (3, 5–7), it is not yet clear how this facilitation contributes to the coding of sensory streams rich in spectrotemporal transitions, such as music and speech. Auditory neurons in many species, including humans, exhibit facilitated responses to species-specific vocalizations (8–15). Experience-dependent plasticity mechanisms are known to sharpen the neural representation of behaviorally relevant stimuli (16–19).
Previous studies have shown that cortical receptive fields and temporal response properties can be substantially reorganized in an experience-dependent manner as a result of behavioral training or basal forebrain (BF) stimulation (20–26). The demonstration that cortical selectivity for simple stimuli remains plastic throughout adulthood has provided important insight into both the mechanisms and functional consequences of cortical plasticity. In this study, we used BF stimulation to explore how cortical plasticity contributes to the coding of spectrotemporally complex acoustic stimuli. Pairing BF stimulation with a three-element sequence (composed of a high frequency tone, a low frequency tone, and a noise burst) improved the cortical representation of the sequence by using two apparently independent strategies: context-dependent facilitation and increased response synchronization.
Methods
Five rats were implanted with platinum bipolar BF-stimulating electrodes by using sterile stereotaxic techniques approved by the University of California at San Francisco animal care committee (as in refs. 23 and 25). The bone screws used to anchor the electrode assembly also served as electrodes to record a global electroencephalogram (EEG). After 2 weeks of recovery, lightweight leads were connected, and each animal was placed in a sound-shielded, calibrated test chamber. A three-element sequence of sounds was repeatedly paired with BF stimulation 5 days per week for 4 weeks (∼400 pairings per day). The sequence consisted of a high-frequency tone (12 kHz), a low-frequency tone (5 kHz), and a noise burst, with 100 ms separating element onsets. Each element was 50 dB sound pressure level and 25-ms-long with 3-ms amplitude ramps. Auditory stimuli were generated with a CD player that triggered a constant current source (BAK Electronics, Mount Airy, MD) to deliver 20 capacitively coupled biphasic pulses (0.1-ms pulse width, 10-ms interpulse interval) at the end of each sequence. The animals were unanesthetized and unrestrained during these sessions. The current level (70–140 μAmp) for BF stimulation was selected for each animal to be the minimum necessary to desynchronize the EEG during slow-wave sleep for 1–2 s. The acoustic and electrical stimuli did not evoke any observable behavioral responses, i.e., did not cause rats to stop grooming, or awaken, if sleeping. In addition to the sequence paired with BF stimulation, four other sequences were randomly interleaved but not paired to encourage the development of order-sensitive responses. The sequences all had 100-ms stimulus onset asynchronies (SOAs) and included high–high–high, low–low–low, noise–noise–noise, and noise–low–high. Thus, all three-sequence elements occurred equally often but were paired only with BF stimulation when they occurred in the high–low–noise sequence. At least 10 s of silence separated every sequence.
Twenty-four hours after the last pairing session, animals were anesthetized with barbiturate, and the right A1 was exposed (as in ref. 25). Multi-unit recordings were derived from 35 to 70 penetrations in each animal over the course of each 18–30-h experiment. Throughout the surgical procedures and during the recording session, a state of areflexia was maintained with supplemental doses of dilute pentobarbital. Calibrated free-field acoustic stimuli (ACO-7016 microphone) were presented to duplicate the sensory input experienced during BF pairing. No electrical stimulation was delivered during the acute physiology experiments. Recordings were made in a double-walled sound chamber lined with acoustic foam. Action potentials were recorded simultaneously from two Parylene-coated tungsten microelectrodes (FHC, Bowdoinham, ME) lowered orthogonally into the cortex to a depth of ∼550 μm (layers IV/V). Datawave neurophysiology hardware and software were used for stimulus production and data acquisition. On average, 20 penetrations per rat were within A1 and are described in this report. Penetration sites were chosen to avoid damaging blood vessels while generating a detailed and evenly spaced map. To prevent the introduction of experimenter bias in selecting recording sites, no analysis or visualization of neural responses to the sequences was performed during control or experimental recording sessions. A frequency-intensity-tuning curve was derived for each site (61 frequencies at 16 intensities). Neural responses to the three stimuli presented during BF pairing were recorded both in isolation and in the context of six basic variations of the paired sequence. (i) The effect of the tones on the noise burst was determined by omitting each tone, as well as reversing the order of the tones; (ii) the reversed sequence was presented; and (iii) the tempo was altered (50- or 200-ms SOA). The two tones were also repeated (high–high and low–low, 100-ms SOA) to establish the specificity of the response facilitation that developed. Twenty repetitions of each of the sequence elements presented alone and in the following combinations were randomly interleaved: HLN (50, 100, 200 ms), NLH (100 ms), LHN (100 ms), LN (100 ms), HN (200ms), LL (100 ms), and HH (100 ms), where H means high tone (12 kHz), L means low tone (5 kHz), and N means noise burst (SOA is shown in parentheses). All stimuli were 50 dB SPL 25-ms-long with 3-ms amplitude ramps and presented every 3 s.
Context-dependent facilitation was evaluated by comparing the response (i.e., number of spikes) to a sequence element when preceded by other elements of the sequence compared with the response to the same element in isolation. Only A1 neurons with characteristic frequencies within one octave (2.5–24 kHz) of the two tones used in the sequences were included in the analysis of context-dependent facilitation. If anesthesia effects suppressed context-dependent facilitation, our results may underestimate the degree of facilitation that developed with BF-sequence pairing (see ref. 27). Two different methods were used to document the increase in the proportion of sites exhibiting context-dependent facilitation after BF-sequence pairing. In the first, individual sites were considered to exhibit context-dependent facilitation if the response to a single sequence element was significantly increased (two-tailed t test, P < 0.001) when preceded by another sequence element compared with the response when presented in isolation (i.e., more spikes in response to a 5-kHz tone when preceded by a 12-kHz tone 100 ms earlier than in response to the same 5-kHz tone in isolation). The percent of neurons exhibiting context-dependent facilitation for each of the experimental (n = 5 rats) and naïve (n = 8 rats) animals was compared by using a two-tailed t test.
The second method for quantifying context-dependent facilitation avoided a strict definition of which sites exhibited significant facilitation and simply compared the mean facilitation index for all sites from experimental (n = 103 sites) and control animals (n = 158 sites). The facilitation index is 100 times the logarithm base-two of the ratio of the number of spikes in response to a stimulus element in the context of a sequence and the number of spikes in response to the same element in isolation. The examples shown in Fig. 1 have facilitation indices for the noise burst at the end of the paired sequence (51, 74, and 43, respectively) that are representative of the average index (47) after BF-sequence pairing.
Figure 1.

Examples of context-dependent facilitation in A1 neurons after pairing BF stimulation with a high–low–noise sequence (12 kHz–5 kHz–noise burst, 100-ms SOA). (A–C) The colored lines under each PSTH indicate the sequence of stimuli presented. The black numbers to the right indicate the mean number of spikes evoked by each stimulus element (9–33 ms after element onset). Colored numbers to the right indicate statistically significant response facilitation (P < 0.001). Colored arrows illustrate key comparisons for each section. (A) The response to the noise burst was facilitated if preceded by the paired sequence (red arrow), but not by any of the other sequences tested. (B) This site exhibited the same facilitation seen in A, but also gave facilitated responses to the noise burst each time it was preceded by the low tone (red arrows). Response facilitation occurred despite weak responses to both the high and low tones. (C) This site showed the same facilitation seen in B, but also exhibited a facilitated response to low when preceded by high (green arrows) and not high when preceded by low. The PSTH for the reversed sequence is shown delayed by 200 ms to facilitate comparison with other responses to the noise burst in different sequence positions. None of these examples exhibited significant facilitation for repeated high or low tones, or for the two tones in reversed order (100-ms SOA). Responses to each element in isolation were also recorded, but are not shown. Characteristic frequencies for the three sites were 18, 5, and 12 kHz, respectively.
Tuning curve parameters (including minimum latency and average time to peak) were defined by an experienced blind observer by using an interface specifically designed for this purpose (as in ref. 25). A1 was defined on the basis of its short latency (8–20 ms) responses and its continuous tonotopy, and boundaries were determined by using nonresponsive and non-A1 sites (as in ref. 25). Population post-stimulus time histograms (PSTHs) reflect the mean response of all sites within the specified region of A1 to the paired sequence.
Results
Order-Sensitive Plasticity in A1.
Fig. 1A illustrates the simplest form of context-dependent facilitation to develop from pairing BF stimulation with the high–low–noise sequence. At this site, the response to the noise burst was facilitated by 42% when it was preceded by the two tones present in the paired sequence compared with the response to the noise burst presented as the first element of a sequence (2.2 vs. 1.5 spikes per noise burst, P < 0.0001; Fig. 1A, see red arrow). In contrast, no significant facilitation was observed when the sequence was altered by either removing one of the tones or reversing their order (Degraded or Tones Reversed). Likewise, no facilitation was observed if the sequence tempo was faster or slower than the paired sequence (Compressed or Stretched: 50- or 200-ms SOA instead of 100 ms) or if the sequence was reversed. Thus, the response facilitation at this site was specific to the paired stimulus sequence and did not generalize to other similar sequences.
Fig. 1B provides an example of a site that also exhibited strong facilitation to the noise burst when preceded by the high and low tones (67% facilitation, P < 0.0001), but generalized more broadly to other similar sequences. In this case, it appears that the 5-kHz tone caused facilitation of the noise burst response lasting up to 200 ms (Fig. 1B, see red arrows). This site had a nonmonotonic frequency-intensity-tuning curve with a characteristic frequency of 5 kHz. One explanation of the observed facilitation is that the inhibition caused by the 5-kHz tone caused rebound excitation that resulted in a facilitated response to the noise burst up to 200 ms later.
The site shown in Fig. 1C exhibited facilitation of the noise burst response similar to that seen above, but also exhibited substantial facilitation of the low tone when preceded by the high tone 100 or 200 ms earlier (195 or 175% facilitation, P < 0.0001; Fig. 1C, see green arrows). The noise burst (which contains high-frequency power) also caused facilitation of the response to the low tone. As in Fig. 1 A and B, the low tone did not significantly facilitate the response to the high tone.
These three examples illustrate the common forms of response facilitation that developed with exposure to the high–low–noise sequence paired with BF activation. Table 1 shows that BF stimulation substantially increased the percent of cortical neurons that exhibited significant response facilitation for spectrotemporal transitions present in the paired sequence. After BF-sequence pairing, 5 times as many neurons had facilitated responses to the low tone when preceded by the high tone 100 ms earlier compared with naïve controls (25 vs. 5%, P < 0.0001). Nearly 60% of A1 neurons in conditioned animals responded more strongly to the noise burst when preceded by the high and low tones. The facilitation that developed with BF-sequence pairing was often tolerant to minor variations in the paired sequence. For example, after conditioning, 42% of sites showed significant response facilitation to the noise preceded by only one of the two tones (i.e., to one or the other of the Degraded Sequences), compared with 19% in controls (P < 0.05). The tolerance of these sites to some variation from the original sequence is likely to be indicative of the spectrotemporal receptive field plasticity responsible for context-dependent facilitation and may contribute to behavioral generalization of complex stimuli (28–30).
Table 1.
Pairing BF stimulation with a high–low–noise sequence caused the development of context-dependent facilitation in adult A1
| Percent of sites
with significant facilitation (facilitation index)
|
|||||
|---|---|---|---|---|---|
| Second sequence element
|
Third sequence
element
|
||||
| Naïve controls | After HLN pairing | Naïve controls | After HLN pairing | ||
| Paired sequence | H L N - 100 ms | 5% (−4) | 25%* (35*) | 35% (23) | 58%* (47*) |
| Tones reversed | L H N - 100 ms | 13% (−1) | 10% (13) | 24% (37) | 56%* (61*) |
| Repeat low | L L - 100 ms | 5% (−11) | 14% (−6) | — | — |
| Repeat high | H H - 100 ms | 9% (1) | 10% (−2) | — | — |
| Sequence reversed | N L H - 100 ms | 5% (−16) | 20%* (−2) | 22% (46) | 24% (51) |
| Compressed | H L N - 50 ms | 2% (−108) | 0% (−103) | 12% (−67) | 17% (−58) |
| Stretched | H L N - 200 ms | 7% (38) | 19%* (41) | 30% (48) | 46% (57) |
| Degraded sequences | L N - 100 ms | 9% (−15) | 23%* (14*) | — | — |
| H N - 200 ms | 14% (20) | 30%* (36*) | — | — | |
After pairing, five times more A1 sites (25% vs. 5%) exhibited significant response facilitation to the second sequence element (low tone) when preceded by the first element (high tone). In contrast, no significant facilitation developed in response to the high tone when preceded by the low tone. After pairing, 58% exhibited significant response facilitation to the third sequence element (noise burst) when preceded by the first two elements. These increases were statistically significant across individuals in each group. The mean facilitation indices for the paired sequence for all experimental sites were significantly greater than the mean facilitation index for control sites. Asterisks mark sequences with significantly more facilitation (P < 0.05). Fewer sites showed response facilitation to sequences in which the order or timing was altered. No significant facilitation developed in response to repeated tones or tones in reverse order. Sequences with statistically significant differences between experimental and control groups using both measures are boldface.
Although the context-dependent facilitation that developed generalized to some sequence variations, it was limited to spectrotemporal transitions present in the sequence paired with BF stimulation. For example, there was no increase in the amount of facilitation for high when preceded by low (Table 1, Tones reversed), by high (Table 1, Repeat high), or by noise and low (Table 1, Sequence reversed). The facilitated responses to low when preceded by noise are likely because of the presence of high-frequency power in the noise burst and does not indicate that these neurons are nonspecific for sequence order (Table 1, Sequence reversed). The facilitated response to noise preceded by tones in the reversed order (Table 1, Tones reversed) may be the result of the prolonged time course of context-dependent facilitation (as in Fig. 1 B and C). These results demonstrate that A1 neurons in adult animals can develop new combination sensitivities that are specific to sequence order, but tolerant of some variation.
The facilitation index provides another method of comparing the degree of combination sensitivity that does not require a strict definition of which sites exhibit context-dependent facilitation (see Methods). Sites that exhibit no context-dependent facilitation have a facilitation index of zero, whereas sites with two-fold facilitation have a facilitation index of 100, and sites with a 50% decrease have a facilitation index of −100. This method of analysis confirms that the degree of facilitation in response to the paired sequence was significantly greater than in naïve controls (see parentheses in Table 1). Significant changes were also observed in response to three basic variations of the paired sequence, including noise preceded by either of the tones alone or by both tones in reverse order. These results demonstrate that cortical neurons can develop significant response facilitation that is specific to the spectrotemporal transitions in complex stimuli that co-occur with BF activation.
Increased Response Synchronization.
Although earlier studies had demonstrated that BF stimulation alters spectral and temporal response properties of A1 neurons in an experience-dependent manner, the plasticity generated by BF-sequence pairing was distinct from earlier results using simple stimuli. For example, pairing BF stimulation with two different tone frequencies presented in isolation (i.e., not part of a sequence) led to A1 map expansion and a sharpening of cortical selectivity for frequency (23). In contrast, pairing the high–low–noise sequence with the same BF activation did not significantly alter either cortical topography or frequency bandwidth (data not shown). In addition, BF-sequence pairing led to shorter response latencies and increased population discharge synchrony that was not observed in any of the four earlier studies with simple tones or broadband stimuli (23–26). The average time to peak (see Methods) was decreased by 3 ms after BF-sequence pairing (15.2 vs. 18.2 ms, P < 0.00001, Fig. 2A), such that the percent of neurons with their peak within 12 ms of tone onset increased four-fold (7% vs. 30%). The average minimum response latency was also substantially shortened (11.9 vs. 13.5 ms, P < 0.0005), reflecting a 30% decrease in cortical processing time (3.9 vs. 5.5 ms) if the thalamic volley arrives ∼8 ms after tone onset. Finally, the spontaneous activity rate was decreased (5.5 vs. 9.6 spikes/s, P < 0.00001). All three of these effects contributed to a considerable temporal sharpening of the mean response to the sequence. Neurons in every region of the frequency map sharpened their response synchronization by shifting responses earlier and decreasing latency jitter (Fig. 2B). Extended practice on a vibrotactile discrimination task led to similarly shortened latencies and sharpened response coherence in monkey somatosensory cortex (31). Increased response synchronization may improve the accuracy of distributed cortical representations (32–34).
Figure 2.
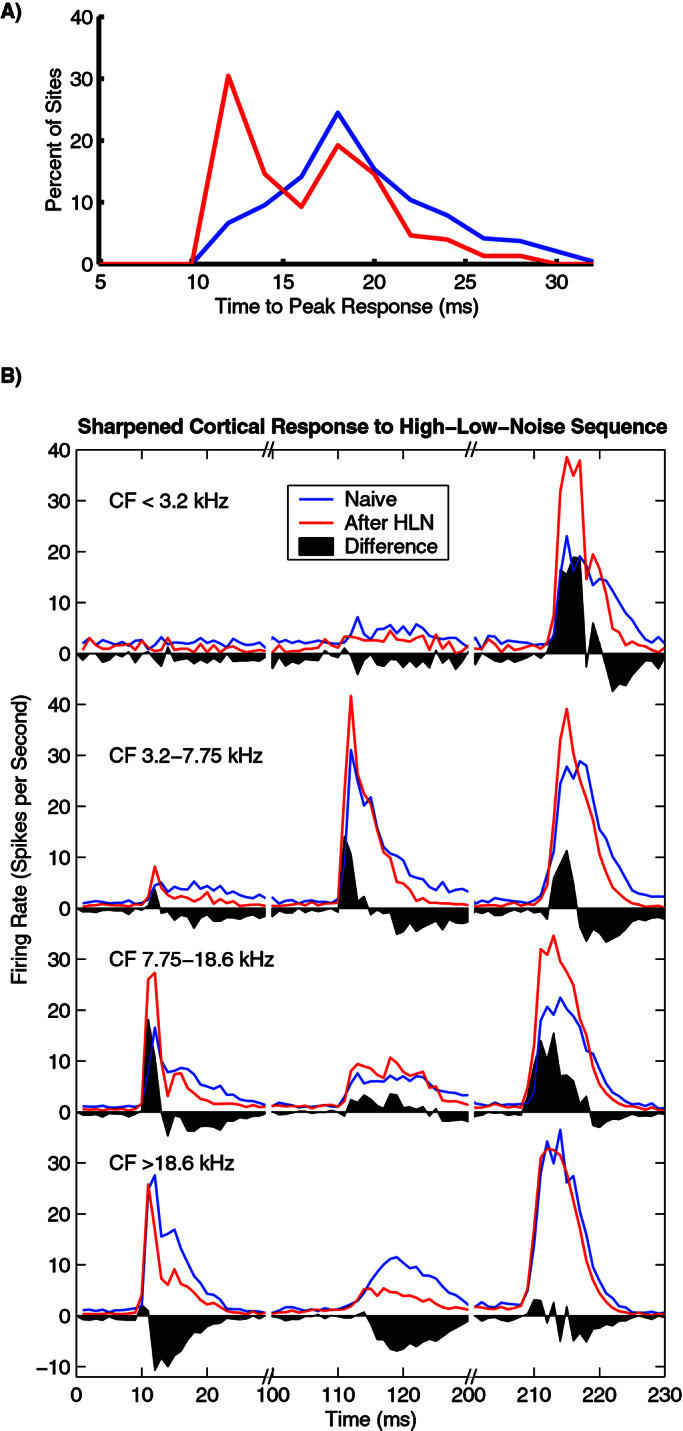
Repeatedly pairing BF activation with a high–low–noise sequence shortened response latency and sharpened the population discharge. (A) The time to peak in response to tones covering the entire receptive field was decreased by 3 ms (P < 0.00001). (B) Population PSTHs from four regions of the A1 frequency map in response to the high–low–noise sequence. The black shading illustrates the redistribution of spikes in conditioned animals. In addition to shortening the time to peak, BF pairing reduced the temporal smearing caused by long latency responses. Most of the silent periods between the sequence elements are not shown to provide a clearer view of the evoked responses.
Discussion
The clear differences between the plasticity generated by simple and complex stimuli paired with BF stimulation suggest that simple stimuli lead to changes in cortical topography and receptive field size, whereas spectrotemporally complex stimuli stimulate the development of context-dependent facilitation and increased discharge synchronization without affecting A1 coarse coding of frequency. Additional studies will be needed to determine how response facilitation and synchronization in A1 contribute to the greater selectivity (sparse coding) seen in higher cortical regions (11, 35–39).
Acknowledgments
We thank Alison J. Doupe, Michelle Solis, Dean Buonomano, Srikantan Nagarajan, Larry Cauller, Pritesh Pandya, Raluca Moucha, Jessica Vazquez, and Navzer Engineer for insightful comments on the manuscript. This work was supported by National Institutes of Health Grants DC-04354 and NS-10414.
Abbreviations
- BF
basal forebrain
- A1
primary auditory cortex
- SOA
stimulus onset asynchronies
References
- 1.De Ribaupierre F, Goldstein M H, Jr, Yeni-Komshian G. Brain Res. 1972;48:205–225. doi: 10.1016/0006-8993(72)90179-5. [DOI] [PubMed] [Google Scholar]
- 2.Brosch M, Schreiner C E. J Neurophysiol. 1997;77:923–943. doi: 10.1152/jn.1997.77.2.923. [DOI] [PubMed] [Google Scholar]
- 3.Brosch M, Schulz A, Scheich H. J Neurophysiol. 1999;82:1542–1559. doi: 10.1152/jn.1999.82.3.1542. [DOI] [PubMed] [Google Scholar]
- 4.Kilgard M P, Merzenich M M. Hear Res. 1999;134:16–28. doi: 10.1016/s0378-5955(99)00061-1. [DOI] [PMC free article] [PubMed] [Google Scholar]
- 5.Brosch M, Schreiner C E. Cereb Cortex. 2000;10:1155–1167. doi: 10.1093/cercor/10.12.1155. [DOI] [PubMed] [Google Scholar]
- 6.Buonomano D V, Hickmott P W, Merzenich M M. Proc Natl Acad Sci USA. 1997;94:10403–10408. doi: 10.1073/pnas.94.19.10403. [DOI] [PMC free article] [PubMed] [Google Scholar]
- 7.Buonomano D V, Merzenich M M. Science. 1995;267:1028–1030. doi: 10.1126/science.7863330. [DOI] [PubMed] [Google Scholar]
- 8.Sovijarvi A R. Acta Physiol Scand. 1975;93:318–335. doi: 10.1111/j.1748-1716.1975.tb05821.x. [DOI] [PubMed] [Google Scholar]
- 9.Weinberger N M, McKenna T M. Music Percept. 1988;5:355–390. [Google Scholar]
- 10.Suga N. J Exp Biol. 1989;146:277–286. doi: 10.1242/jeb.146.1.277. [DOI] [PubMed] [Google Scholar]
- 11.Esser K H, Condon C J, Suga N, Kanwal J S. Proc Natl Acad Sci USA. 1997;94:14019–14024. doi: 10.1073/pnas.94.25.14019. [DOI] [PMC free article] [PubMed] [Google Scholar]
- 12.Margoliash D. J Neurosci. 1983;3:1039–1057. doi: 10.1523/JNEUROSCI.03-05-01039.1983. [DOI] [PMC free article] [PubMed] [Google Scholar]
- 13.Margoliash D, Fortune E S. J Neurosci. 1992;12:4309–4326. doi: 10.1523/JNEUROSCI.12-11-04309.1992. [DOI] [PMC free article] [PubMed] [Google Scholar]
- 14.Wang X, Merzenich M M, Beitel R, Schreiner C E. J Neurophysiol. 1995;74:2685–2706. doi: 10.1152/jn.1995.74.6.2685. [DOI] [PubMed] [Google Scholar]
- 15.Creutzfeldt O, Ojemann G, Lettich E. Exp Brain Res. 1989;77:451–475. doi: 10.1007/BF00249600. [DOI] [PubMed] [Google Scholar]
- 16.Katz L C, Shatz C J. Science. 1996;274:1133–1138. doi: 10.1126/science.274.5290.1133. [DOI] [PubMed] [Google Scholar]
- 17.Weinberger N M, Bakin J S. Audiol Neurootol. 1998;3:145–67. doi: 10.1159/000013787. [DOI] [PubMed] [Google Scholar]
- 18.Doupe A J, Kuhl P K. Annu Rev Neurosci. 1999;22:567–631. doi: 10.1146/annurev.neuro.22.1.567. [DOI] [PubMed] [Google Scholar]
- 19.Recanzone G H. In: The New Cognitive Neurosciences. Gazzaniga M S, editor. Cambridge, MA: MIT Press; 2000. pp. 237–247. [Google Scholar]
- 20.Buonomano D V, Merzenich M M. Annu Rev Neurosci. 1998;21:149–186. doi: 10.1146/annurev.neuro.21.1.149. [DOI] [PubMed] [Google Scholar]
- 21.Edeline J M. Prog Neurobiol. 1999;57:165–224. doi: 10.1016/s0301-0082(98)00042-2. [DOI] [PubMed] [Google Scholar]
- 22.Bakin J S, Weinberger N M. Proc Natl Acad Sci USA. 1996;93:11219–11224. doi: 10.1073/pnas.93.20.11219. [DOI] [PMC free article] [PubMed] [Google Scholar]
- 23.Kilgard M P, Merzenich M M. Science. 1998;279:1714–1718. doi: 10.1126/science.279.5357.1714. [DOI] [PubMed] [Google Scholar]
- 24.Kilgard M P, Merzenich M M. Nat Neurosci. 1998;1:727–731. doi: 10.1038/3729. [DOI] [PMC free article] [PubMed] [Google Scholar]
- 25.Kilgard M P, Pandya P K, Vazquez J, Gehi A, Schreiner C E, Merzenich M M. J Neurophysiol. 2001;86:326–338. doi: 10.1152/jn.2001.86.1.326. [DOI] [PubMed] [Google Scholar]
- 26.Kilgard M P, Pandya P K, Vazquez J L, Rathbun D, Engineer N D, Moucha R. Audiol Neurootol. 2001;6:196–202. doi: 10.1159/000046832. [DOI] [PubMed] [Google Scholar]
- 27.Crist R E, Li W, Gilbert C D. Nat Neurosci. 2001;4:519–525. doi: 10.1038/87470. [DOI] [PubMed] [Google Scholar]
- 28.Wright B A, Buonomano D V, Mahncke H W, Merzenich M M. J Neurosci. 1997;17:3956–3963. doi: 10.1523/JNEUROSCI.17-10-03956.1997. [DOI] [PMC free article] [PubMed] [Google Scholar]
- 29.Tremblay K, Kraus N, Carrell T D, McGee T. J Acoust Soc Am. 1997;102:3762–3773. doi: 10.1121/1.420139. [DOI] [PubMed] [Google Scholar]
- 30.Buonomano D V. J Neurosci. 2000;20:1129–1141. doi: 10.1523/JNEUROSCI.20-03-01129.2000. [DOI] [PMC free article] [PubMed] [Google Scholar]
- 31.Recanzone G H, Merzenich M M, Schreiner C E. J Neurophysiol. 1992;67:1071–1091. doi: 10.1152/jn.1992.67.5.1071. [DOI] [PubMed] [Google Scholar]
- 32.Abbott L F, Dayan P. Neural Comput. 1999;11:91–101. doi: 10.1162/089976699300016827. [DOI] [PubMed] [Google Scholar]
- 33.Jenison R L. J Acoust Soc Am. 2000;107:414–421. doi: 10.1121/1.428313. [DOI] [PubMed] [Google Scholar]
- 34.Song S, Miller K D, Abbott L F. Nat Neurosci. 2000;3:919–926. doi: 10.1038/78829. [DOI] [PubMed] [Google Scholar]
- 35.Young M P, Yamane S. Science. 1992;256:1327–1331. doi: 10.1126/science.1598577. [DOI] [PubMed] [Google Scholar]
- 36.Rauschecker J P, Tian B, Hauser M. Science. 1995;268:111–114. doi: 10.1126/science.7701330. [DOI] [PubMed] [Google Scholar]
- 37.Barlow H. In: The Cognitive Neurosciences. Gazzaniga M S, editor. Cambridge, MA: MIT Press; 1995. pp. 415–434. [Google Scholar]
- 38.Singer W. In: The New Cognitive Neurosciences. Gazzaniga M S, editor. Cambridge, MA: MIT Press; 2000. pp. 325–338. [Google Scholar]
- 39.Hopfield J J, Brody C D. Proc Natl Acad Sci USA. 2001;98:1282–1287. doi: 10.1073/pnas.031567098. [DOI] [PMC free article] [PubMed] [Google Scholar]