Abstract
Background
Numerous studies have established a strong link between the overexpression of spindle apparatus coiled-coil protein 1 (SPDL1) and cancer progression. However, the role of SPDL1 in hepatocellular carcinoma (HCC) remains unconfirmed.
Methods
The level of SPDL1 in HCC and its potential associations with prognosis and clinicopathological features were analyzed using TCGA and XENA databases. Bioinformatics and in vitro approaches were employed to investigate the biological functions, signaling pathways, and protein networks involving SPDL1. Additionally, correlation analyses were performed to explore the relationship between SPDL1 and the immune microenvironment.
Results
SPDL1 was overexpressed in HCC. Its overexpression correlated negatively with T stage, pathological stage, tumor status, age, body weight, differentiation, alpha-fetoprotein levels, vascular invasion, diagnosis, and poor prognosis in patients with HCC, positioning it as a risk factor for adverse outcomes. High-risk scores related to SPDL1 expression were significantly linked to poor prognosis in patients with HCC. Suppression of SPDL1 expression inhibited HCC cell proliferation, invasion, and migration. Furthermore, SPDL1 expression showed significant correlations with Th2 cells (r = 0.628), T helper cells (r = 0.296), Th17 cells (r = -0.422), neutrophils (r = -0.408), dendritic cells (r = -0.358), cytotoxic cells (r = -0.310), plasmacytoid dendritic cells (r = -0.275), and other immune cell populations in HCC.
Conclusion
Overexpression of SPDL1 is associated with poor prognosis and the immune microenvironment in HCC. Inhibition of SPDL1 expression can suppress tumor growth and metastasis, suggesting that SPDL1 may serve as a potential therapeutic target for HCC treatment.
Supplementary Information
The online version contains supplementary material available at 10.1007/s12672-025-03089-8.
Keywords: SPDL1, Hepatocellular carcinoma, Biomarkers, Nomogram, Bioinformatics
Background
Despite advances in treatment, the prognosis for some patients with hepatocellular carcinoma (HCC) remains poor. Significant correlations have been identified between the onset and progression of HCC and the aberrant expression of specific genes [1–3]. For instance, Niu et al. reported that solute carrier family 16 member 4 (SLC16A4) expression was markedly elevated in HCC cells and tissues, correlating with poor prognosis in patients with HCC. Suppressing SLC16A4 expression led to the downregulation of TRAPPC5, which in turn inhibited HCC cell proliferation, migration, invasion, and epithelial-mesenchymal transition [1]. Han et al. also observed that desmoprotein-2 (DSG2) expression was significantly higher in HCC tissues compared to adjacent non-cancerous tissues. DSG2 overexpression was positively correlated with tumor size, stage and was identified as an independent prognostic factor for overall survival (OS). Inhibiting DSG2 expression effectively reduced HCC cell proliferation and cell cycle progression [2].
The spindle apparatus coiled-coil protein 1 (SPDL1) gene plays a pivotal role in mitotic spindle formation and chromosome segregation. Recent studies have increasingly highlighted SPDL1’s involvement in tumorigenesis, particularly in digestive system cancers, with evidence suggesting its function as an oncogene in cancer progression [4–9]. For example, Klimaszewska-Wińniewska et al. demonstrated that SPDL1 was highly expressed in cancer tissues and served as an independent predictor of poor prognosis in patients with colorectal cancer [4]. Liu et al. reported that SPDL1 levels were significantly elevated in esophageal cancer tissues, where increased SPDL1 expression correlated with factors such as age, tumor grade, history of alcohol consumption, tumor stage, lymph node metastasis, TP53 mutations, and poor prognosis. Inhibition of SPDL1 expression was shown to suppress the proliferation, migration, and invasion of esophageal cancer cells [7]. However, the roles and mechanisms of SPDL1 in HCC have yet to be fully elucidated. This study employs expression and survival analyses, Cox regression, and nomograms to examine SPDL1 levels in HCC and their potential association with patient prognosis. Additionally, bioinformatics and in vitro experiments are utilized to explore the roles and mechanisms of SPDL1 in HCC progression, as well as its relationship with the immune microenvironment. The findings offer a novel therapeutic target for HCC treatment.
Materials and methods
The levels of SPDL1 in HCC
In September 2023, The download of HCC tissue sequencing data from the official TCGA and XENA databases in the Xiantao Academic Website, comprising 50 normal liver tissues and 374 HCC tissues in the TCGA database, as well as 160 normal liver tissues and 371 HCC tissues in the XENA database, does not require approval or consent from the Ethics Committee. SPDL1 expression data from both cancer and normal tissues of patients with HCC were retrieved using Perl scripting, followed by expression analysis to assess SPDL1 levels in HCC.
Association between SPDL1 expression and clinicopathological features and poor prognosis in HCC
Clinicopathological and prognostic data for patients with HCC were obtained from the TCGA database, and SPDL1 gene expression data were integrated with these clinical characteristics using Perl. After excluding patients with incomplete data, the expression levels of SPDL1 in the remaining groups were analyzed, along with the relationship between SPDL1 expression and prognosis based on clinicopathological factors. Additionally, the median SPDL1 expression was used to classify patients into high- and low-expression groups, and the prognostic differences between these groups were evaluated.
Receiver operating characteristic (ROC) analysis
ROC analysis, a common method for assessing the diagnostic potential of genes in cancer, was conducted to evaluate the diagnostic value of SPDL1. The area under the curve (AUC) closer to 1 indicates a higher diagnostic accuracy [10]. ROC analysis was performed on normal liver and HCC tissues from both the TCGA and XENA databases to determine the diagnostic significance of SPDL1.
Prognostic risk factors in patients with HCC
After excluding patients with incomplete data, univariate Cox regression analysis was used to explore the relationship between clinicopathological features, SPDL1 expression, and prognostic indicators in patients with HCC. Variables with a P-value < 0.05 were considered significant and were included in a multivariate Cox regression analysis, which helped eliminate irrelevant factors. Prognostic factors were defined based on P < 0.05, and a nomogram was constructed to predict patient outcomes. Survival analysis was conducted to assess whether significant differences in patient outcomes existed between high- and low-risk groups, as categorized by the median risk score.
SPDL1 co-expressed genes
The relationship between genes was assessed using correlation analysis and its coefficient, where values closer to 1 or −1 indicate a stronger correlation between two genes. Spearman correlation analysis was employed to identify SPDL1 co-expressed genes. A correlation coefficient with an absolute value greater than 0.7 was considered significant and defined as a strong co-expressed SPDL1 gene. Some of these co-expressed genes were visualized using heatmaps and scatter plots.
Biological roles of SPDL1 co-expressed genes
Gene Ontology (GO) annotation, a widely utilized tool in bioinformatics, was employed to investigate the biological processes (BP), cellular components (CC), and molecular functions (MF) associated with SPDL1 co-expressed genes [10]. GO annotation analysis identified the biological functions significantly enriched in SPDL1 co-expressed genes, with a corrected P-value < 0.05 serving as the threshold for significance.
Mechanisms and interaction network of SPDL1 co-expressed genes
Kyoto Encyclopedia of Genes and Genomes (KEGG) pathway analysis is another widely utilized bioinformatics tool for understanding the signaling pathways associated with multiple genes [10]. In the present study, KEGG pathway analysis was applied to identify the signaling mechanisms involved in SPDL1 co-expressed genes, with a corrected P-value < 0.05 used as the threshold for significant enrichment of pathways. Additionally, SPDL1 co-expressed genes were uploaded into the STRING database to construct an interactive network, enabling visualization of the interactions among SPDL1 co-expressed genes.
Relationship between SPDL1 expression and HCC immune microenvironment
The relative abundance of immune cell types in HCC tissues was assessed through single-sample Gene Set Enrichment Analysis (ssGSEA), utilizing data from patients with HCC in the TCGA database. SPDL1 expression data and immune cell expression data were integrated using Perl scripting to analyze the relationship between SPDL1 expression and the immune microenvironment of HCC. Correlation analysis was conducted, with a P-value < 0.05 considered indicative of significant enrichment.
HCC cell culture and cell transfection
HepG2 and HUH7 cells were cultured in Dulbecco’s Modified Eagle Medium (DMEM) supplemented with 10% fetal bovine serum (FBS) and 1% penicillin-streptomycin. The cells were maintained in an incubator at 37 °C with 5% CO2. Upon reaching 70–80% confluence, cells were trypsinized with Trypsin-EDTA for passaging. For transfection, a transfection reagent mixture was prepared according to the manufacturer’s instructions, with the appropriate concentration of siRNA solution. The siRNA was mixed with the transfection reagent in specified proportions and incubated at room temperature for 20 min to form the siRNA-transfection complex. The complex was then added to the cell culture and gently mixed. After transfection, the cells were incubated for 24 h at 37 °C before SPDL1 expression was assessed via RT-PCR or Western blotting.
RT-PCR and western blotting to detect whether the cell models of inhibiting SPDL1 gene expression
Total RNA was extracted from the transfected cells using TRIzol reagent after confirming that the feeder cells were in good condition and that transfection was successful. The RNA was quantified and reverse-transcribed into complementary DNA (cDNA). Reverse transcription PCR (RT-PCR) was performed using specific primers to detect SPDL1 mRNA expression. The primer sequence for SPDL1 was CGTGTGCAGGAAAGCATGTC. After cell lysis with protein extraction buffer, total proteins were quantified, denatured, and subjected to SDS-PAGE electrophoresis. Protein transfer and subsequent western blotting using SPDL1 antibodies were performed to evaluate the inhibitory effect of siRNA on SPDL1 expression in HCC cells.
Cell proliferation ability
Transfected HCC cells were seeded into 96-well plates at an appropriate density, with three replicate wells for each experimental group. The cells were incubated in a 37 °C incubator with 5% CO2 to promote adhesion and adaptation. After 24 h, 10 µL of CCK-8 reagent was added to each well and gently mixed. The plate was then incubated for one hour, and the optical density (OD) at 450 nm was measured using a microplate reader. Cell proliferation was monitored at four time points: 0, 24, 48, and 72 h. OD values were compared to the control group to evaluate cell proliferation. Additionally, adherent cells were fixed with 4% paraformaldehyde for 20 min at room temperature, followed by three washes with PBS. EdU staining reagent was added to the cells and incubated at room temperature for 30 min. The cells were then stained with DAPI for 10 min, followed by PBS washes. Cell proliferation was assessed by counting EdU-positive cells under a fluorescence microscope.
Wound healing
For migration assays, transfected cells were cultured in 6-well plates until they reached approximately 90% confluence. A sterile cell scraper was used to create a straight-line scratch in the cell monolayer. The scratched area was gently washed with a culture medium to remove detached cells and debris. The cells were then returned to the incubator at 37 °C with 5% CO2 for further culture. Photographs of the scratch area were taken at 0, 24, and 48 h post-scratching to document the healing process. Migration and healing abilities of cells in both control and treatment groups were compared.
Cell invasion ability using transwell assay
For invasion assays, Matrigel was thawed and diluted to a 1:4 ratio under sterile conditions. The diluted Matrigel was added to the upper chamber of a Transwell insert to evenly cover the membrane surface. The insert was placed in a 37 °C incubator for approximately 60 min to allow the Matrigel to solidify. HCC cells were adjusted to the appropriate density and inoculated into the upper chamber, while 600 µL of serum-containing medium was added to the lower chamber. The Transwell assembly was incubated for 24 h at 37 °C with 5% CO2. After incubation, the upper chamber was gently washed with PBS to remove non-invasive cells. A cotton swab was used to wipe the upper chamber, leaving only the cells that had migrated through the membrane. The membrane was stained with a cell staining agent for 30 min, after which the cells were observed, counted, and analyzed.
Statistical analysis
Univariate and multivariate Cox regression analyses, survival analysis, and nomogram construction were performed to identify prognostic factors in patients with HCC. GO and KEGG pathway analyses were conducted to investigate the functions and mechanisms of SPDL1 co-expressed genes. A significance threshold of P < 0.05 was applied throughout the analyses.
Results
The expression of SPDL1 was significantly enhanced in HCC
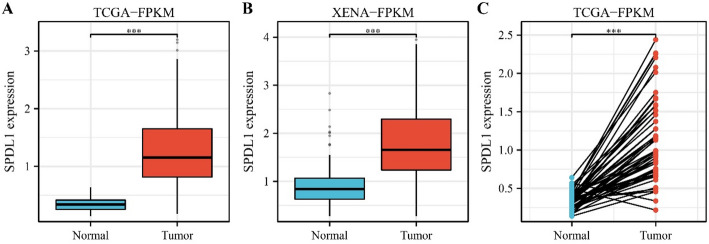
Data from TCGA and XENA databases revealed that SPDL1 expression levels in cancer tissues were markedly higher than those in normal tissues in unpaired patients with HCC (Fig. 1A and B). Moreover, a similar trend was observed in paired samples of patients with HCC (Fig. 1C).
Fig. 1.
SPDL1 expression levels in HCC tissues from paired and unpaired patients in the TCGA and XENA databases. A TCGA; B XENA; C TCGA
SPDL1 overexpression was associated with T stage, pathological stage, tumor status, age, weight, differentiation, alpha-fetoprotein, and vascular invasion ability of patients with HCC
SPDL1 expression was significantly elevated in cancer tissues of patients with stage T3-4 HCC compared to those with stage T1 and T2 HCC (Fig. 2A). Additionally, SPDL1 levels were significantly higher in patients with advanced (III-IV) HCC compared to early-stage (I-II) patients (Fig. 2B). Further analysis showed a significant positive correlation between SPDL1 expression and tumor status, age ≤ 60, body weight > 70 kg, high differentiation (G3-4), alpha-fetoprotein levels, vascular invasion, and patient survival status (Fig. 2C-L).
Fig. 2.
SPDL1 expression levels in HCC tissues of patients from the TCGA database. A T1-2 vs. T3-4; B Stage I-II vs. Stage III-IV; C Tumor-free vs. With tumor; D Age ≤ 60 vs. >60; E Weight ≤ 70 vs. >70; F G1-2 vs. G3-4; G AFP ≤ 400 vs. >400; H Prothrombin time ≤ 4 vs. >4; I Vascular invasion: No vs. Yes; J OS event; K DSS event; L PFI event
SPDL1 overexpression was negatively correlated with diagnosis and poor prognosis in HCC
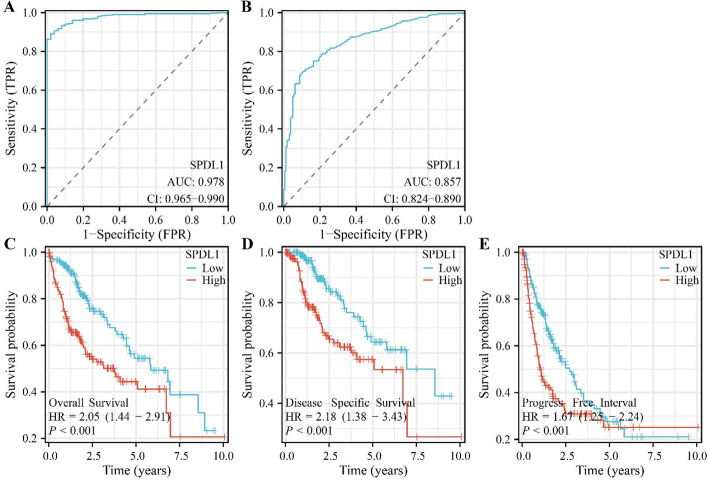
ROC analysis, based on TCGA and XENA database data, revealed an AUC of 0.978 and 0.857 for SPDL1 in HCC tissues and normal tissues (Fig. 3A and B). Survival analysis demonstrated that SPDL1 overexpression was associated with poorer OS (HR = 2.05 [1.44–2.91]), disease-free survival (HR = 2.18 [1.38–3.43]), and cancer progression (HR = 1.67 [1.25–2.24]) (Fig. 3C-F).
Fig. 3.
SPDL1’s significant association with the diagnosis and prognosis of patients with HCC. A Diagnostic significance of SPDL1 in TCGA and XENA databases; C–E Prognostic significance of SPDL1 from TCGA databases based on SPDL1 expression levels
SPDL1 was a risk factor for poor prognosis and predicts the prognosis of patients with HCC
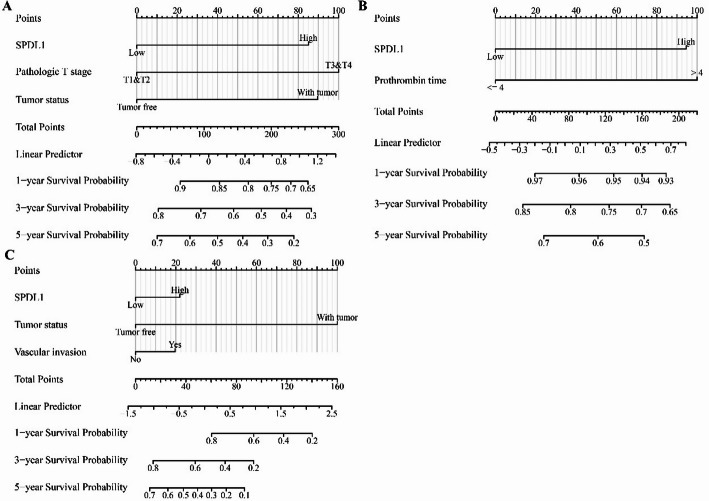
Univariate and multivariate Cox regression analyses identified SPDL1 overexpression, tumor status, and T stage as risk factors for shorter OS in patients with HCC (Table 1). Additionally, prothrombin time and SPDL1 overexpression were identified as risk factors for disease-free survival (Table 2), while SPDL1 overexpression, tumor status, and prothrombin time were associated with disease progression (Table 3). Based on these multivariate Cox regression results, a prognosis nomogram for SPDL1 was constructed (Fig. 4). Survival analysis of the risk model, built on prognostic risk factors, indicated that higher risk scores were significantly associated with shorter survival times in patients with HCC (Fig. 5A-C).
Table 1.
Prognostic risk factors for OS in HCC
| Characteristics | Total (N) | HR (95% CI) Univariate analysis | P value | HR (95% CI) Multivariate analysis | P value |
|---|---|---|---|---|---|
| T stage | 370 | ||||
| T1-2 | 277 | Reference | Reference | ||
| T3-4 | 93 | 2.598 (1.826–3.697) | < 0.001 | 2.098 (1.438–3.063) | < 0.001 |
| N stage | 258 | ||||
| N0 | 254 | Reference | |||
| N1 | 4 | 2.029 (0.497–8.281) | 0.324 | ||
| M stage | 272 | ||||
| M0 | 268 | Reference | |||
| M1 | 4 | 4.077 (1.281–12.973) | 0.017 | ||
| Tumor status | 354 | ||||
| Tumor free | 202 | Reference | Reference | ||
| With tumor | 152 | 2.317 (1.590–3.376) | < 0.001 | 1.942 (1.318–2.862) | < 0.001 |
| Gender | 373 | ||||
| Female | 121 | Reference | |||
| Male | 252 | 0.793 (0.557–1.130) | 0.200 | ||
| Age | 373 | ||||
| <= 60 | 177 | Reference | |||
| > 60 | 196 | 1.205 (0.850–1.708) | 0.295 | ||
| Weight | 345 | ||||
| <= 70 | 184 | Reference | |||
| > 70 | 161 | 0.941 (0.657–1.346) | 0.738 | ||
| Height (cm) | 340 | ||||
| < 170 | 201 | Reference | |||
| >= 170 | 139 | 1.232 (0.849–1.788) | 0.272 | ||
| BMI | 336 | ||||
| <= 25 | 177 | Reference | |||
| > 25 | 159 | 0.798 (0.550–1.158) | 0.235 | ||
| AFP (ng/ml) | 279 | ||||
| <= 400 | 215 | Reference | |||
| > 400 | 64 | 1.075 (0.658–1.759) | 0.772 | ||
| Albumin (g/dl) | 299 | ||||
| < 3.5 | 69 | Reference | |||
| >= 3.5 | 230 | 0.897 (0.549–1.464) | 0.662 | ||
| Prothrombin time | 296 | ||||
| <= 4 | 207 | Reference | |||
| > 4 | 89 | 1.335 (0.881–2.023) | 0.174 | ||
| Vascular invasion | 317 | ||||
| No | 208 | Reference | |||
| Yes | 109 | 1.344 (0.887–2.035) | 0.163 | ||
| SPDL1 | 373 | ||||
| Low | 187 | Reference | Reference | ||
| High | 186 | 2.046 (1.437–2.914) | < 0.001 | 1.879 (1.297–2.720) | < 0.001 |
Table 2.
Prognostic risk factors for DSS in HCC
| Characteristics | Total (N) | HR (95% CI) Univariate analysis | P value | HR (95% CI) Multivariate analysis | P value |
|---|---|---|---|---|---|
| T stage | 362 | ||||
| T1-2 | 272 | Reference | Reference | ||
| T3-4 | 90 | 3.639 (2.328–5.688) | < 0.001 | 1.614 (0.924–2.821) | 0.092 |
| N stage | 253 | ||||
| N0 | 249 | Reference | |||
| N1 | 4 | 3.612 (0.870-14.991) | 0.077 | ||
| M stage | 268 | ||||
| M0 | 265 | Reference | |||
| M1 | 3 | 5.166 (1.246–21.430) | 0.024 | Reference | |
| Tumor status | 354 | 772381501.1370 (0.000-Inf) | 0.995 | ||
| Tumor free | 202 | Reference | |||
| With tumor | 152 | 775790759.3892 (0.000-Inf) | 0.994 | ||
| Gender | 365 | ||||
| Female | 118 | Reference | |||
| Male | 247 | 0.813 (0.516–1.281) | 0.373 | ||
| Age | 365 | ||||
| <= 60 | 174 | Reference | |||
| > 60 | 191 | 0.846 (0.543–1.317) | 0.458 | ||
| Weight | 338 | ||||
| <= 70 | 182 | Reference | |||
| > 70 | 156 | 1.000 (0.630–1.589) | 0.999 | ||
| Height (cm) | 333 | ||||
| < 170 | 197 | Reference | |||
| >= 170 | 136 | 1.229 (0.760–1.988) | 0.400 | ||
| BMI | 329 | ||||
| <= 25 | 175 | Reference | |||
| > 25 | 154 | 0.826 (0.512–1.330) | 0.431 | ||
| AFP (ng/ml) | 275 | ||||
| <= 400 | 214 | Reference | |||
| > 400 | 61 | 0.867 (0.450–1.668) | 0.668 | ||
| Albumin (g/dl) | 294 | ||||
| < 3.5 | 67 | Reference | |||
| >= 3.5 | 227 | 1.148 (0.586–2.250) | 0.687 | ||
| Prothrombin time | 290 | ||||
| <= 4 | 203 | Reference | Reference | ||
| > 4 | 87 | 1.778 (1.054–2.999) | 0.031 | 1.728 (1.017–2.935) | 0.043 |
| Vascular invasion | 309 | ||||
| No | 204 | Reference | |||
| Yes | 105 | 1.277 (0.707–2.306) | 0.418 | ||
| SPDL1 | 365 | ||||
| Low | 183 | Reference | Reference | ||
| High | 182 | 2.179 (1.383–3.434) | < 0.001 | 1.950 (1.134–3.353) | 0.016 |
Table 3.
Prognostic risk factors for PFI in HCC
| Characteristics | Total (N) | HR (95% CI) Univariate analysis | P value | HR (95% CI) Multivariate analysis | P value |
|---|---|---|---|---|---|
| T stage | 370 | ||||
| T1-2 | 277 | Reference | Reference | ||
| T3-4 | 93 | 2.177 (1.590–2.980) | < 0.001 | 1.112 (0.739–1.674) | 0.611 |
| N stage | 258 | ||||
| N0 | 254 | Reference | |||
| N1 | 4 | 1.370 (0.338–5.552) | 0.659 | ||
| M stage | 272 | ||||
| M0 | 268 | Reference | |||
| M1 | 4 | 3.476 (1.091–11.076) | 0.035 | ||
| Tumor status | 354 | ||||
| Tumor free | 202 | Reference | Reference | ||
| With tumor | 152 | 11.342 (7.567-17.000) | < 0.001 | 11.683 (7.500-18.201) | < 0.001 |
| Gender | 373 | ||||
| Female | 121 | Reference | |||
| Male | 252 | 0.982 (0.721–1.338) | 0.909 | ||
| Age | 373 | ||||
| <= 60 | 177 | Reference | |||
| > 60 | 196 | 0.960 (0.718–1.284) | 0.783 | ||
| Weight | 345 | ||||
| <= 70 | 184 | Reference | |||
| > 70 | 161 | 1.016 (0.750–1.375) | 0.920 | ||
| Height (cm) | 340 | ||||
| < 170 | 201 | Reference | |||
| >= 170 | 139 | 1.252 (0.919–1.706) | 0.154 | ||
| BMI | 336 | ||||
| <= 25 | 177 | Reference | |||
| > 25 | 159 | 0.936 (0.689–1.272) | 0.673 | ||
| AFP (ng/ml) | 279 | ||||
| <= 400 | 215 | Reference | |||
| > 400 | 64 | 1.045 (0.698–1.563) | 0.832 | ||
| Albumin (g/dl) | 299 | ||||
| < 3.5 | 69 | Reference | |||
| >= 3.5 | 230 | 0.911 (0.618–1.341) | 0.636 | ||
| Prothrombin time | 296 | ||||
| <= 4 | 207 | Reference | |||
| > 4 | 89 | 1.100 (0.785–1.541) | 0.581 | ||
| Vascular invasion | 317 | ||||
| No | 208 | Reference | Reference | ||
| Yes | 109 | 1.676 (1.196–2.348) | 0.003 | 1.570 (1.092–2.257) | 0.015 |
| SPDL1 | 373 | ||||
| Low | 187 | Reference | Reference | ||
| High | 186 | 1.671 (1.249–2.237) | < 0.001 | 1.720 (1.214–2.438) | 0.002 |
Fig. 4.
Nomogram of SPDL1 in HCC. A OS; B DSS; C PFI
Fig. 5.
High-risk scores correlated with the prognosis of patients with HCC. A OS; B DSS; C PFI
Inhibition of SPDL1 gene expression could inhibit the proliferation, invasion, and migration of HCC cells
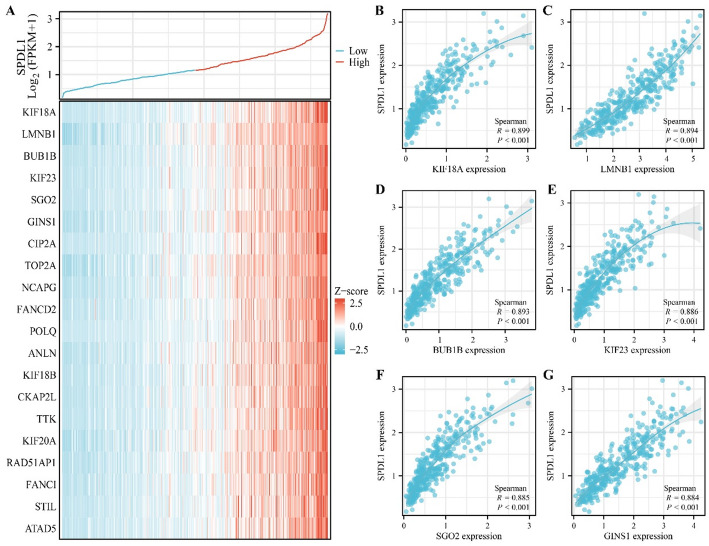
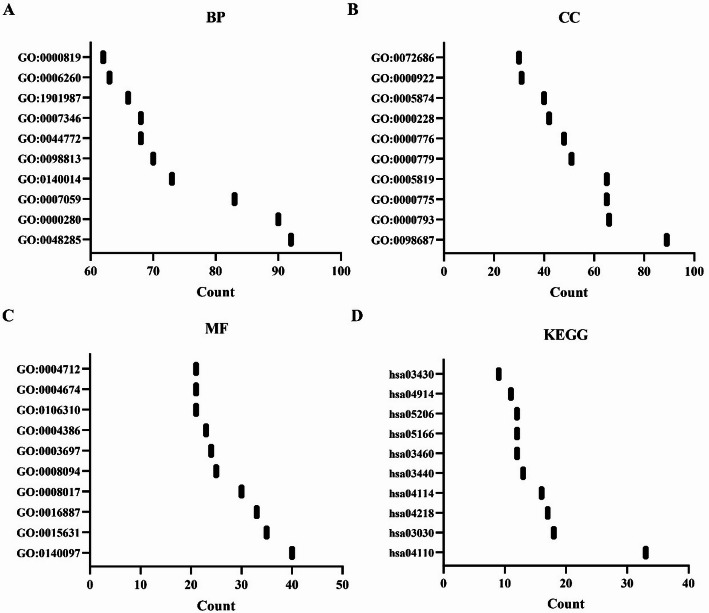
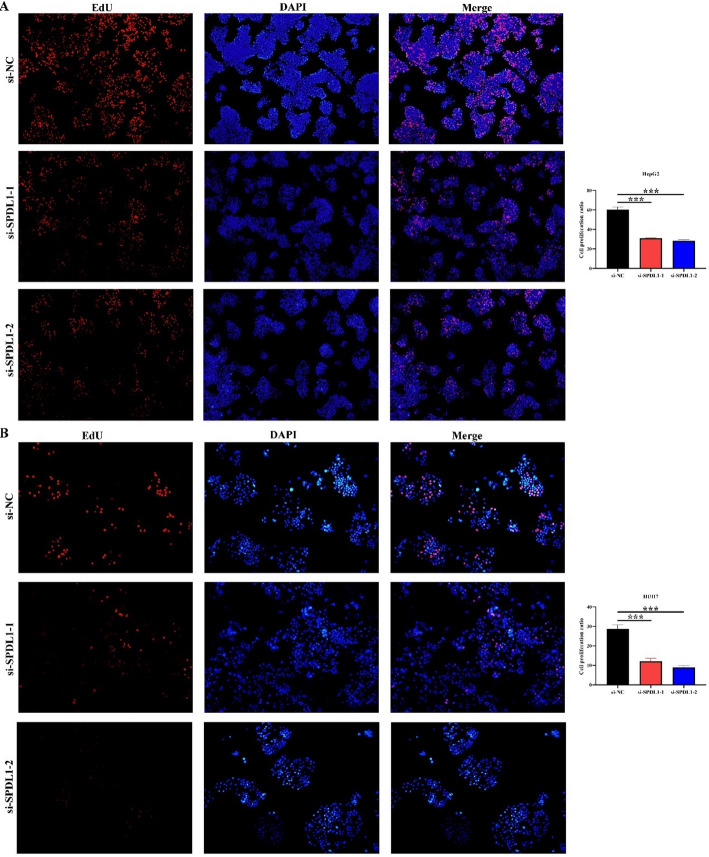
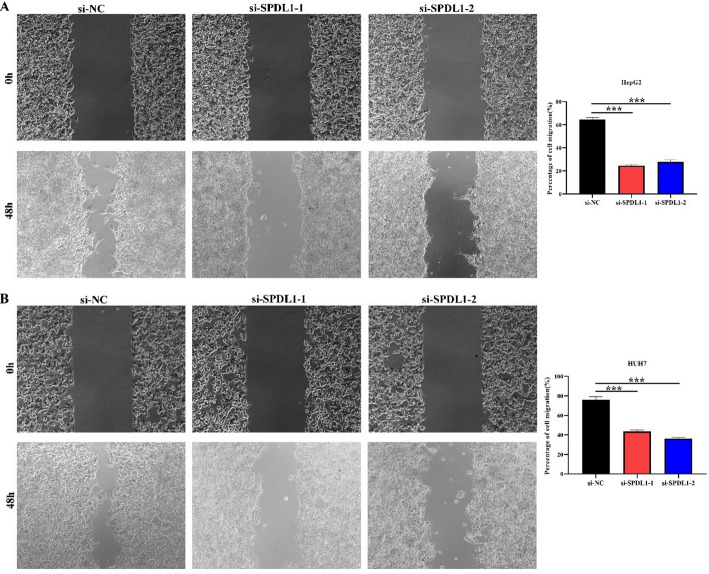
A total of 339 genes were identified as co-expressed with SPDL1 based on our screening approach. The most relevant of these genes are visualized in Fig. 6. GO annotation revealed that SPDL1 co-expressed genes were involved in mitotic nuclear division, DNA replication, cell cycle regulation, DNA recombination, cytokinesis, and cell division, among other processes (Fig. 7A-C). KEGG pathway analysis further demonstrated that these co-expressed genes were significantly enriched in pathways related to the cell cycle, DNA replication, homologous recombination, mismatch repair, oocyte meiosis, p53 signaling, spliceosome, and others (Fig. 7D). The interactions between SPDL1 co-expressed proteins were mapped using the STRING database, as shown in Fig. 8. In vitro experiments confirmed the successful construction of SPDL1 inhibition models in HCC HepG2 and HUH7 cells. CCK-8, EdU, wound healing, and Transwell assays revealed that SPDL1 silencing significantly inhibited cell proliferation (Figs. 9 and 10), invasion, and migration (Figs. 11 and 12) of both HepG2 and HUH7 cells. Statistically significant differences were observed between the experimental and control groups, confirming the effect of SPDL1 inhibition.
Fig. 6.
SPDL1 co-expressed genes in HCC
Fig. 7.
Roles and pathways of SPDL1 co-expressed genes
Fig. 8.
PPI network of SPDL1 co-expressed genes
Fig. 9.
Inhibition of SPDL1 expression suppresses HCC cell proliferation as shown by CCK-8 assay
Fig. 10.
Inhibition of SPDL1 expression suppresses HCC cell proliferation as shown by EdU assay
Fig. 11.
Inhibition of SPDL1 expression reduces HCC cell invasion as shown by Transwell assay
Fig. 12.
Inhibition of SPDL1 expression inhibits HCC cell migration as shown by wound healing assay
SPDL1 overexpression was significantly correlated with HCC immune cells
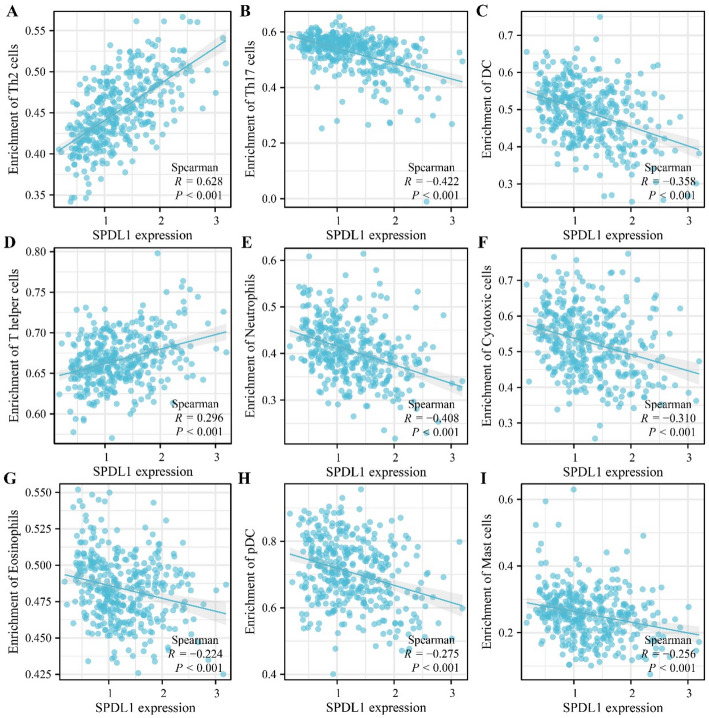
Relative immune cell levels in HCC were calculated using ssGSEA analysis. Correlation analysis indicated significant associations between SPDL1 expression and various immune cell types, including Th2 cells (r = 0.628), T helper cells (r = 0.296), Th17 cells (r = −0.422), neutrophils (r = −0.408), dendritic cells (DC, r = −0.358), cytotoxic cells (r = −0.310), plasmacytoid dendritic cells (pDC, r = −0.275), mast cells (r = −0.256), eosinophils (r = −0.224), NK cells (r = −0.219), CD8 T cells (r = −0.2), immature DCs (iDC, r = −0.199), B cells (r = −0.168), NK CD56dim cells (r = −0.153), Tγδ cells (r = −0.121), and Th1 cells (r = −0.104) (Fig. 13). Furthermore, a significant difference in immune cell distributions was observed between the high- and low- SPDL1 expression groups (Fig. 14).
Fig. 13.
SPDL1 expression correlates with immune cell populations in HCC. A Th2 cells; B Th17 cells; C DC; D T helper cells; E Neutrophils; F Cytotoxic cells; G Eosinophils; H pDC; I Mast cells
Fig. 14.
Differences in immune cell levels between high- and low-SPDL1 expression groups
Discussion
As public awareness of health increases, many individuals are undergoing routine health checkups, leading to the detection of malignant lesions. Despite this, many of these patients continue to experience poor prognoses. Numerous studies have highlighted the role of gene expression changes in the onset and progression of HCC [11–18]. For instance, Jiang et al. discovered that small nuclear ribonucleoprotein U1 subunit 70 (SNRNP70) was highly expressed in HCC, with higher expression levels correlating with poorer prognosis. Inhibition of SNRNP70 expression was shown to suppress HCC cell proliferation and migration [13]. Tong et al. reported that ubiquitin A-52 residue ribosomal protein fusion product 1 (UBA52) was overexpressed in HCC, and high levels of UBA52 expression were associated with a poor prognosis. Both in vitro and in vivo studies confirmed that silencing UBA52 expression reduced HCC cell growth and metastasis [15]. These findings suggest that targeting these genes could hinder disease progression.
In recent years, the abnormal expression of SPDL1 has been increasingly linked to various cancers, with a strong association with cancer progression [4–9]. For example, in triple-negative breast cancer, both SPDL1 mRNA and protein levels were significantly elevated compared to normal and non-cancerous tissues. SPDL1 overexpression was closely tied to poor prognosis in these patients and promoted tumor growth [9]. A similar trend was observed in our study. SPDL1 levels were markedly higher in HCC tissues compared to normal tissues. SPDL1 overexpression correlated with clinical T stage, pathological stage, tumor status, age, body weight, differentiation, alpha-fetoprotein levels, and vascular invasion, while it was negatively associated with diagnosis and prognosis. Univariate and multivariate Cox regression analyses identified SPDL1 overexpression as an independent risk factor for shorter OS, disease-free survival, and disease progression in patients with HCC. Additionally, inhibition of SPDL1 expression significantly reduced proliferation, invasion, and migration of HepG2 and HUH7 cells. These results indicate that SPDL1 overexpression is not only associated with cancer progression but also serves as a biomarker for poor prognosis in patients with HCC.
Immune cells and immune factors play crucial roles in cancer biology, making immunotherapy a rapidly advancing field of research [19–24]. For instance, combining sorafenib with immunotherapy significantly improved OS and progression-free survival in patients with advanced HCC, compared to sorafenib alone. Although the incidence of adverse events was higher in both the sorafenib and combination therapy groups, no significant difference was observed between them [20]. Enhanced CXCL9 expression was observed in blood samples from patients with HCC undergoing anti-PD-1 therapy. CXCL9 promotes neutrophil polarization in vitro, which can be inhibited by specific CXCR3 blockers [21]. Additionally, SPDL1 expression was significantly associated with immune cell populations in HCC, particularly showing a positive correlation with Th2 cells and a negative correlation with Th1/Th17 cells. Moreover, Li et al. reported elevated expression of TK1 in HCC tissues and cells, influencing cell growth by inducing G0/G1 phase arrest. TK1 also modulates Th2 cell polarization via the chemokine CCL5, thereby affecting both HCC growth and the immune microenvironment [24]. These findings further underscore SPDL1’s pivotal role in HCC progression.
Reliable database analysis with large sample sizes revealed that SPDL1 was overexpressed in HCC tissues. This overexpression was negatively correlated with T stage, pathological stage, tumor status, age, body weight, differentiation, alpha-fetoprotein levels, vascular invasion, diagnosis, immune cell profiles, and poor prognosis, positioning SPDL1 as a risk factor for poor prognosis in patients with HCC. Furthermore, inhibition of SPDL1 expression significantly suppressed HCC cell proliferation, invasion, and migration. These results suggest that SPDL1 may serve as a potential therapeutic target for HCC treatment. Future research is needed to further explore the underlying mechanisms of SPDL1 in HCC.
Supplementary Information
Author contributions
Zhong-An Wang conceived the experimental design and methodology. Ying-Ming Xu and Bo-Hua You downloaded the data and performed the analysis and visualization of the results. Ying-Ming Xu and Ming Chen compiled the materials and drafted the manuscript. Bo-Hua You, Tian-Ping Xiong, Lin Shi, Qin Wei, and Zhong-An Wang revised and polished the manuscript. All authors approved the final manuscript.
Funding
Not applicable.
Data availability
The datasets analyzed in this study are available in the TCGA database (https://portal.gdc.cancer.gov/), the XENA database (https://xena.ucsc.edu/), and the Xiantao Academic website (https://www.xiantaozi.com/), or can be obtained from the corresponding author.
Declarations
Ethics approval and consent to participate
Not applicable.
Consent to publication
Not applicable.
Competing interests
The authors declare no competing interests.
Footnotes
Publisher’s note
Springer Nature remains neutral with regard to jurisdictional claims in published maps and institutional affiliations.
Ying-Ming Xu and Bo-Hua You are co-first authors.
References
- 1.Niu Z, Yang F, Li H, Wang J, Ni Q, Ma C, Zhu H, Chang H, Zhou X, Lu J, Gao H. MCT4 promotes hepatocellular carcinoma progression by upregulating TRAPPC5 gene. J Hepatocell Carcinoma. 2022;9:289–300. 10.2147/JHC.S352948. [DOI] [PMC free article] [PubMed] [Google Scholar]
- 2.Han CP, Yu YH, Wang AG, Tian Y, Zhang HT, Zheng ZM, Liu YS. Desmoglein-2 overexpression predicts poor prognosis in hepatocellular carcinoma patients. Eur Rev Med Pharmacol Sci. 2018;22(17):5481–9. 10.26355/eurrev_201809_15808. [DOI] [PubMed] [Google Scholar]
- 3.Xiang QM, Jiang N, Liu YF, Wang YB, Mu DA, Liu R, Sun LY, Zhang W, Guo Q, Li K. Overexpression of SH2D1A promotes cancer progression and is associated with immune cell infiltration in hepatocellular carcinoma via bioinformatics and in vitro study. BMC Cancer. 2023;23(1):1005. 10.1186/s12885-023-11315-1. [DOI] [PMC free article] [PubMed] [Google Scholar]
- 4.Klimaszewska-Wiśniewska A, Buchholz K, Durślewicz J, Villodre ES, Gagat M, Grzanka D. SPDL1 is an independent predictor of patient outcome in colorectal Cancer. Int J Mol Sci. 2022;23(3):1819. 10.3390/ijms23031819. [DOI] [PMC free article] [PubMed] [Google Scholar]
- 5.Kodama T, Marian TA, Lee H, Kodama M, Li J, Parmacek MS, Jenkins NA, Copeland NG, Wei Z. MRTFB suppresses colorectal cancer development through regulating SPDL1 and MCAM. Proc Natl Acad Sci U S A. 2019;116(47):23625–35. 10.1073/pnas.1910413116. [DOI] [PMC free article] [PubMed] [Google Scholar]
- 6.Song P, Wusiman D, Li F, Wu X, Guo L, Li W, Gao S, He J. Pan-cancer analysis combined with experiments explores the oncogenic role of spindle apparatus coiled-coil protein 1 (SPDL1). Cancer Cell Int. 2022;22(1):49. 10.1186/s12935-022-02461-w. [DOI] [PMC free article] [PubMed] [Google Scholar]
- 7.Liu HS, Guo Q, Yang H, Zeng M, Xu LQ, Zhang QX, Liu H, Guo JL, Zhang J. SPDL1 overexpression is associated with the 18F-FDG PET/CT metabolic parameters, prognosis, and progression of esophageal Cancer. Front Genet. 2022;13:798020. 10.3389/fgene.2022.798020. [DOI] [PMC free article] [PubMed] [Google Scholar]
- 8.Klimaszewska-Wiśniewska A, Buchholz K, Neska-Długosz I, Durślewicz J, Grzanka D, Zabrzyński J, Sopońska P, Grzanka A, Gagat M. Expression of genomic Instability-Related molecules: Cyclin F, RRM2 and SPDL1 and their prognostic significance in pancreatic adenocarcinoma. Cancers (Basel). 2021;13(4):859. 10.3390/cancers13040859. [DOI] [PMC free article] [PubMed] [Google Scholar]
- 9.Yang XY, Zheng XX, Zhai XJ, Tang T, Yu SC. Spindle apparatus coiled-coil protein 1 (SPDL1) serves as a novel prognostic biomarker in triple-negative breast cancer. Proteom Clin Appl. 2024. 10.1002/prca.202300002. [DOI] [PubMed] [Google Scholar]
- 10.Zheng J, Haseeb A, Wang Z, Wang H. Network pharmacology, computational biology integrated surface plasmon resonance technology reveals the mechanism of ellagic acid against rotavirus. Sci Rep. 2024;14(1):7548. 10.1038/s41598-024-58301-6. [DOI] [PMC free article] [PubMed] [Google Scholar]
- 11.Wu Q, Fan C, Liu K, Tang J. GDF11 inhibits the malignant progression of hepatocellular carcinoma via regulation of the mTORC1–autophagy axis. Exp Ther Med. 2024;27(6):252. 10.3892/etm.2024.12540. [DOI] [PMC free article] [PubMed] [Google Scholar]
- 12.Guo D, Zhang M, Wei T, Zhang X, Shi X, Tang H, Ding M, Li J, Zhang S, Guo W. NFKBIZ regulates NFκB signaling pathway to mediate tumorigenesis and metastasis of hepatocellular carcinoma by direct interaction with TRIM16. Cell Mol Life Sci. 2024;81(1):167. 10.1007/s00018-024-05182-7. [DOI] [PMC free article] [PubMed] [Google Scholar]
- 13.Jiang D, Zhu XL, An Y, Li YR. Clinical significance of small nuclear ribonucleoprotein U1 subunit 70 in patients with hepatocellular carcinoma. PeerJ. 2024;12:e16876. 10.7717/peerj.16876. [DOI] [PMC free article] [PubMed] [Google Scholar]
- 14.Li YK, Wu S, Wu YS, Zhang WH, Wang Y, Li YH, Kang Q, Huang SQ, Zheng K, Jiang GM, Wang QB, Liang YB, Li J, Lakang Y, Yang C, Li J, Wang JP, Kui X, Ke Y. Portal venous and hepatic arterial coefficients predict Post-Hepatectomy overall and Recurrence-Free survival in patients with hepatocellular carcinoma: A retrospective study. J Hepatocell Carcinoma. 2024;11:1389–402. [DOI] [PMC free article] [PubMed] [Google Scholar]
- 15.Tong L, Zheng X, Wang T, Gu W, Shen T, Yuan W, Wang S, Xing S, Liu X, Zhang C, Zhang C. Inhibition of UBA52 induces autophagy via EMC6 to suppress hepatocellular carcinoma tumorigenesis and progression. J Cell Mol Med. 2024;28(6):e18164. 10.1111/jcmm.18164. [DOI] [PMC free article] [PubMed] [Google Scholar]
- 16.Li J, Wang QB, Liang YB, Chen XM, Luo WL, Li YK, Chen X, Lu QY, Ke Y. Tumor-associated lymphatic vessel density is a reliable biomarker for prognosis of esophageal cancer after radical resection: a systemic review and meta-analysis. Front Immunol. 2024;15:1453482. [DOI] [PMC free article] [PubMed] [Google Scholar]
- 17.Wang QB, Li J, Zhang ZJ, Li YK, Liang YB, Chen XM, Luo WL, Lakang Y, Yang ZS, Liu GY, Liu Y, Li SX, Ke Y. The effectiveness and safety of therapies for hepatocellular carcinoma with tumor thrombus in the hepatic vein, inferior Vena cave and/or right atrium: a systematic review and single-arm meta-analysis. Expert Rev Anticancer Ther. 2025;25(5):561–70. [DOI] [PubMed] [Google Scholar]
- 18.Li J, Liang YB, Wang QB, Li YK, Chen XM, Luo WL, Lakang Y, Yang ZS, Wang Y, Li ZW, Ke Y. Tumor-associated lymphatic vessel density is a postoperative prognostic biomarker of hepatobiliary cancers: a systematic review and meta-analysis. Front Immunol. 2025;15:1519999. [DOI] [PMC free article] [PubMed] [Google Scholar]
- 19.Liu Z, Liu X, Liang J, Liu Y, Hou X, Zhang M, Li Y, Jiang X. Immunotherapy for hepatocellular carcinoma: current status and future prospects. Front Immunol. 2021;12:765101. 10.3389/fimmu.2021.765101. [DOI] [PMC free article] [PubMed] [Google Scholar]
- 20.She M, Wu Y, Cheng M, Feng S, Li G, Rong H. Efficacy and safety of PD-1/PD-L1 inhibitor-based immune combination therapy versus Sorafenib in the treatment of advanced hepatocellular carcinoma: a meta-analysis. Front Med (Lausanne). 2024;11:1401139. 10.3389/fmed.2024.1401139. [DOI] [PMC free article] [PubMed] [Google Scholar]
- 21.Wang P, Xu MH, Xu WX, Dong ZY, Shen YH, Qin WZ. CXCL9 overexpression predicts better HCC response to Anti-PD-1 therapy and promotes N1 polarization of neutrophils. J Hepatocell Carcinoma. 2024;11:787–800. 10.2147/JHC.S450468. [DOI] [PMC free article] [PubMed] [Google Scholar]
- 22.Li Z, Wu Z, You X, Tang N. Pan-cancer analysis reveals that TK1 promotes tumor progression by mediating cell proliferation and Th2 cell polarization. Cancer Cell Int. 2024;24(1):329. [DOI] [PMC free article] [PubMed] [Google Scholar]
- 23.Aghayev T, Mazitova AM, Fang JR, Peshkova IO, Rausch M, Hung M, White KF, Masia R, Titerina EK, Fatkhullina AR, Cousineau I, Turcotte S, Zhigarev D, Marchenko A, Khoziainova S, Makhov P, Tan YF, Kossenkov AV, Wiest DL, Stagg J, Wang XW, Campbell KS, Dzutsev AK, Trinchieri G, Hill JA, Grivennikov SI, Koltsova EK. IL27 signaling serves as an Immunologic checkpoint for innate cytotoxic cells to promote hepatocellular carcinoma. Cancer Discov. 2022;12(8):1960–83. [DOI] [PMC free article] [PubMed] [Google Scholar]
- 24.Liu P, Chen L, Zhang H. Natural killer cells in liver disease and hepatocellular carcinoma and the NK cell-based immunotherapy. J Immunol Res. 2018;2018:1206737. [DOI] [PMC free article] [PubMed] [Google Scholar]
Associated Data
This section collects any data citations, data availability statements, or supplementary materials included in this article.
Supplementary Materials
Data Availability Statement
The datasets analyzed in this study are available in the TCGA database (https://portal.gdc.cancer.gov/), the XENA database (https://xena.ucsc.edu/), and the Xiantao Academic website (https://www.xiantaozi.com/), or can be obtained from the corresponding author.


