Abstract
Characterization of the unfolded state is essential for understanding the protein folding problem. In the unfolded state, a protein molecule samples vastly different conformations. Here I present a simple theoretical method for treating residual charge–charge interactions in the unfolded state. The method is based on modeling an unfolded protein as a Gaussian chain. After sampling over all conformations, the electrostatic interaction energy between two charged residues (separated by l peptide bonds) is given by W = 332(6/π)1/2[1 − π1/2xexp(x2)erfc(x)]/ɛd, where d = bl1/2 + s and x = κd/61/2. In unfolded barnase, the residual interactions lead to downward pKa shifts of ≈0.33 unit, in agreement with experiment. pKa shifts in the unfolded state significantly affect pH dependence of protein folding stability, and the predicted effects agree very well with experimental results on barnase and four other proteins. For T4 lysozyme, the charge reversal mutation K147E is found to stabilize the unfolded state even more than the folded state (1.39 vs. 0.46 kcal/mol), leading to the experimentally observed result that the mutation is net destabilizing for the folding. The Gaussian-chain model provides a quantitative characterization of the unfolded state and may prove valuable for elucidating the energetic contributions to the stability of thermophilic proteins and the energy landscape of protein folding.
There is growing evidence indicating that there are residual charge–charge interactions when proteins are unfolded (1–6). A quantitative characterization of these residual interactions will lead to a fuller understanding of the folding problem. This task is hampered by the fact that, in the unfolded state, a protein molecule samples vastly different conformations (7). The simplest polymer model that captures the conformational sampling in the unfolded state is the Gaussian chain, which has recently been used to account for the effect of spatial confinement on protein stability (8). Here we show that this model can be used to account for the residual charge–charge interactions and quantitatively reproduces experimental results on pH dependence of folding stability for five proteins.
That residual charge–charge interactions exist in the unfolded state is not surprising. According to Coulomb's law, two charged residues fully solvated in water have an interaction energy
 |
1 |
where “+” (“−”) is for like (opposite) charges, ɛ is the dielectric constant of water ( = 78.5 at room temperature), and r is the distance between the charges (in Å). As the unfolded chain samples different conformations, residues close along the sequence will tend to sample short distances (9). At a distance of 8 Å, the residual interaction energy between a pair of charges is 0.5 kcal/mol.
Residual charge–charge interactions in the unfolded state will lead to shifts in pKa from values of model compounds. pKa shifts in turn will affect pH dependence of folding stability, which is governed by (10)
 |
2 |
where kBT is the product of the Boltzmann constant and the absolute temperature, and Qu (Qf) is the total charge on the protein at a given pH in the unfolded (folded) state. If the protein has a total of N ionizable groups with pKa values of pKi,u in the unfolded state, then
 |
3 |
where N+ is the number of ionizable groups that become charged on protonation (Arg and Lys). Residual charge–charge interactions in the unfolded state are easily detected experimentally when the pH dependence of ΔGunfold predicted by Eq. 2, using Qu calculated with model-compound values for pKi,u, deviates from measurement (2–4, 6).
Elcock (11) recently calculated residual charge–charge interactions in a single conformation of the unfolded state, obtained from unfolding the native structure by molecular dynamics simulations. This unfolded model was called “native-like.” The Gaussian-chain model allows the unfolded protein chain to sample different conformations and predicts pH dependence of folding stability that is in better agreement with experiment. A simple analytical expression derived for the residual interaction energy now makes it an easy task to treat electrostatic effects for any unfolded protein.
Methods
Charge–Charge Interactions in the Unfolded State.
To account for screening by salt ions, we assume that the interaction between two charged residues follows the Debye–Hückel theory:
 |
4 |
where κ = (8πIe2/ɛkBT)1/2 (= I1/2/3.04 Å−1 at room temperature) and I is the ionic strength. Tanford's book (12) gives a very useful discussion of this and alternative applications of the Debye–Hückel theory to flexible polyelectrolytes (the linearization involved in Eq. 4 is applicable to protein chains but perhaps not to highly charged polymers such as DNA). In a Gaussian chain, the distance between two residues is not fixed but distributed according to (12)
 |
5 |
where d is the root-mean-square distance. This mean distance depends on l, the number of peptide bonds separating the two residues. For a Gaussian chain, one has d = bl1/2. To account for the fact that the distance of interest is between two side chains, we add a shift to the classical result, resulting in
 |
6 |
The effective bond length b and the shift distance s are the only adjustable parameters in our theory. Our earlier work (13) has indicated that b is in the range of 6 to 9 Å. All results in this paper were calculated with b = 7.5 Å and s = 5 Å.
When the distance between charged residues i and j is sampled from the Gaussian distribution, the mean interaction energy has the magnitude
 |
7 |
 |
where x = κd/61/2 and erfc(x) is the complementary error function.
Total Charge on the Protein at a Given pH.
We assume that, in the absence of the residual charge–charge interactions, the pKa values of the ionizable groups take model-compound values pKi,0. The distribution of the protonation states xi of the ionizable groups is governed by the Hamiltonian (14)
 |
8 |
 |
where xi = 0 (1) when group i is unprotonated (protonated) and xi0 is the protonation state when the group is charge neutral (1 for Asp and Glu and 0 for Arg and Lys). Because one may expect that residues in the unfolded state should be less well solvated than model compounds, there is a possibility that solvation (in addition to residual charge–charge interactions) also perturbs pKa values. This possibility was not studied in the present paper. The average protonation of group i at a given pH is
 |
9 |
which was evaluated by a Monte Carlo simulation. The total charge on the protein is
 |
10 |
This was then integrated numerically over pH to yield pH dependence of the unfolding free energy (see Eq. 2).
The pH titration of an ionizable group can be described by a pKa value. This was obtained by fitting the pH dependence of x̄i to the Hill equation:
 |
11 |
Note that, regardless of the value of the Hill coefficient ni, pKi,u equals the pH at which the group is 50% protonated.
The calculation of Qu requires as input only a file listing the following information about each ionizable group: residue number (for calculating sequence separation l between groups), protonation state xi,0 when the group is neutral, and pKi,0 for the corresponding model compound. Five proteins are studied: barnase, chymotrypsin inhibitor 2 (CI2), ovomucoid third domain (OMTKY3), ribonuclease A, and ribonuclease T1. The ionic strengths (I) at which calculations were made are 50, 200, 10, 30, and 30 mM, respectively, for the five proteins.
The model-compound pKa values used were the same as in Elcock's work (11). These values are: Asp, 4.0; Glu, 4.4; His, 6.3; Cys, 8.3; Tyr, 9.6; Lys, 10.4; Arg, 12.0; N-terminal, 7.5; and C terminal, 3.8.
Comparison with Experiment and Other Models.
Following Elcock (11), we use the total charge Qu calculated by Eq. 10, along with the experimentally determined total charge Qf for the folded state, to predict pH dependence of the unfolding free energy. Experimental Qf results were obtained either from measured pKa values of all ionizable residues or from pH titration of the folded state (details were given by Elcock). The predicted pH dependence of the unfolding free energy is then compared with experiment. Comparison is also made with the published results of Elcock's native-like model (11) and the “idealized” model in which Qu is calculated from Eq. 3 with model-compound values for pKi,u.
Results
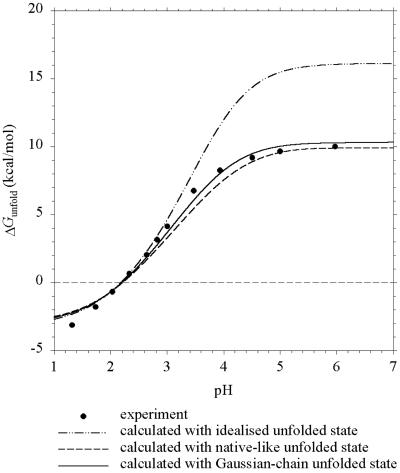
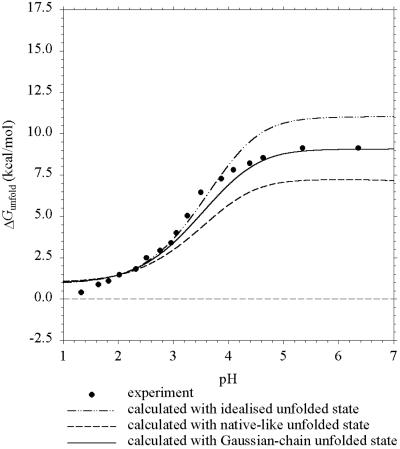
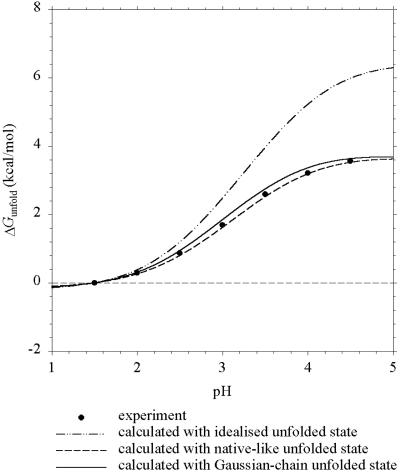
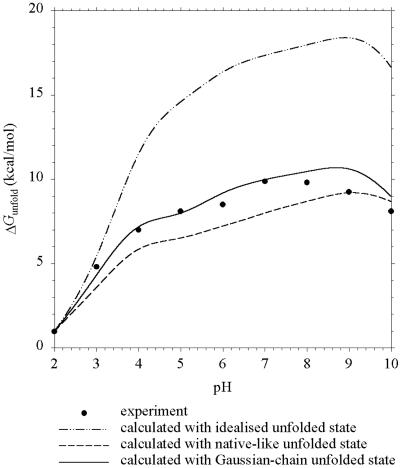
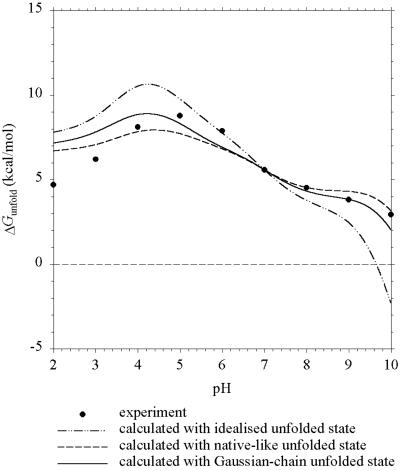
Predicted pH dependence of the unfolding free energy, using the total protein charge Qu in the unfolded state calculated with the Gaussian-chain model, agrees very well with experiment for all of the five proteins studied. As noted by Elcock (11), the idealized model (using Qu calculated with model-compound pKa values) predicts poorly the pH dependence of ΔGunfold in all cases, indicating significant residual charge–charge interactions in the unfolded state. The native-like model of Elcock leads to significant improvement in predicting pH dependence of ΔGunfold. However, it does at times overestimate pKa shifts in the unfolded state, indicating the need to sample more than just one conformation.
Barnase.
In Fig. 1 we compare the pH dependence of ΔGunfold predicted by the Gaussian-chain, native-like, and idealized models for barnase with previous experiments (3). Both the Gaussian-chain and the native-like models make good predictions. However, differences appear when the calculated pKa values for individual groups are compared. As Table 1 shows, the pKa shifts calculated with the Gaussian-chain model range from −0.14 to −0.51. pKi,u − pKi,0 calculated with the native-like model exhibits much wider variations, ranging from +0.05 to −0.88. The mean shifts of the two models, however, are nearly the same and are in agreement with the uniform shift in pKi,u used by Oliveberg et al. (3) to simulate their experimental data. Pace et al. (15) have additional data for ΔGunfold above pH 7, but comparisons with these data are prevented by apparent lack of experimental data on Qf.
Figure 1.
Predicted and experimental (ref. 3) pH dependence of ΔGunfold for barnase at I = 50 mM.
Table 1.
pKa shifts from model-compound values calculated with the Gaussian-chain and native-like models for barnase at I = 50 mM
| Group | Shift, pH unit
|
|
|---|---|---|
| Gaussian-chain model* | Native-like model | |
| Asp-8 | −0.14 | −0.11 |
| Asp-12 | −0.16 | −0.27 |
| Asp-22 | −0.29 | −0.42 |
| Glu-29 | −0.27 | −0.15 |
| Asp-44 | −0.28 | −0.42 |
| Asp-54 | −0.31 | −0.43 |
| Glu-60 | −0.51 | −0.48 |
| Glu-73 | −0.42 | +0.05 |
| Asp-75 | −0.33 | −0.11 |
| Asp-86 | −0.44 | −0.88 |
| Asp-93 | −0.28 | −0.38 |
| Asp-101 | −0.43 | −0.34 |
| C-terminal | −0.41 | −0.64 |
| Mean pKi,u − pKi,0 | −0.33 | −0.35 |
The Hill coefficients (see Eq. 11) range from 0.91 to 0.97.
CI2.
Fig. 2 displays the results of the three models for CI2 along with the experimental data (4). The Gaussian-chain model shows excellent agreement with experiment, whereas the native-like and idealized models underestimate and overestimate, respectively, ΔGunfold by 2 kcal/mol at pH 7. As noted by Elcock (11), the underestimate of the native-like model can be traced to an “excessively low” pKa calculated for Asp-45. In his words, “a downward shift of 1.1 units in what ought to be an unstructured state seems unrealistically large” (11). Rather than inheriting from the folded structure the salt bridge with Arg-46 and close distances with Arg-43 and Arg-48 (as in the native-like model), the Gaussian-chain model allows Asp-45 in unfolded CI2 to sample a range of distances with the positively charged residues. This sampling of distances leads to a moderate downward shift of 0.24 unit in the pKa shift of Asp-45.
Figure 2.
Predicted and experimental (ref. 4) pH dependence of ΔGunfold for CI2 at I = 200 mM.
OMTKY3.
The calculated and experimental (2) results for OMTKY3 are shown in Fig. 3. There are significant residual charge–charge interactions in the unfolded state, which are predicted well by both the Gaussian-chain and the native-like models.
Figure 3.
Predicted and experimental (ref. 2) pH dependence of ΔGunfold for OMTKY3 at I = 10 mM.
Ribonulease A.
In Fig. 4, the pH dependence of ΔGunfold predicted by the three models for ribonuclease A is compared with a previous experiment (16). The Gaussian-chain model performs remarkably well in reproducing the experimental results over a wide pH range of 2–10. The results of the native-like model show significant deviations from experiment. Elcock (11) attributed these partly to an “excessively low” pKa (2.39) calculated for Asp-38. According to him, “the magnitude of this shift (from a model-compound value of 4.0) is almost certainly overestimated.” In Elcock's native-like unfolded conformation, Asp-38 has distances of 5, 6, and 7.5 Å from Arg-39, Lys-41, and Lys-37, respectively. The pKa value of Asp-38 calculated with the Gaussian-chain model is 3.09.
Figure 4.
Predicted and experimental (ref. 16) pH dependence of ΔGunfold for ribonuclease A at I = 30 mM.
Ribonuclease T1.
The calculated and experimental (16) results for ribonuclease T1 are displayed in Fig. 5. The Gaussian-chain and native-like models both do well in reproducing the experimental results between pH 4 and 10. The steeper decreasing slope in the pH dependence of ΔGunfold around pH 7 obtained with the Gaussian-chain model is in better agreement with experiment.
Figure 5.
Predicted and experimental (ref. 16) pH dependence of ΔGunfold for ribonuclease T1 at I = 30 mM.
Discussion
I have shown that residual charge–charge interactions in the unfolded state of five proteins are predicted very well by the Gaussian-chain model. This model captures an essential feature of the unfolded state, i.e., the protein chain samples many different conformations. As such, it avoids the unrealistically excessive pKa shifts produced by the native-like model of Elcock. The simplicity of the model, with the interaction energy between two charged residues given by an analytical expression (Eq. 7), allows it to be easily used to treat electrostatic effects for any unfolded protein.
It is not suggested that an unfolded protein actually samples conformations expected of a Gaussian chain. Rather, as a polymer chain, the unfolded protein is expected to have mean residue–residue distances that increase with sequence separation, and the Gaussian chain is the simplest model to account for this increase.
The value of the effective bond length b of the Gaussian-chain model, 7.5 Å, used in this study is within the range calculated from hydrodynamic data for unfolded proteins (13). Electrostatic effects for five proteins over wide pH ranges are reasonably predicted without adjusting this value (or the 5-Å value of the shift distance s). This observation suggests that the model as is should have wide applicability. It should be noted that the Gaussian-chain model is used for describing the conformations sampled in the unfolded state with the residual charge–charge interactions present (rather than in a hypothetical state in which the charges are completely removed from the chain). Of course solvent conditions (e.g., pH) are expected to have some influence on the dimensions of unfolded proteins (7, 16). This influence perhaps partly explains the deviations of prediction from experiment at extremes of pH (i.e., pH < 1.5 for barnase and CI2; pH > 9 for RNase A; and pH < 4 for RNase T1).
That significant residual charge–charge interactions exist in the unfolded state now appears to be well established. This knowledge directly impacts our understanding of electrostatic contributions to protein stability. In particular, to account for the effect of a charge reversal mutation on ΔGunfold, one must include the change in the residual interaction energy, ΔG , caused by the mutation. In the Gaussian-chain model, when the mth ionizable group is mutated, we have
 |
12a |
where ′ and " refer to the wild type and mutant, respectively, and
 |
12b |
The average is over a Boltzmann distribution of the protonation states (compare Eqs. 8 and 9).
In previous studies (17–19), residual charge–charge interactions in the unfolded state have been ignored. For the charge mutations on barnase studied by Vijayakumar and Zhou (19), the contributions of ΔG as calculated from Eq. 12 are relatively small (see Table 2). The inclusion of ΔG
 does bring the calculated results for the mutational effects on the unfolding free energy into closer agreement with experiment (20). Table 2 shows that, for T4 lysozyme, ribonucleases T1 and Sa, and myoglobin, the magnitude of ΔG
 quite often exceeds the magnitude of the experimental result for the overall unfolding free energy. As in the case for barnase, inclusion of ΔG
 brings calculation into closer agreement with experiment for T4 lysozyme and ribonucleases T1 and Sa. In particular, the lysozyme mutation K147E is found to stabilize the unfolded state even more than the folded state (1.39 vs. 0.46 kcal/mol), leading to the experimentally observed result that the mutation is net-destabilizing for folding (21). The strong stabilization of the unfolded state by K147E reflects the fact that the five nearest ionizable groups (K135, R137, R145, R148, and R154) along the sequence are all positively charged. We expect residual charge–charge interactions to be very important for thermophilic proteins, which usually have prominent clusters of charged residues (17).
Table 2.
Effects of charge mutations on the electrostatic energies of proteins
| Protein | Mutation | Energy, kcal/mol
|
|||
|---|---|---|---|---|---|
ΔΔG (calc)* (calc)*
|
ΔG (calc)† (calc)†
|
ΔΔGunfold (calc)‡ | ΔΔGunfold (expt)§ | ||
| Barnase | R69S | −1.67 | −0.13 | −1.80 | −2.67 |
| R69M | −2.11 | −0.13 | −2.24 | −2.24 | |
| D75N | −4.62 | +0.14 | −4.48 | −4.51 | |
| R83Q | −2.36 | +0.01 | −2.35 | −2.23 | |
| D93N | −4.35 | +0.13 | −4.22 | −4.17 | |
| D75N/R83K | −5.38 | +0.14 | −5.24 | −5.19 | |
| R69S/D93N | −2.89 | −0.01 | −2.90 | −3.62 | |
| T4 lysozyme | R119E | +1.79 | −0.49 | +1.30 | 0.0 |
| K135E | +0.83 | −0.83 | 0.0 | −1.0 | |
| K147E | +0.46 | −1.39 | −0.93 | −0.7 | |
| Ribonuclease T1 | D49H | +3.2 | −1.78 | +1.42 | +1.1 |
| Ribonuclease Sa | D17K | +3.2 | −1.70 | +1.50 | −1.1 |
| D25K | +2.4 | −1.55 | +0.85 | +0.9 | |
| E41K | +1.2 | −0.68 | +0.52 | −1.2 | |
| E74K | +2.2 | −1.02 | +1.18 | +1.1 | |
| Myoglobin | E4A | +0.31 | −0.50 | ||
| E18A | +0.49 | −1.03 | |||
| D20A | +0.50 | −0.45 | |||
| D44A | +1.19 | +0.15 | |||
| K56A | −0.43 | −0.30 | |||
| D60A | +0.96 | −0.20 | |||
| K77A | −1.28 | +0.20 | |||
| R118A | −0.81 | −0.65 | |||
| D122A | +0.80 | −0.08 | |||
| K133A | −0.32 | +0.03 | |||
| K139A | −0.43 | −0.45 | |||
Calculated without including residual charge–charge interactions in the unfolded state. Sources of the results are as follows: barnase, from Vijayakumar and Zhou (19); T4 lysozyme, F. Dong and H.-X. Z., unpublished and calculated using the same protocol as in ref. 19; and ribonucleases T1 and Sa, from Pace et al. (ref. 5; calculated using Coulomb's law for the folded state).
Calculated from Eq. 12. The solvent conditions were as follows: barnase, pH 6.3 and 100 mM ionic strength; T4 lysozyme, pH 5.3 and 50 mM ionic strength; ribonucleases T1 and Sa, pH 7 and 0 ionic strength (to be in line with the Coulomb's law calculations of Pace et al., ref. 5); and myoglobin, pH 5 and 10 mM ionic strength. The temperature was 25°C for all proteins but T4 lysozyme, for which T = 65°C.
ΔΔG + ΔG
+ ΔG .
.
Residual charge–charge interactions should be part of the energy landscape for protein folding. It is now well known that denatured proteins have persistent structural elements (7, 23, 24). The residual charge–charge interactions perhaps may help stabilizing these structural elements or otherwise help the folding process by biasing the energy landscape toward the native state (19, 25).
Acknowledgments
I thank Dr. Adrian Elcock for sending me his calculation results (from ref. 11). This work was supported in part by National Institutes of Health Grant GM58187.
Abbreviations
- CI2
chymotrypsin inhibitor 2
- OMTKY3
ovomucoid third domain
References
- 1.Oliveberg M, Vuilleumier S, Fersht A R. Biochemistry. 1994;33:8826–8832. doi: 10.1021/bi00195a026. [DOI] [PubMed] [Google Scholar]
- 2.Swint-Kruse L, Robertson A D. Biochemistry. 1995;34:4724–4732. doi: 10.1021/bi00014a029. [DOI] [PubMed] [Google Scholar]
- 3.Oliverberg M, Arcus V L, Fersht A R. Biochemistry. 1995;34:9424–9433. doi: 10.1021/bi00029a018. [DOI] [PubMed] [Google Scholar]
- 4.Tan Y-J, Oliverberg M, Davis B, Fersht A R. J Mol Biol. 1995;254:980–992. doi: 10.1006/jmbi.1995.0670. [DOI] [PubMed] [Google Scholar]
- 5.Pace C N, Alston R W, Shaw K L. Protein Sci. 2000;9:1395–1398. doi: 10.1110/ps.9.7.1395. [DOI] [PMC free article] [PubMed] [Google Scholar]
- 6.Whitten S T, Garcia-Moreno E, B. Biochemistry. 2000;39:14292–14304. doi: 10.1021/bi001015c. [DOI] [PubMed] [Google Scholar]
- 7.Dill K A, Shortle D. Annu Rev Biochem. 1991;60:795–825. doi: 10.1146/annurev.bi.60.070191.004051. [DOI] [PubMed] [Google Scholar]
- 8.Zhou H-X, Dill K A. Biochemistry. 2001;40:11289–11293. doi: 10.1021/bi0155504. [DOI] [PubMed] [Google Scholar]
- 9.Vijayakumar M, Zhou H-X. J Phys Chem B. 2000;104:9755–9764. [Google Scholar]
- 10.Tanford C. Adv Protein Chem. 1970;24:1–95. [PubMed] [Google Scholar]
- 11.Elcock A H. J Mol Biol. 1999;294:1051–1062. doi: 10.1006/jmbi.1999.3305. [DOI] [PubMed] [Google Scholar]
- 12.Tanford C. Physical Chemistry of Macromolecules. New York: Wiley; 1961. [Google Scholar]
- 13. Zhou, H.-X. (2001) J. Phys. Chem. B, in press.
- 14.Zhou H-X, Vijayakumar M. J Mol Biol. 1997;267:1002–1011. doi: 10.1006/jmbi.1997.0895. [DOI] [PubMed] [Google Scholar]
- 15.Pace N C. Biochemistry. 1992;31:2728–2734. doi: 10.1021/bi00125a013. [DOI] [PubMed] [Google Scholar]
- 16.Pace C N, Laurents D V, Thomson J A. Biochemistry. 1990;29:2564–2572. doi: 10.1021/bi00462a019. [DOI] [PubMed] [Google Scholar]
- 17.Xiao L, Honig B. J Mol Biol. 1999;289:1435–1444. doi: 10.1006/jmbi.1999.2810. [DOI] [PubMed] [Google Scholar]
- 18.Spector S, Wang M, Carp S A, Robblee J, Hendsch Z S, Fairman R, Tidor B, Raleigh D P. Biochemistry. 2000;39:872–879. doi: 10.1021/bi992091m. [DOI] [PubMed] [Google Scholar]
- 19.Vijayakumar M, Zhou H-X. J Phys Chem B. 2001;105:7334–7340. [Google Scholar]
- 20.Tissot A C, Vuilleumier S, Fersht A R. Biochemistry. 1996;35:6786–6794. doi: 10.1021/bi952930e. [DOI] [PubMed] [Google Scholar]
- 21.Dao-pin S, Soderlind E, Baase W A, Wozniak J A, Sauer U, Matthews B W. J Mol Biol. 1991;221:873–887. doi: 10.1016/0022-2836(91)80181-s. [DOI] [PubMed] [Google Scholar]
- 22.Ramos C H I, Kay M S, Baldwin R L. Biochemistry. 1999;38:9783–9790. doi: 10.1021/bi9828627. [DOI] [PubMed] [Google Scholar]
- 23.Bierzynski A, Baldwin R L. J Mol Biol. 1982;162:173–186. doi: 10.1016/0022-2836(82)90167-x. [DOI] [PubMed] [Google Scholar]
- 24.Gillespie J R, Shortle D. J Mol Biol. 1997;268:170–184. doi: 10.1006/jmbi.1997.0953. [DOI] [PubMed] [Google Scholar]
- 25.Oliveberg M, Fersht A R. Biochemistry. 1996;35:6795–6805. doi: 10.1021/bi9529317. [DOI] [PubMed] [Google Scholar]


