



Abstract
Prostate carcinoma (PC) is the most frequently diagnosed malignancy and the third leading cause of cancer-related death among men in the United States, with over 160,000 new cases reported annually. While prostate-specific antigen (PSA) screening has advanced the early detection and management of PC, its diagnostic accuracy, particularly in distinguishing malignant from benign conditions, remains controversial. Therefore, this study aimed to improve the accuracy and efficiency of early PC diagnosis by constructing a diagnostic model based on hematological indicators. Emerging inflammatory markers such as the neutrophil-to-lymphocyte ratio (NLR), platelet-to-lymphocyte ratio (PLR), and C-reactive protein (CRP) were incorporated to supplement traditional PSA testing. This study employed a retrospective design and included 317 patients receiving prostate puncture at Foshan Fosun Chancheng Hospital of Guangdong Medical University between January 2019 and January 2022 as the research subjects. These patients were grouped into two categories: 126 diagnosed with PC and 191 diagnosed with benign prostatic hyperplasia, based on histopathological examination of the biopsy samples. Clinical and laboratory data were extracted from the electronic medical record system. Diagnostic markers for PC were screened by logistic regression and least absolute shrinkage and selection operator (LASSO) regression. The diagnostic performance of the model was evaluated using ROC and decision curve analysis. PSA, Neu, Mono, CRP, NLR, NAR, and CK-MB were identified as independent diagnostic indicators, effectively distinguishing PC from benign prostatic hyperplasia. The LASSO regression-based predictive model achieved an AUC of 0.850, significantly outperforming the traditional logistic regression model (AUC=0.792; P=0.042, Delong test), indicating superior diagnostic accuracy and model performance. In conclusion, the combination of traditional PSA testing and emerging inflammatory markers can significantly enhances early diagnostic accuracy for PC and the proposed model offers a promising approach for early detection and clinical decision-making.
Keywords: Hematology, diagnostic model, prostate carcinoma, risk, clinical significance
Introduction
Prostate carcinoma (PC) is the most common malignancy among men in the United States, with over 160,000 new cases and nearly 30,000 deaths reported annually, making it the third leading cause of cancer-related deaths in men [1]. Statistics indicate that men aged >70 years are more susceptible to PC, with a higher incidence observed in populations compared to rural areas [2]. In recent years, the incidence of PC in China has been rising; however, significant differences remain in the clinical staging at diagnosis compared to the United States and other developed countries in Western Europe [3]. The median prostate-specific antigen (PSA) levels of newly diagnosed PC patients in China differ from those in western countries [4,5]. In China, only about one-third of patients are diagnosed with early-stage, clinically localized disease, while the majority present with advanced PC, often accompanied by bone or distant metastases, which significantly limits treatment options [6]. Correspondingly, PC patients in China show a markedly lower overall prognosis and survival, along with substantially higher mortality rates than those in developed Western countries [7]. Therefore, improving the accuracy of early diagnosis through advancements in tissue biopsy, risk stratification, magnetic resonance imaging, functional imaging, and biomarker applications can improve cure rates. For patients with PC, active monitoring is the preferred management strategy in appropriately selected cases.
Serum PSA, first purified in the late 1970s and approved for PC screening in the early 1990s, marked the beginning of the “PSA era” in PC screening, diagnosis, and treatment [8]. PSA screening involves systematic testing of clinically asymptomatic men to enable early detection of PC, allowing for timely curative treatment and reduction of disease-specific mortality [4]. Large-scale studies have shown that PSA-based PC screening can confer a survival benefit in the screened population [9,10]. Growing evidence suggests a strong association between chronic inflammation and carcinogenesis [11]. In individuals with malignancies (including PC), a drop in lymphocyte count (Lym) and elevations in neutrophil count (Neu) and C-reactive protein (CRP) levels indicate systemic inflammatory responses - features typically linked to tumor progression and metastasis. Notably, inflammation is essential in PC development and progression by fostering a tumor-supportive microenvironment and facilitating immune evasion [12,13]. These nonspecific inflammatory responses coupled with compromised immune function collectively accelerate tumor progression. Furthermore, inflammation has been established as a critical contributor to various cancers like non-small cell lung cancer, colon cancer, and breast cancer. Clinically, inflammation-tumor correlations are often assessed through markers like the neutrophil-to-lymphocyte ratio (NLR), platelet-to-lymphocyte ratio (PLR), and CRP expression quantification [14,15].
Consequently, a hematological and inflammatory marker-based model that integrates conventional PSA testing with emerging inflammatory biomarkers (NLR, PLR, and CRP), was developed in this study, with the aim of evaluating its value and potential in PC diagnosis and enhancing the diagnostic accuracy and efficiency for early PC. The proposed model is expected to improve the discrimination ability of early-stage PC and assist clinicians in evaluating disease severity and patient outcomes, ultimately supporting more personalized and precise treatment planning.
Data and methods
Sample size calculation
Sample size calculations were performed using the method reported by Lu et al. [16]. For the NLR, the PC group had a mean value of 2.94 (SD=1.74), compared to 2.28 (SD=1.12) in the benign prostatic hyperplasia (BPH) group. Regarding the systemic immune-inflammation index (SII), the mean was 613.28 (SD=346.93) in the PC group and 448.47 (SD=206.93) in the BPH group. The significance level (α) was set at 0.05 (two-sided test), with a test power (1-β) of 80%. Sample size was calculated using the formula , where Z1-α/2=1.96, Z1-β=0.8416, and the pooled standard deviation . The effect size was computed as . For NLR: mean difference =0.66, sp=1.463, d=0.451, and sample size =78. This required a sample size of 78 per group, totaling 156 cases. For SII: mean difference =164.81, sp=285.64 (rounded to 282.70 due to data adjustment), d=0.583, and sample size =47. This required 47 cases per group, totaling 94 cases.
Clinical data
The clinical data of 317 patients who underwent prostate biopsy at Foshan Fosun Chancheng Hospital of Guangdong Medical University between January 2019 and January 2022 were analyzed retrospectively. This study was approved by the Medical Ethics Committee of this hospital. Given its retrospective nature, the requirement for informed consent was waived with Ethics Committee approval (Figure 1).
Figure 1.

Sample inclusion flow chart.
Eligibility and exclusion criteria
Eligible patients were those who (1) were diagnosed with PC for the first time by transrectal ultrasonography-guided prostate biopsy based on abnormal digital rectal examination, elevated PSA levels, or abnormal imaging findings, with the biopsy procedure in line with the 2022 Urology Guidelines [16]; (2) had not recently received radiotherapy or chemotherapy; and (3) had complete clinical data.
Patients were excluded if they (1) had systemic or local acute/chronic inflammation (such as rheumatoid arthritis, systemic lupus erythematosus, inflammatory bowel disease, and chronic hepatitis) who were receiving anti-infection treatment, (2) were receiving endocrine therapy for PC, (3) had a history of other tumors, or (4) had other diseases (hematological diseases, autoimmune diseases, etc.) that may affect peripheral blood indices.
Data collection
Clinical and laboratory data, along with previous medical records, were retrieved from the hospital’s electronic medical record system. Collected clinical variables included age, body mass index (BMI), history of hypertension, history of diabetes, education level, and per capita monthly household income. Laboratory indicators comprised fasting blood glucose (FBG), high/low-density lipoprotein (HDL/LDL), very low-density lipoprotein (VLDL), triglycerides (TG), PSA, Neu, Lym, monocyte count (Mono), platelet count (PLT), CRP, creatine kinase (CK), creatine kinase-MB (CKMB), and apolipoprotein A1 (ApoA1).
Derived hematological indicators
In addition to standard hematological and biochemical parameters, this study incorporated several inflammatory markers known to be associated with cancer prognosis and diagnosis. These derived factors are: NLR, calculated by dividing the Neu by the Lym, reflects systemic inflammation and is associated with cancer prognosis; PLR, calculated by dividing the PLT by the Lym, mirrors both the patient’s inflammation status and immunity; the monocyte-to-lymphocyte ratio (MLR), calculated by dividing the Mono by the Lym, serves as a marker of systemic inflammation and immune response; the neutrophil-to-albumin ratio (NAR), calculated by dividing the Neu by the serum albumin level, reflects both inflammation and nutritional status; SII, calculated by multiplying the PLT by the Neu and dividing by the Lym, functions as a comprehensive indicator of immune and inflammation responses; the systemic inflammation response index (SIRI), calculated by multiplying the Neu by the Mono and dividing by the Lym, is used to assess the systemic inflammatory response. These indices were derived from each patient’s laboratory data and evaluated for their potential utility as diagnostic markers for PC, based on their previously reported associations with cancer outcomes in the literature.
Patient grouping
First, we selected 317 cases meeting the above eligibility and exclusion criteria, including 126 diagnosed as PC and 191 as BPH, to form the training group. In addition, 38 PC patients and 57 BPH patients diagnosed at our hospital from February 2022 to February 2023 were collected to serve as the external validation group for this study.
Outcome measurement
Primary measurement: 1. Logistic regression and least absolute shrinkage and selection operator (LASSO) regression were performed to screen diagnostic markers for PC. 2. Differences in receiver operating characteristic (ROC) curves between the logistic regression and LASSO regression models were compared using the Delong test.
Secondary measurement: 1. A diagnostic model involving the four diagnostic markers was developed and visualized using a nomogram. 2. The model’s clinical utility, predictive accuracy, and generalizability were evaluated using ROC analysis, calibration plots, and decision curve analysis (DCA).
Statistical analyses
Data were processed using SPSS 26.0 software. Categorical variables were expressed as rates (%) and compared using the χ2 test. Continuous data following a normal distribution were analyzed by the t test and presented as mean±standard deviation (SD), while non-normally distributed data were analyzed by the rank sum test and presented in the form of quartiles P50 [P25, P75]. Diagnostic markers for PC were identified using Logistic regression and LASSO regression models. Risk scores and characteristic diagnostic factors were determined using ROC curves. Model calibration and clinical utility were assessed using DCA and calibration curves. A nomogram was constructed using the RMS package in R software (version 4.3.2). A P-value <0.05 denoted statistically significant.
Results
Clinical data analysis
No statistically significant differences were observed between the PC and BPH groups regarding age, BMI, history of hypertension or diabetes, education level, or per capita monthly household income (P>0.05, Table 1). These results suggest that the two groups were well-matched across these baseline characteristics, supporting a more reliable comparison of laboratory parameters and diagnostic model performance.
Table 1.
Baseline data
| Factors | Prostate carcinoma (n=126) | Benign prostatic hyperplasia (n=191) | χ2/t/Z | P |
|---|---|---|---|---|
| Age | 64.00 [59.00, 71.00] | 66.00 [60.00, 72.00] | -0.774 | 0.439 |
| Body mass index (kg/m2) | 23.82±3.11 | 23.31±3.82 | 1.317 | 0.189 |
| History of hypertension | ||||
| With | 28 (22.22%) | 53 (27.75%) | 1.219 | 0.270 |
| Without | 98 (77.78%) | 138 (72.25%) | ||
| History of diabetes | ||||
| With | 31 (24.6%) | 38 (19.9%) | 0.988 | 0.320 |
| Without | 95 (75.4%) | 153 (80.1%) | ||
| Educational level | ||||
| ≥High school | 50 (39.68%) | 97 (50.79%) | 3.763 | 0.052 |
| <High school | 76 (60.32%) | 94 (49.21%) | ||
| Per capita monthly household income | ||||
| ≥4,000 yuan | 52 (41.27%) | 90 (47.12%) | 1.051 | 0.305 |
| <4000 yuan | 74 (58.73%) | 101 (52.88%) |
Comparison of laboratory indicators
Several significant differences emerged when comparing laboratory indicators between patients with PC and BPH. HDL, PSA, Neu, Mono, CRP, CK-MB, NLR, MLR, PLR, SII, SIRI, and NAR levels were significantly higher in patients with PC than in those with BPH (P<0.05, Table 2). Conversely, the Lym and ApoA1 levels were significantly lower in patients with PC. These results indicate that patients with PC exhibit a distinct hematological and inflammatory profile compared to those with BPH, underscoring the potential diagnostic value of these markers in differentiating malignant from benign prostate conditions. No statistically significant differences were found in other laboratory indicators such as FBG, LDL, VLDL, TG, TC, and CK, suggesting that these factors may have limited relevance for distinguishing PC from BPH (P>0.05, Table 2).
Table 2.
Comparison of laboratory indicators
| Indicators | Prostate carcinoma (n=126) | Benign prostatic hyperplasia (n=191) | t/Z | P |
|---|---|---|---|---|
| FBG (mmol/L) | 5.33 [4.88, 5.97] | 5.43 [4.66, 6.86] | -1.069 | 0.285 |
| HDL (mmol/L) | 1.13±0.30 | 1.22±0.32 | -2.451 | 0.015 |
| LDL (mmol/L) | 2.65±0.83 | 2.66±0.75 | -0.094 | 0.925 |
| VLDL (mmol/L) | 0.54 [0.38, 0.70] | 0.56 [0.36, 0.76] | -0.663 | 0.508 |
| TG (mmol/L) | 1.28 [0.89, 1.68] | 1.18 [0.68, 1.73] | 1.037 | 0.300 |
| PSA (ng/mL) | 23.32±9.85 | 14.03±4.70 | 9.871 | <0.001 |
| Neu (×109/L) | 5.18±1.99 | 4.49±1.40 | 3.383 | <0.001 |
| PLT (×109/L) | 194.37±43.48 | 194.24±43.55 | 0.026 | 0.979 |
| Mono (×109/L) | 0.53±0.15 | 0.45±0.14 | 4.609 | <0.001 |
| Lym (×109/L) | 1.31±0.27 | 1.48±0.23 | -5.552 | <0.001 |
| CRP (mg/L) | 2.90 [1.32, 4.39] | 2.12 [1.23, 3.18] | 3.254 | 0.001 |
| CK (U/L) | 84.78±33.27 | 80.74±28.92 | 1.114 | 0.266 |
| CK-MB (U/L) | 13.73±4.56 | 12.44±3.08 | 2.773 | 0.006 |
| ApoA1 (g/L) | 1.01±0.11 | 1.04±0.10 | -2.353 | 0.019 |
| NLR | 4.17±1.85 | 3.10±1.02 | 5.903 | <0.001 |
| MLR | 0.40 [0.32, 0.49] | 0.30 [0.22, 0.39] | 6.336 | <0.001 |
| PLR | 147.66 [119.23, 179.06] | 131.53 [108.25, 158.31] | 3.300 | <0.001 |
| SII | 729.21 [513.38, 1057.80] | 588.72 [435.48, 746.61] | 4.721 | <0.001 |
| SIRI | 2.04 [1.23, 2.89] | 1.35 [0.96, 1.82] | 6.162 | <0.001 |
| NAR | 5.16±2.09 | 4.32±1.34 | 4.020 | <0.001 |
Note: FBG, fasting blood glucose; HDL, high-density lipoprotein; LDL, low-density lipoprotein; VLDL, very low-density lipoprotein; TG, triglycerides; PSA, prostate-specific antigen; Neu, neutrophil count; Lym, lymphocyte count; Mono, monocyte count; PLT, platelet count; CRP, C-reactive protein; CK, creatine kinase; CKMB, creatine kinase-MB; ApoA1, apolipoprotein A1; NLR, neutrophil-to-lymphocyte ratio; MLR, monocyte-to-lymphocyte ratio; PLR, platelet-to-lymphocyte ratio; SII, systemic immune inflammation index; SIRI, system inflammation response index; NAR, neutrophil-albumin ratio.
Logistic regression analysis of independent diagnostic indicators
Multivariate logistic regression analysis was conducted to identify independent diagnostic indicators of PC. Several variables, including PLT (OR=1.216, 95% CI: 1.153-1.282, P<0.001), Mono (OR=0.226, 95% CI: 0.110-0.465, P<0.001), CRP (OR=63.736, 95% CI: 7.061-575.296, P<0.001), CK-MB (OR=1.310, 95% CI: 1.077-1.593, P=0.007), NLR (OR=1.085, 95% CI: 1.001-1.177, P=0.048), and PLR (OR=2.993, 95% CI: 1.839-4.869, P<0.001), were significantly associated with PC (P<0.05, Table 3). These results suggest that hematological and inflammatory markers, particularly CRP, PLR, and PLT, may play important roles in the early detection and diagnosis of PC. Notably, the high odds ratio for CRP and the significant associations with PLT and PLR indicate that these variables may serve as strong predictors, potentially offering diagnostic value beyond traditional PSA testing alone.
Table 3.
Logistic regression screening for independent diagnostic biomarkers
| Factors | β | Standard error | Chi-square value | P value | OR | 95% CI | |
|---|---|---|---|---|---|---|---|
|
| |||||||
| Lower bound | Upper bound | ||||||
| FBG (mmol/L) | -0.019 | 0.020 | 0.870 | 0.351 | 0.981 | 0.943 | 1.021 |
| HDL (mmol/L) | 0.036 | 0.051 | 0.506 | 0.477 | 1.037 | 0.939 | 1.145 |
| LDL (mmol/L) | -0.094 | 0.106 | 0.799 | 0.371 | 0.910 | 0.74 | 1.119 |
| VLDL (mmol/L) | -0.815 | 0.501 | 2.644 | 0.104 | 0.442 | 0.166 | 1.182 |
| TG (mmol/L) | -0.199 | 0.219 | 0.828 | 0.363 | 0.819 | 0.533 | 1.259 |
| PSA (ng/mL) | -0.866 | 0.619 | 1.956 | 0.162 | 0.421 | 0.125 | 1.416 |
| Neu (×109/L) | 0.345 | 0.248 | 1.929 | 0.165 | 1.412 | 0.868 | 2.296 |
| PLT (×109/L) | 0.196 | 0.027 | 51.967 | <0.001 | 1.216 | 1.153 | 1.282 |
| Mono (×109/L) | -1.486 | 0.368 | 16.341 | <0.001 | 0.226 | 0.110 | 0.465 |
| Lym (×109/L) | -0.007 | 0.016 | 0.183 | 0.669 | 0.993 | 0.962 | 1.025 |
| CRP (mg/L) | 4.155 | 1.123 | 13.699 | <0.001 | 63.736 | 7.061 | 575.296 |
| CK (U/L) | 1.641 | 2.713 | 0.366 | 0.545 | 5.162 | 0.025 | 1052.073 |
| CK-MB (U/L) | 0.270 | 0.100 | 7.306 | 0.007 | 1.310 | 1.077 | 1.593 |
| ApoA1 (g/L) | 0.004 | 0.006 | 0.546 | 0.460 | 1.004 | 0.993 | 1.015 |
| NLR | 0.082 | 0.041 | 3.897 | 0.048 | 1.085 | 1.001 | 1.177 |
| MLR | 3.743 | 4.337 | 0.745 | 0.388 | 42.234 | 0.009 | 207667.742 |
| PLR | 1.096 | 0.248 | 19.484 | <0.001 | 2.993 | 1.839 | 4.869 |
| SII | -4.844 | 5.877 | 0.679 | 0.410 | 0.008 | <0.001 | 792.227 |
| SIRI | 0.004 | 0.005 | 0.722 | 0.396 | 1.004 | 0.994 | 1.015 |
| NAR | <0.001 | 0.003 | 0.005 | 0.945 | 1.000 | 0.994 | 1.006 |
Note: FBG, fasting blood glucose; HDL, high-density lipoprotein; LDL, low-density lipoprotein; VLDL, very low-density lipoprotein; TG, triglycerides; PSA, prostate-specific antigen; Neu, neutrophil count; Lym, lymphocyte count; Mono, monocyte count; PLT, platelet count; CRP, C-reactive protein; CK, creatine kinase; CKMB, creatine kinase-MB; ApoA1, apolipoprotein A1; NLR, neutrophil-to-lymphocyte ratio; MLR, monocyte-to-lymphocyte ratio; PLR, platelet-to-lymphocyte ratio; SII, systemic immune inflammation index; SIRI, system inflammation response index; NAR, neutrophil-albumin ratio.
Screening of independent diagnostic markers for PC by LASSO regression
To further refine our diagnostic model, we used LASSO regression to screen for independent diagnostic markers of PC. LASSO regression analysis identified PSA level, NLR, MLR, and SII as significant independent predictors (Figure 2A, 2B). Unlike Logistic regression, which can be affected by multicollinearity among variables, LASSO regression effectively reduces the number of predictors by applying a penalty to their coefficients, thereby improving model interpretability and performance. The selection of these markers suggests that they represent the most robust indicators of PC, with PSA level remaining the strongest individual predictor.
Figure 2.

LASSO regression screening for diagnostic markers of prostate carcinoma. A. LASSO regression coefficient path diagrams: the horizontal axis represents the logarithmic value of the strength of regularization (Log (λ)), with smaller values indicating weaker regularization; the vertical axis represents the magnitude of the coefficients for each predictor variable. B. Cross-validation plot for the LASSO model: the horizontal axis represents the log(log (lambda)) values of the regularization parameters; the vertical axis represents the Binomial Deviance, the model’s prediction error, measured through cross-validation.
Comparison between LASSO and Logistic regression models
To evaluate the effectiveness of the LASSO model relative to that of the traditional logistic regression model, we compared their ROC curves. The AUC for the LASSO model was 0.850 (Figure 3A), compared to 0.792 (Figure 3B) for the logistic regression model, indicating superior diagnostic accuracy of the LASSO model. Additionally, the Delong test confirmed that the difference in the AUC between the two models was statistically significant (P=0.042), reinforcing the enhanced diagnostic value of the LASSO model. Therefore, by incorporating an optimized set of diagnostic markers, the LASSO model achieves superior discrimination between PC patients and BPH cases, establishing its reliability for early diagnosis.
Figure 3.

Comparison of Lasso and Logistic regression models. A. ROC Curve for LASSO Regression Model. B. ROC Curve for Logistic Regression Model. Note: LASSO: Least Absolute Shrinkage and Selection Operator, ROC: Receiver Operating Characteristic, AUC: Area Under the Curve, Logistic regression: A statistical method used for binary classification.
Determination of the optimal cutoff
To facilitate the clinical application of our diagnostic model, we calculated the optimal cut-off values for the four biomarkers identified by LASSO regression (PSA, NLR, MLR, and SII) for binary classification. This step is crucial for categorizing patients into distinct risk groups, which can then be used in a nomogram for more intuitive clinical interpretation (Figure 4A-D and Table 4). The nomogram visually represents the risk level of each marker, enabling clinicians to calculate an individual’s overall risk score and the probability of developing PC. This tool was designed to assist clinicians in making informed decisions regarding patient management and treatment decisions.
Figure 4.

ROC curves of PSA, NLR, MLR, and SII in the diagnosis of prostate carcinoma. A. ROC Curve for PSA. B. ROC Curve for NLR. C. ROC Curve for MLR. D. ROC Curve for SII. Note: ROC, Receiver Operating Characteristic; PSA, Prostate-Specific Antigen; NLR, Neutrophil-to-Lymphocyte Ratio; MLR, Monocyte-to-Lymphocyte Ratio; SII, Systemic Immune Inflammation Index.
Table 4.
ROC parameters for PSA, NLR, MLR, and SII
| Marker | AUC | 95% CI | Specificity | Sensitivity | Youden index | Cut off |
|---|---|---|---|---|---|---|
| PSA | 0.799 | 0.745-0.799 | 86.39% | 65.08% | 51.47% | 19.555 |
| NLR | 0.69 | 0.626-0.690 | 91.10% | 44.44% | 35.54% | 4.356 |
| MLR | 0.71 | 0.652-0.710 | 50.26% | 82.54% | 32.80% | 0.305 |
| SII | 0.657 | 0.592-0.657 | 72.25% | 57.14% | 29.39% | 689.051 |
Note: ROC, receiver operating characteristic; PSA, prostate-specific antigen; NLR, neutrophil-to-lymphocyte ratio; MLR, monocyte-to-lymphocyte ratio; SII, systemic immune inflammation index.
Construction and validation of the nomogram
The nomogram, constructed based on the four LASSO-selected indicators, demonstrated excellent diagnostic performance. In the nomogram, PSA level emerged as the most influential factor in the diagnosis of PC, followed by NLR and MLR, with SII having a comparatively smaller impact (Figure 5). To illustrate its application, we calculated the risk score for a randomly selected PC patient with a PSA level of 38.56 ng/mL, NLR of 5.02, MLR of 0.27, and SII of 1,101.25. The total risk score was 177 points, corresponding to a 78% probability of developing PC, exemplifying how a nomogram quantifies individual patient risk based on hematological and inflammatory profiles.
Figure 5.
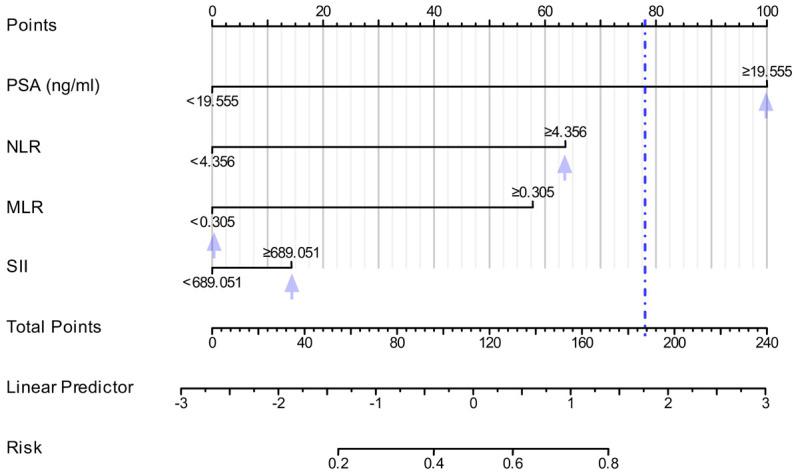
Clinical application of the diagnostic model. Nomogram for prostate carcinoma diagnosis: This figure presents a nomogram developed using the LASSO regression model that integrates four key diagnostic markers: PSA, NLR, MLR, and SII. Note: PSA, Prostate-Specific Antigen; NLR, Neutrophil-to-Lymphocyte Ratio; MLR, Monocyte-to-Lymphocyte Ratio; SII, Systemic Immune Inflammation Index.
To validate the performance of the model, risk scores were computed for patients in the validation group and evaluated using DCA, calibration curves, and ROC curves. The DCA curve showed a high net benefit rate, indicating strong clinical applicability (Figure 6A). The calibration curve generated using 1000 bootstrap samples demonstrated that the predicted probabilities were closely aligned with the actual outcomes, suggesting good calibration and stable model performance (Figure 6B). Moreover, the ROC curve analysis confirmed the model’s high diagnostic accuracy, with an AUC of 0.860 (95% CI: 0.820-0.901), further validating its clinical utility (Figure 6C).
Figure 6.

Performance evaluation of the nomogram. A. DCA Curve. B. Calibration Curve. C. ROC Curve. Note: DCA: Decision Curve Analysis, ROC: Receiver Operating Characteristic, AUC: Area Under the Curve.
External validation of the model
We validated the model using external data, by comparing the four characteristic indicators between the training and validation groups, finding no statistical difference in PSA, NLR, MLR and SII (P>0.05, Table S1). External validation was then performed on an independent cohort (30% of patients, n=95). The DCA curve showed a consistently high net benefit rate, confirming the model’s robust clinical applicability in independent patient populations (Figure 7A). The calibration curve analysis revealed close alignment between predicted probabilities and observed outcomes, indicating good calibration and stable model performance on new data (Figure 7B). Moreover, ROC analysis confirmed sustained diagnostic accuracy, with an AUC of 0.826 (95% CI: 0.734-0.917), strongly supporting the model’s generalizability and potential value for broad clinical implementation (Figure 7C).
Figure 7.

External validation of the diagnostic model. A. DCA Curve. B. Calibration Curve. C. ROC Curve. Note: DCA: Decision Curve Analysis, ROC: Receiver Operating Characteristic, AUC: Area Under the Curve.
Discussion
PC is prevalent among elderly men in China and has maintained a persistently high mortality rate in recent years [15,16]. Clinically, prostate biopsy remains the standard diagnostic method, while PSA serves as a key screening indicator, typically using a threshold of >4 ng/ml to recommend biopsy [17]. However, PSA levels >4 ng/ml have a low positive predictive value of only 25%, and up to 20% of patients require multiple biopsies to confirm diagnosis. Furthermore, biopsy, as an invasive procedure, carries risks such as bleeding and infection, underscoring the urgent need for new auxiliary indices to reduce unnecessary biopsies [18]. Although imaging techniques and biomolecular markers have shown promise in improving diagnostic accuracy, their high cost and limited accessibility hinder widespread use.
In this study, we observed that levels of PSA, Neu, Mono, CRP, CK-MB, NLR, MLR, PLR, SII, SIRI, and NAR were significantly higher in PC group than in BPH group, while Lym and ApoA1 levels were notably lower. Logistic regression analysis identified PSA, Neu, Mono, CRP, NLR, NAR, and CK-MB as key diagnostic indicators for PC. Interestingly, atherosclerosis-related factors, such as HDL, showed no significant differences between PC and BPH groups and did not enhance diagnostic accuracy when combined with PSA. This likely reflects the closer association of HDL and other lipid markers with cardiovascular conditions rather than PC pathogenesis, so these factors were not further explored as potential diagnostic indicators. Chronic inflammation, driven by factors such as infection and hormonal changes, plays a significant role in cancer progression [19-22]. Neutrophils and monocytes, as early responders to inflammation, promote tumor growth and metastasis by secreting cytokines and growth factors [23,24]. Elevated CRP levels, indicative of systemic inflammation, correlate with PC severity and prognosis [25-27]. Inflammatory ratios such as NLR, MLR, and SII reflect the body’s inflammatory status and are critical for assessing tumor aggressiveness and guiding treatment decisions. Integrating these markers with traditional methods can enhance diagnostic accuracy and reduce reliance on invasive procedures.
Using logistic regression, we identified diagnostic markers for PC. Although logistic regression proves useful in determining significant diagnostic indicators, its effectiveness is limited when handling datasets with high multicollinearity. In such cases, logistic regression may struggle to accurately identify the most influential variables, which can reduce predictive accuracy and model interpretability [28]. To address these limitations and optimize feature selection, we employed LASSO regression - a technique that facilitates variable selection and complexity control by penalizing coefficients and forcing some to exactly zero [29]. This approach is particularly effective when dealing with numerous parameters and potential collinearity, as it streamlines the feature set, enhances model interpretability, and mitigates overfitting risks. To test our hypothesis, we developed a predictive model using LASSO regression alone. The results identified PSA, NLR, MLR, and SII as potential diagnostic markers for PC, with all except PSA differing from those selected by logistic regression. This variation may stem from differences in how logistic regression and LASSO regression handle data collinearity and variable selection, resulting in distinct marker selections. For model comparison, we generated ROC curves and found, via the Delong test, that the AUC of the logistic regression model was statistically lower than that of the LASSO regression model. Thus, LASSO regression demonstrated superior predictive accuracy and model performance in screening diagnostic markers for PC, outperforming logistic regression.
The combination of PSA, NLR, MLR, and SII as diagnostic markers is effective due to their complementary biological and clinical roles in capturing distinct aspects of PC pathophysiology. PSA, a protein secreted by prostate epithelial cells, is elevated in PC, reflecting tumor cell proliferation, though its specificity is limited [17]. NLR, the ratio of neutrophils to lymphocytes, captures the balance between tumor-promoting inflammation (neutrophils secrete pro-angiogenic factors) and suppressed anti-tumor immunity (reduced lymphocytes). Elevated NLR in PC indicates inflammation-driven tumor progression [23]. MLR, reflecting the ratio of monocytes (precursors to tumor-associated macrophages) to lymphocytes, highlights immune suppression in the tumor microenvironment. As monocytes secrete immunosuppressive factors that facilitate tumor immune evasion, elevated MLR in PC suggests an immunosuppressive state [24]. SII integrates neutrophils, platelets, and lymphocytes, providing a composite measure of inflammation, thrombosis, and immune status. Elevated SII in PC correlates with tumor aggressiveness and poor prognosis [14]. By targeting tumor PSA, inflammatory microenvironment (NLR), immune suppression (MLR), and systemic inflammation-thrombosis interplay (SII), this four-marker panel achieves greater sensitivity and specificity than PSA alone (AUC=0.799), with the combined model reaching an AUC of 0.860. This improvement reduces false positives, thereby minimizing unnecessary biopsies. Compared to studies like Yazdani et al. [30] (PSA and PCA3, AUC=0.95), Zhang et al. [31] (miR-146a-5p, miR-24-3p, miR-93-5p, AUC=0.819-0.831), Dai et al. [32] (urine EpCAM-CD9-positive exosomes with PSA, AUC=0.952), and Leyten et al. [33] (urine three-gene panel HOXC6, TDRD1, DLX1, AUC=0.77-0.81), our markers are more accessible, relying solely on routine blood tests without specialized equipment or complex procedures. PSA, as an established screening index, benefits from mature detection methods, while NLR, MLR, and SII can be derived from standard hematological parameters. This makes our approach highly feasible in resource-constrained settings and significantly enhances accessibility to PC screening.
A nomogram serves as a visual tool to present prediction model outputs, enabling nonprofessionals to understand and apply complex statistical models. In our model, data from a randomly selected PC patient were analyzed, revealing a 78% probability of PC. We further validated the model’s clinical significance, accuracy, and generalizability using DCA, calibration curves, and ROC curves. The model demonstrated a low AIC value, indicating good fit and robust predictive performance. Calibration curve analysis showed no multicollinearity, significant likelihood ratio test results, a high concordance index, and strong agreement between predicted and observed outcomes, confirming the model’s reliability and discrimination. The ROC curve yielded an AUC of 0.860 for the nomogram, highlighting its high clinical diagnostic value. External validation using 30% of the total cohort (n=95) further reinforced the model’s reliability, maintaining excellent performance with an AUC of 0.826 (95% CI: 0.734-0.917), supporting the model’s stability and clinical applicability. Its consistent performance across populations suggests strong generalizability, making this hematological marker-based model a promising tool for broad clinical implementation.
This study has several limitations, including a small sample size, retrospective design, single-center data, and insufficient control for potential confounders. Future studies should address these issues by enrolling more participants, adopting multicenter designs to improve generalizability, and using prospective methodologies to reduce bias and enhance reliability. Furthermore, applying advanced statistical methods to adjust for potential confounders will help ensure the validity of the findings. Further external validation is also necessary to assess the model’s applicability across diverse populations and clinical settings, thereby providing more accurate and reliable guidance for PC diagnosis and treatment.
Conclusion
This study establishes PSA, NLR, MLR, and SII as effective diagnostic markers for PC. In addition, the accuracy and predictive performance of the diagnostic model proposed could be optimized using LASSO regression. Despite the limitations of the sample size and research design, this study provides promising biomarkers and robust statistical approaches for early PC diagnosis. The findings shed light on the directions for future research aimed at improving the generalizability and precision of the model.
Acknowledgements
This study was supported by grants from the National Natural Science Foundation of China (82160577, 82073762, 82260595), Natural Science Foundation of Guangdong Province (2023A1515030091, 2021B1515120053); The Program for Science and Technology Plan Medical and Health Project of Zhuhai (20191210E030075). The Program for Science and Technology Plan of Guangzhou (2023A03J0405, 202102010071). Guangdong Medical Science and Technology Research Fund (A2023205), Training Program for Academic and Technical Leaders of Major Disciplines in Jiangxi Province (20204BCJL23051) and Science and Technology Project of Health and Family Planning Commission of Jiangxi Province (202131021).
Disclosure of conflict of interest
None.
Supporting Information
References
- 1.Miller KD, Nogueira L, Devasia T, Mariotto AB, Yabroff KR, Jemal A, Kramer J, Siegel RL. Cancer treatment and survivorship statistics, 2022. CA Cancer J Clin. 2022;72:409–436. doi: 10.3322/caac.21731. [DOI] [PubMed] [Google Scholar]
- 2.Bray F, Laversanne M, Sung H, Ferlay J, Siegel RL, Soerjomataram I, Jemal A. Global cancer statistics 2022: GLOBOCAN estimates of incidence and mortality worldwide for 36 cancers in 185 countries. CA Cancer J Clin. 2024;74:229–263. doi: 10.3322/caac.21834. [DOI] [PubMed] [Google Scholar]
- 3.Zhu Y, Mo M, Wei Y, Wu J, Pan J, Freedland SJ, Zheng Y, Ye D. Epidemiology and genomics of prostate cancer in Asian men. Nat Rev Urol. 2021;18:282–301. doi: 10.1038/s41585-021-00442-8. [DOI] [PubMed] [Google Scholar]
- 4.Kachuri L, Hoffmann TJ, Jiang Y, Berndt SI, Shelley JP, Schaffer KR, Machiela MJ, Freedman ND, Huang WY, Li SA, Easterlin R, Goodman PJ, Till C, Thompson I, Lilja H, Van Den Eeden SK, Chanock SJ, Haiman CA, Conti DV, Klein RJ, Mosley JD, Graff RE, Witte JS. Genetically adjusted PSA levels for prostate cancer screening. Nat Med. 2023;29:1412–1423. doi: 10.1038/s41591-023-02277-9. [DOI] [PMC free article] [PubMed] [Google Scholar]
- 5.Peng Y, Wei C, Li Y, Zhao F, Liu Y, Jiang T, Chen Z, Zheng J, Fu J, Wang P, Shen W. Optimal PSA density threshold for prostate biopsy in benign prostatic obstruction patients with elevated PSA levels but negative MRI findings. BMC Urol. 2025;25:42. doi: 10.1186/s12894-025-01719-5. [DOI] [PMC free article] [PubMed] [Google Scholar]
- 6.Wala J, Nguyen P, Pomerantz M. Early treatment intensification in metastatic hormone-sensitive prostate cancer. J. Clin. Oncol. 2023;41:3584–3590. doi: 10.1200/JCO.23.00723. [DOI] [PMC free article] [PubMed] [Google Scholar]
- 7.Hung SC, Chang LW, Hsiao TH, Wei CY, Wang SS, Li JR, Chen IC. Predictive value of polygenic risk score for prostate cancer incidence and prognosis in the Han Chinese. Sci Rep. 2024;14:20453. doi: 10.1038/s41598-024-71544-7. [DOI] [PMC free article] [PubMed] [Google Scholar]
- 8.Hugosson J, Månsson M, Wallström J, Axcrona U, Carlsson SV, Egevad L, Geterud K, Khatami A, Kohestani K, Pihl CG, Socratous A, Stranne J, Godtman RA, Hellström M GÖTEBORG-2 Trial Investigators. Prostate cancer screening with PSA and MRI followed by targeted biopsy only. N Engl J Med. 2022;387:2126–2137. doi: 10.1056/NEJMoa2209454. [DOI] [PMC free article] [PubMed] [Google Scholar]
- 9.Kachuri L, Hoffmann TJ, Jiang Y, Berndt SI, Shelley JP, Schaffer KR, Machiela MJ, Freedman ND, Huang WY, Li SA, Easterlin R, Goodman PJ, Till C, Thompson I, Lilja H, Van Den Eeden SK, Chanock SJ, Haiman CA, Conti DV, Klein RJ, Mosley JD, Graff RE, Witte JS. Genetically adjusted PSA levels for prostate cancer screening. Nat Med. 2023;29:1412–1423. doi: 10.1038/s41591-023-02277-9. [DOI] [PMC free article] [PubMed] [Google Scholar]
- 10.Zhang GM, Gu YY. Diagnostic value of Procalcitonin, C-reactive protein-to-lymphocyte ratio (CLR), C-reactive protein and neutrophil-to-lymphocyte ratio (NLR) for predicting patients with Bacteraemia in the intensive care unit. J Crit Care. 2024;81:154538. doi: 10.1016/j.jcrc.2024.154538. [DOI] [PubMed] [Google Scholar]
- 11.Park SY, Ju S, Lee J, Kim HR, Sub Y, Park DJ, Park S, Kwon D, Kang HG, Shin JE, Kim DH, Paik JE, Cho SC, Shim H, Kim YJ, Guan KL, Chun KH, Choi J, Ha SJ, Gee HY, Roe JS, Lee HW, Park SY, Park HW. Noncanonical role of Golgi-associated macrophage TAZ in chronic inflammation and tumorigenesis. Sci Adv. 2025;11:eadq2395. doi: 10.1126/sciadv.adq2395. [DOI] [PMC free article] [PubMed] [Google Scholar]
- 12.Zhao T. Prognostic assessment of C-reactive protein and neutrophil to lymphocyte ratio in patients with non-small cell lung cancer. Wien Klin Wochenschr. 2022;134:705–711. doi: 10.1007/s00508-022-02049-4. [DOI] [PubMed] [Google Scholar]
- 13.Wang W, Tong Y, Sun S, Tan Y, Shan Z, Sun F, Jiang C, Zhu Y, Zhang J. Predictive value of NLR and PLR in response to preoperative chemotherapy and prognosis in locally advanced gastric cancer. Front Oncol. 2022;12:936206. doi: 10.3389/fonc.2022.936206. [DOI] [PMC free article] [PubMed] [Google Scholar]
- 14.Ozturk AE, Komurcuoglu B, Karakurt GK, Ozturk O. Prognostic value of diffuse cancer inflammation index (ALI), serum neutrophil/lymphocyte (NLR) and platelet/lymphocyte (PLR) in advanced-stage lung cancer. J Cancer Res Ther. 2024;20:893–897. doi: 10.4103/jcrt.JCRT_1762_20. [DOI] [PubMed] [Google Scholar]
- 15.He J, Chen WQ, Li N, Cao W, Ye DW, Ma JH, Xing NZ, Peng J, Tian JH China Prostate Cancer Screening and Early Diagnosis and Early Treatment Guidelines Development Expert Group; Working Group on Formulation of Guidelines for Prostate Cancer Screening, Early Diagnosis and Early Treatment in China. China guideline for the screening and early detection of prostate cancer (2022, Beijing) Zhonghua Zhong Liu Za Zhi. 2022;44:29–53. doi: 10.3760/cma.j.cn112152-20211226-00975. [DOI] [PubMed] [Google Scholar]
- 16.Lu Z, Chen Y, Liu D, Jiao X, Liu C, Wang Y, Zhang Z, Jia K, Gong J, Yang Z, Shen L. The landscape of cancer research and cancer care in China. Nat Med. 2023;29:3022–3032. doi: 10.1038/s41591-023-02655-3. [DOI] [PubMed] [Google Scholar]
- 17.Rubin R. Using 2 prostate biopsy techniques optimizes cancer diagnosis. JAMA. 2020;323:1542. doi: 10.1001/jama.2020.4566. [DOI] [PubMed] [Google Scholar]
- 18.Lu Z, Chen Y, Liu D, Jiao X, Liu C, Wang Y, Zhang Z, Jia K, Gong J, Yang Z, Shen L. The landscape of cancer research and cancer care in China. Nat Med. 2023;29:3022–3032. doi: 10.1038/s41591-023-02655-3. [DOI] [PubMed] [Google Scholar]
- 19.Chan JM, Zaidi S, Love JR, Zhao JL, Setty M, Wadosky KM, Gopalan A, Choo ZN, Persad S, Choi J, LaClair J, Lawrence KE, Chaudhary O, Xu T, Masilionis I, Linkov I, Wang S, Lee C, Barlas A, Morris MJ, Mazutis L, Chaligne R, Chen Y, Goodrich DW, Karthaus WR, Pe’er D, Sawyers CL. Lineage plasticity in prostate cancer depends on JAK/STAT inflammatory signaling. Science. 2022;377:1180–1191. doi: 10.1126/science.abn0478. [DOI] [PMC free article] [PubMed] [Google Scholar]
- 20.Burns JA, Weiner AB, Catalona WJ, Li EV, Schaeffer EM, Hanauer SB, Strong S, Burns J, Hussain MHA, Kundu SD. Inflammatory bowel disease and the risk of prostate cancer. Eur Urol. 2019;75:846–852. doi: 10.1016/j.eururo.2018.11.039. [DOI] [PMC free article] [PubMed] [Google Scholar]
- 21.Hatano K, Fujita K, Nonomura N. Application of anti-inflammatory agents in prostate cancer. J Clin Med. 2020;9:2680. doi: 10.3390/jcm9082680. [DOI] [PMC free article] [PubMed] [Google Scholar]
- 22.Lozano-Lorca M, Salcedo-Bellido I, Olmedo-Requena R, Castaño-Vinyals G, Amiano P, Shivappa N, Hébert JR, Pérez-Gómez B, Gracia-Lavedan E, Gómez-Acebo I, Molina-Barceló A, Barrios-Rodríguez R, Alguacil J, Fernández-Tardón G, Aragonés N, Dierssen-Sotos T, Romaguera D, Pollán M, Kogevinas M, Jiménez-Moleón JJ MCC-Spain collaborate group. Dietary inflammatory index and prostate cancer risk: MCC-Spain study. Prostate Cancer Prostatic Dis. 2022;25:568–575. doi: 10.1038/s41391-022-00532-7. [DOI] [PubMed] [Google Scholar]
- 23.Nepal SP, Nakasato T, Fukagai T, Ogawa Y, Nakagami Y, Shichijo T, Morita J, Maeda Y, Oshinomi K, Unoki T, Noguchi T, Inoue T, Kato R, Amano S, Mizunuma M, Kurokawa M, Tsunokawa Y, Yasuda S. Neutrophil-to-lymphocyte and platelet-to-lymphocyte ratios alone or combined with prostate-specific antigen for the diagnosis of prostate cancer and clinically significant prostate cancer. Asian J Urol. 2023;10:158–165. doi: 10.1016/j.ajur.2022.02.007. [DOI] [PMC free article] [PubMed] [Google Scholar]
- 24.Wang Y, Dong X, Qu Z, Peng K, Sun X, Chen R. Correlation between peripheral blood neutrophil-lymphocyte ratio and CD34 expression in prostate cancer. BMC Cancer. 2020;20:900. doi: 10.1186/s12885-020-07382-3. [DOI] [PMC free article] [PubMed] [Google Scholar]
- 25.McFarlane AJ, Fercoq F, Coffelt SB, Carlin LM. Neutrophil dynamics in the tumor microenvironment. J Clin Invest. 2021;131:e143759. doi: 10.1172/JCI143759. [DOI] [PMC free article] [PubMed] [Google Scholar]
- 26.Ilktac A, Kalkan S, Caliskan S. C-reactive protein and procalcitonin levels in prostate cancer. Int J Clin Pract. 2021;75:e13935. doi: 10.1111/ijcp.13935. [DOI] [PubMed] [Google Scholar]
- 27.Lorigo J, Tavares Silva E, Pedroso Lima J, Quaresma V, Pedrosa R, Figueiredo A. C reactive protein/Albumin ratio as predictor of prognosis in castration resistant metastatic prostate cancer. Arch Ital Urol Androl. 2023;95:11242. doi: 10.4081/aiua.2023.11242. [DOI] [PubMed] [Google Scholar]
- 28.Yan Y, Gong H, Hu J, Wu D, Zheng Z, Wang L, Lei C. Perioperative parameters-based prediction model for acute kidney injury in Chinese population following valvular surgery. Front Cardiovasc Med. 2023;10:1094997. doi: 10.3389/fcvm.2023.1094997. [DOI] [PMC free article] [PubMed] [Google Scholar]
- 29.Chen R, Zhu L, Zhang Y, Cui D, Chen R, Guo H, Peng L, Xiao C. Predicting the unpredictable: a robust nomogram for predicting recurrence in patients with ampullary carcinoma. BMC Cancer. 2024;24:212. doi: 10.1186/s12885-024-11960-0. [DOI] [PMC free article] [PubMed] [Google Scholar]
- 30.Yazdani M, Saberi N, Baradaran A, Mohajeri Z. Diagnostic value of total serum/free prostate specific antigen and prostate cancer antigen-3 levels in prostate cancer. Am J Clin Exp Urol. 2023;11:414–419. [PMC free article] [PubMed] [Google Scholar]
- 31.Zhang S, Liu C, Zou X, Geng X, Zhou X, Fan X, Zhu D, Zhang H, Zhu W. MicroRNA panel in serum reveals novel diagnostic biomarkers for prostate cancer. PeerJ. 2021;9:e11441. doi: 10.7717/peerj.11441. [DOI] [PMC free article] [PubMed] [Google Scholar]
- 32.Dai Y, Wang Y, Cao Y, Yu P, Zhang L, Liu Z, Ping Y, Wang D, Zhang G, Sang Y, Wang X, Tao Z. A multivariate diagnostic model based on urinary EpCAM-CD9-Positive extracellular vesicles for prostate cancer diagnosis. Front Oncol. 2021;11:777684. doi: 10.3389/fonc.2021.777684. [DOI] [PMC free article] [PubMed] [Google Scholar]
- 33.Leyten GH, Hessels D, Smit FP, Jannink SA, de Jong H, Melchers WJ, Cornel EB, de Reijke TM, Vergunst H, Kil P, Knipscheer BC, Hulsbergen-van de Kaa CA, Mulders PF, van Oort IM, Schalken JA. Identification of a candidate gene panel for the early diagnosis of prostate cancer. Clin Cancer Res. 2015;21:3061–3070. doi: 10.1158/1078-0432.CCR-14-3334. [DOI] [PubMed] [Google Scholar]
Associated Data
This section collects any data citations, data availability statements, or supplementary materials included in this article.