Abstract
GTP-hydrolyzing G proteins are molecular switches that play a critical role in cell signaling processes. Here we use molecular dynamics simulations to show that Ras, a monomeric G protein, can generate mechanical force upon hydrolysis. The generated force levels are comparable to those produced by ATP-hydrolyzing motor proteins, consistent with the structural similarities of the catalytic region of motor proteins and G proteins. The force transduction mechanism is based on an irreversible structural change, produced by the hydrolysis, which triggers thermal switching between force-generating substates through changes in the configurational space of the protein.
Interest in nucleotide-binding proteins able to use free energy released by nucleotide hydrolysis to drive uphill biochemical processes has increased dramatically in recent years. Active proteins of this type play a central role in a wide spectrum of cellular processes, such as signal transduction, membrane and organelle transport, DNA replication, and muscle contraction (1). Highly sensitive experimental methods have been developed that allow quantitative dynamical studies of active proteins at the single-molecule level (2). Two classes received particular attention: ATP-hydrolyzing motor proteins (3)—such as myosin and kinesin—that directly transform hydrolysis energy into mechanical work, and GTP-hydrolyzing G proteins that usually are part of some signal-transduction network (4). Single-molecule studies of motor proteins report that they can generate mechanical forces in the 10-pN range, depending on the applied load (4). A variety of force-transduction mechanisms have been proposed for the motor proteins. In the simplest view, hereafter referred to as the “stress-relaxation” model (5), motor proteins are in a tense, elastically stretched state before hydrolysis. ATP hydrolysis then produces a structural transition that allows release of the stored elastic energy, comparable to the opening of a “latch.” The released elastic energy can be used to perform work.
The net action of G protein cyclical activity is to produce chemical work. They lack the “lever arm” that produces the large-amplitude displacements of motor proteins. However, it has been well established (5) that there are close similarities in the structure of the catalytic site (or “motor unit”) of the motor and G proteins. In both cases, the motor unit consists of three motifs: the switch I, switch II, and P-loop regions, connected to nearby β-strands. This structural similarity has been argued to be caused by a shared nucleotide-binding ancestor (6). During the cyclical separation of the protein from its binding partners, hydrolysis of the nucleotide—itself stimulated by ligand binding—produces in both families a conformational change in the switch II region that is transmitted to different parts of the protein, leading to ligand-unbinding. During an unbinding event, part of the hydrolysis energy must be used to overcome attractive protein–ligand interactions, which can be viewed as a form of chemo–mechanical force transduction common to motor proteins and G proteins.
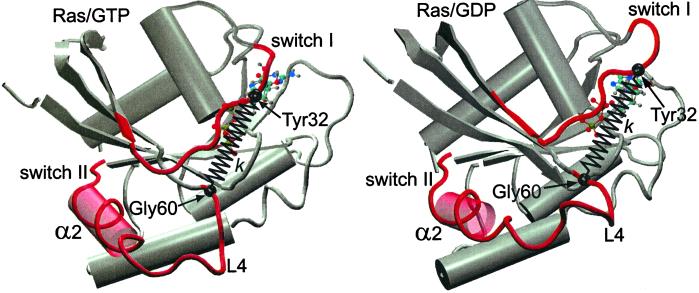
The aim of this paper is to use molecular dynamics (MD) simulation techniques to study the nature and strength of the protein-ligand “disjoining force” that must be at work during a protein-ligand unbinding event, and to test the stress-relaxation model in this context. Because MD simulation studies are limited to relatively small systems (≤106 atoms) and short simulation times (≤10−8 s), we will focus on the H-Ras protein, the smallest known G protein. H-Ras, one of the three known human Ras proteins, has 189 residues and a mass of 21 kDa. It cycles between two states: an inactive GDP-bound state (Fig. 1 Left) and an enzymatically active GTP-bound state (Fig. 1 Right). Binding of Ras/GTP to GTPase-activating proteins (GAPs) triggers hydrolysis, whereas binding of Ras/GDP to guanine nucleotide exchange factors (GEFs) triggers GDP/GTP exchange (6). For the truncated H-Ras protein (hereafter referred to as Ras), which contains 166 residues without the C terminus, high-resolution crystallographic structures are available for both the free active (7) and inactive (8) forms, as well as for the Ras/GAP-334 ligand complex (9). As shown in Fig. 1, the structural differences between the active and inactive states are mainly localized to the switch I region (residues 30–38) and the switch II region (residues 60–76), the latter consisting of the α2 helix and the mobile L4 loop (residues 60–66). Mutagenic and structural studies show that these two switch regions play an important role in the binding of Ras to its ligand partner GAP (3). In the Ras/GTP state, firm Ras–GAP attachment relies on electrostatic attraction between the amino acid side chains of the switch regions of Ras and the central helices of GAP (3) that are distributed over the structured binding interface. The structural transformation of switch II rearranges this binding interface, and is the likely agent of the disjoining force. NMR studies show that in the GDP-bound state—but not in the GTP-bound state—the L4 loop section of switch II, directly located at the Ras/GAP interface, exhibits dramatic thermal mobility on the nanosecond time scale (8), which indicates that the unbinding force may have an entropic component (5).
Figure 1.
Schematic representation of the structure of GTP-bound (Left) and GDP-bound (Right) Ras protein (generated by the molecular graphics program vmd (22). The major conformational difference between the two structures involves the switch II region composed of the α2 helix and the L4 loop. In the case of Ras/GDP, the final turn of the α2 helix in contact with the L4 loop is unwound, whereas L4 is highly disordered. To gauge the force-generating ability of Ras, a harmonic spring, of stiffness constant k, is inserted between the COM of residues Gly-60 and Tyr-32 (see text).
Previous MD simulations of Ras/GDP (10–12) were performed on a time scale of the order of 0.5 ns, with good agreement between the computed root mean-square deviations (RMSDs) of the Cα atoms and those obtained by structural studies. The high mobility of the switch II region in Ras/GDP was clearly visible (13). However, the crucial spontaneous evolution from the initial, tense conformation of Ras/GDP, obtained by removing the γ phosphate from Ras/GTP, to the relaxed state of Ras/GDP was not observed, at least for simulation times up to a few hundred picoseconds. The two states of Ras/GDP, which we will denote henceforth as the T (“tense”) and R (“relaxed”) states, respectively, appeared to be distinct, stable isomers. Recall that according to the second law of thermodynamics, for an isothermal and isobaric system to be able to perform work on its environment, it must undergo a spontaneous, irreversible transformation accompanied by a reduction of its Gibbs Free energy. In the simulation studies (10–12), a T-to-R transition could only be artificially forced by means of a time-dependent holonomic constraint, and it was found that a large energy barrier—of about 60 kcal/mol—separated the two isomers (10).
We performed a series of 2- to 3-ns MD simulations—with no holonomic constraints—to search for a spontaneous T-to-R transition. The structure of the initial T state was determined from the crystallographic structure of Ras/GDP·AlF3 (a nonhydrolyzing analog of Ras/GTP) and GAP-334 complex obtained by Scheffzek et al. (9). After removing GAP-334, the starting conformations of Ras/GDP and Ras/GTP were obtained by either removing AlF3 (Ras/GDP), or replacing it with a phosphate group (Ras/GTP). The resulting structures were first energy minimized with the x-plor program (14) using the Powell algorithm. The systems were solvated in a 60-Å box of water molecules (previously equilibrated under normal pressure at room temperature) with periodic boundary conditions, involving 5,601 water molecules. The initial equilibration of the systems at room temperature (300 K) and normal pressure [1 atmosphere (atm); 1 atm = 101.3 kPa] was preformed with the namd program (14), using the CHARMM22 force field (15). The resulting states represented the starting point of 2- to 3-ns MD simulations using the namd (16). The simulations were carried out at fixed temperature (300 K) and pressure (1 atm) (the so-called NPT ensemble) using the Langevin piston method (17). Longer-range interactions (Coulomb and van der Waals) were cut off at 1.2 nm, and no counterions were added to the systems. The simulated Ras/GDP system consisted of a total of 19,463 atoms.
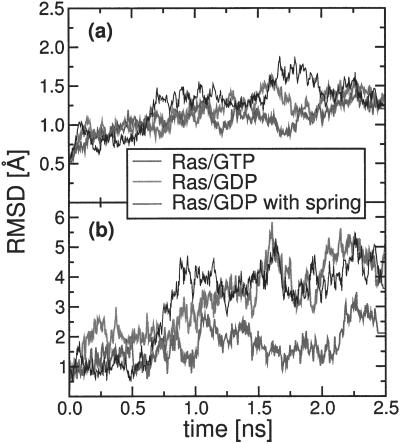
The initial T state structure of Ras/GDP survived for simulation times between 0.5 and 1 ns. Decay of the T structure was signaled by the unwinding of one turn of the α2 helix of switch II, as shown in Fig. 1. The unwinding event was spontaneous and irreversible; the helix never rewound on any of our simulation runs. The L4 loop, which is connected to the α2 helix, then started to develop large-amplitude thermal fluctuations. This growth of thermal disorder after hydrolysis was highly localized. Fig. 2a compares the development of the total RMSD for Ras/GDP (gray curve) of all 166 Ras Cα atoms as a function of time with the corresponding RMSD of Ras/GTP (black curve), both computed (after least-square alignment) with respect to the t = 0 initial structure. After an initial rise, this total RMSD levels off in both cases, with no particular difference between Ras/GDP and Ras/GTP. The low value (<2 Å) of the RMSD of the Cα atoms indicates good overall stability of the protein. However, the time evolution of the RMSD of the Cα atoms of the L4 loop of switch II (Fig. 2b) shows noticeable differences between Ras/GDP and Ras/GTP. Although for Ras/GTP the L4 RMSD (black curve) levels off at a value similar to the total RMSD, for Ras/GDP the L4 RMSD (gray curve) continues to grow for the entire duration of the simulation, eventually reaching twice the value of the RMSD of the other Cα atoms.
Figure 2.
Time dependence of the root mean square deviation (RMSD), measured with respect to the t = 0 structure, for all Cα atoms (a), the Cα atoms of the L4 loop of switch II (b), for Ras/GTP (black curve), Ras/GDP (gray curve), and Ras/GDP with harmonic spring (thin black curve). The spring constant k = 0.1 kcal/mol⋅Å2.
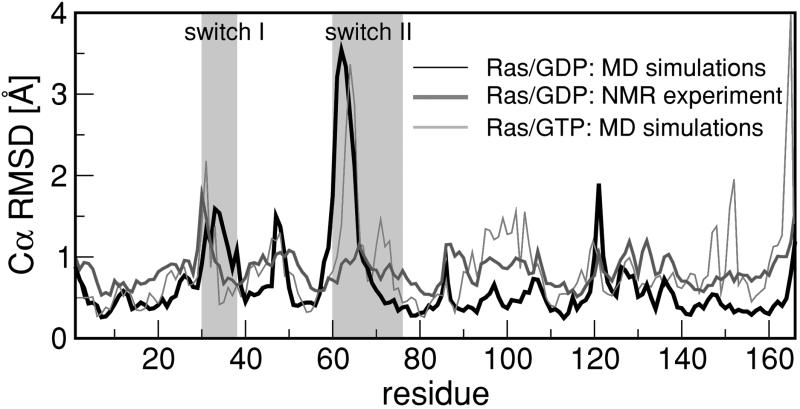
To check whether this sequence of events can be identified with the initial phase of a spontaneous T-to-R transformation, we plotted the separate RMSDs of all 166 Ras Cα atoms averaged over the final 148 ps of a 2-ns run, after least-square aligning the structures between different timeframes (excluding the mobile switch regions). In Fig. 3, the results (thin black curve) are compared with the corresponding RMSDs obtained by Kraulis et al. (18) from solution NMR experiments (black curve) on Ras/GDP on nanosecond time scales. The relevant switch II and I regions are indicated by the shaded areas. There is good agreement for the main peak positions and amplitudes, except for the peak around residue 100. The RMSDs of the switch II Cα atoms of Ras/GTP (gray curve), averaged over the last 210 ps of a 2-ns MD trajectory, are much smaller. Because the equilibration time of the L4 loop region of Ras/GDP exceeds the simulation time of 2.5 ns, the simulation probably underestimates the true degree of “melting” of the switch II region. This finding is consistent with the fact that the RMSDs of the L4 Cα atoms obtained from x-ray crystallographic studies of free Ras/GDP are about twice as large as found in the present study. In addition, the x-ray structure of Ras/GDP involves a significant rotation of the axis of the α2 helix (as compared with Ras/GTP) that was not observed in our MD simulation.
Figure 3.
RMSD values of individual Ras Cα atoms. The black curve indicates results obtained from averaging over 40 NMR structures of Ras/GDP by Kraulis et al. (18). Thin black (gray) curves indicate results obtained from averaging over the last 74 (105) frames of a 2-ns MD trajectory of Ras/GDP (Ras/GTP) with a 2-ps frame separation. The shaded areas indicate the highly mobile switch I and II regions.
With these limitations, we obtained a simulation model of an irreversible T-to-R structural transformation, produced by a hydrolysis reaction. This model can now be used as a computational platform for a study of the disjoining force. To measure the disjoining force, we repeated the Ras/GDP simulations in the presence of its ligand protein (GAP-334). However, protein–protein disjoining requires water molecules to enter into the gap opening between Ras and GAP; this was found to introduce prohibitively long time scales, beyond the reach of our MD simulations. To avoid this difficulty, we measured the disjoining force instead by modeling the ligand as a harmonic spring, of variable stiffness constant k, between the center-of-mass (COM) positions of the side chains of two residues Gly-60 and Ty32 (see Fig. 1). The mutual force exerted between Ras and the spring is thus F = k (X − a), where X is the distance between the COMs of the Gly-60 and Ty32 side chains, and a is the t = 0 value of X. The value of the spring constant k was chosen to be of the order of 0.1–1 kcal/mol⋅Å2 (for spring constants in this range, a 10-pN harmonic force corresponds to a spring displacement X − a in the Å range).
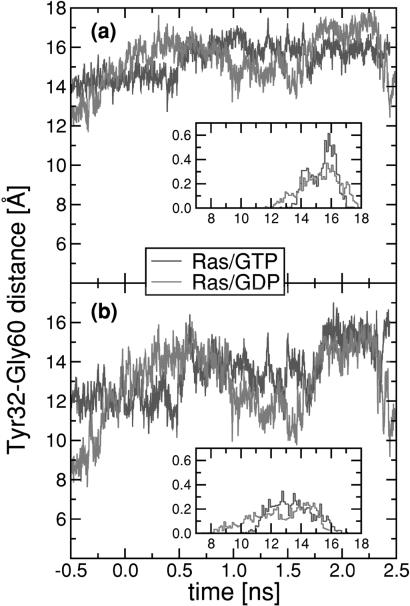
The choice of the attachment sites of the spring was motivated as follows: (i) Gly-60, a switch II residue, and Tyr-32, a switch I residue, both are located at the Ras/GAP interface (9). This finding means that large changes of X away from a—the value of X in the Ras/GTP crystal structure—must weaken the “lock-and-key” interaction of Ras with GAP; (ii) mutations of Gly-60 are known to block, or slow down, the T-to-R conformational change without interfering with the hydrolysis (19); (iii) constraining X to its Ras/GTP crystal structure value X = a, by a harmonic spring with a very large k value, suppresses the T-to-R transformation in an MD simulation. To illustrate point i, Fig. 4a shows the time evolution, along with a normalized histogram, of the distance between the central Cα atoms of Gly-60 and Tyr-32, whereas Fig. 4b shows the time evolution and the corresponding histogram of X for Ras/GDP and Ras/GTP. Note that the distance between the Cα atoms of Gly-60 and Tyr-32 does not change significantly over the MD simulation, but X does develop enormous thermal fluctuations, on nanosecond time scales, for the case of Ras/GDP. This finding indicates, first, that hydrolysis indeed has a large effect on X and its thermal motion, and, second, that the large fluctuations of X are caused by rotational motion of the side chains, which is reasonable in view of the rotational unwinding of the α2 helix.
Figure 4.
(a and b) Time dependence and normalized histogram (Insets) of the distance (measured in Å) between the Cα atoms of residues Tyr-32 and Gly-60 (a), and the COM of the side chain atoms of the same residues (b), for Ras/GTP (black curve) and Ras/GDP (gray curve).
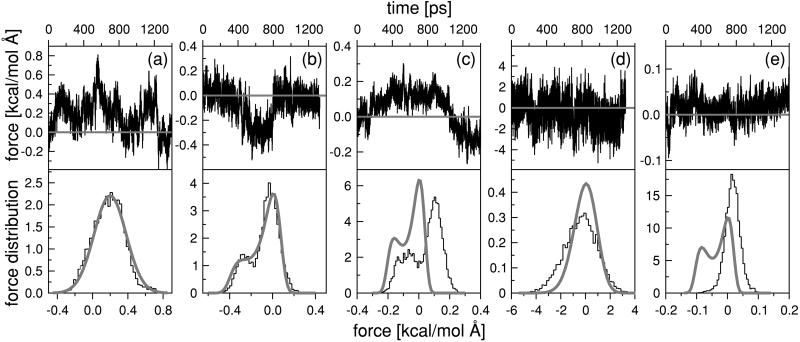
Fig. 5 (a and b) shows the results of two 1.4-ns simulations for Ras/GTP and Ras/GTP, respectively, in the presence of a k = 0.2 harmonic spring attached (k is measured in units of kcal/mol⋅Å2). The time series of the force F(t) = k (X(t) − a) (measured in units of kcal/mol⋅Å = 69.48 pN) exerted by the protein on the harmonic spring is shown for both cases, together with the histograms of the statistical distribution P(F) of the forces. Fig. 5a shows that the force distribution for Ras/GTP is approximately Gaussian, with a mean stretching force 〈F〉 ≈ 0.2 kcal/mol⋅Å (≈14 pN), whereas the corresponding force histogram for Ras/GDP (Fig. 5b) has a double-peak distribution. The two-peak structure is evident in the corresponding time series as two distinct levels of force generation, one with a force level close to zero and the other with a (negative) force level of about 0.3 kcal/mol⋅Å (≈21 pN). The system switches between these two substates, with a characteristic time scale in the range of 0.5 ns, whereas thermal fluctuations within the substates have a moderate amplitude. The force-generating substates disappear when the spring constant is significantly increased; for k = 4. the force distribution is a single-peaked Gaussian with a mean close to zero (Fig. 5d). For very soft springs, on the other hand, the level of force generation drops below 1 pN (see Fig. 5E with k = 0.05), which is uninteresting for the present purpose. Importantly, the switching between the two substates does not appear to follow a preset time sequence. Fig. 5c shows the time series F(t) for a simulation of Ras/GDP with k = 0.1. Compared with the corresponding result for k = 0.2 (Fig. 5b), the occupancy of the two substates of Fig. 5c is nearly “out-of-phase.” The natural interpretation is that occupancy of the two Ras/GDP substates takes place on a statistically random basis, like the switching between open and closed states of ion-channels (1). Statistical substate switching has in fact been reported in single-molecule studies of active proteins (20).
Figure 5.
Force time series (Upper) and the corresponding force distribution histograms P(F) (Lower) obtained for 1.4-ns MD simulations of Ras/GTP (a) and Ras/GDP (b-e). The stiffness constant k of the harmonic spring attached to the COM of the side chains of residues Tyr-32 and Gly-60 varied over k = 0.2 (a and b), k = 0.1 (c), k = 4 (d), and k = 0.05 (e) (in kcal/mol⋅Å2). The thick curves represent the theoretical predictions for P(F) by using the PMF method (see text).
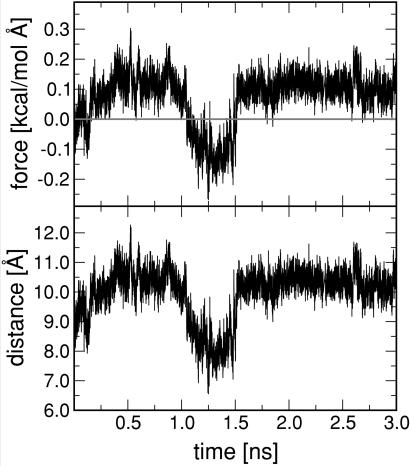
Do these observations agree with the stress-relaxation model? On the qualitative level, we found that force generation is indeed connected to a process of structural relaxation, triggered by hydrolysis. On the quantitative level, in a stress-relaxation description, the unwinding event should produce a step-like increase (or decrease) of the mean force exerted by the protein on the spring. To test this prediction, we carried out an extended 3-ns MD run for k = 0.1 (Fig. 6). The unwinding of the α2 helix took place as a sharp event at t ≈ 1.2 ns. In the period preceding the unwinding event, the protein is in the T state and, just as in the case of Ras/GTP, the spring is significantly stretched, as compared with that the Ras/GTP crystal structure. After the unwinding event, the spring switches to a compressive state. During this switch, the spring performs an amount of work on the protein equal to about 0.9 kcal/mol. This switch is followed by a second switch, at 1.5 ns, back to stretched state. Now, the protein performs work on the spring, again by an amount of about 0.9 kcal. No further switching was encountered on this run. Because of the absence of a stepwise increase (or decrease) of the applied force, we conclude that, on a quantitative level, the stress-relaxation model does not apply to our simulations. Instead of a change in the level of steady traction, hydrolysis triggers the onset of switching between different substates of Ras/GDP, as characterized by different levels of force generation. Interestingly, a similar scenario has recently been proposed for force generation in kinesin (21). There too, rapid, load-dependent isomerization switching may take place between different substates, characterized by different levels of force generation. Similarly, as shown in Fig. 5, we also find that force generation by substate switching is highly sensitive to the applied load (i.e., spring constants). Unlike Ras, however, this disordered state of kinesin is produced by ATP binding to one of the two kinesin heads, not by ATP hydrolysis.
Figure 6.
Extended MD simulation of Ras/GDP showing the force and the extension of the harmonic spring for k = 0.1. The unwinding of the α2 helix takes place as a sharp event at t ≈ 1.2 ns followed by a switching event from a stretched (positive force) to a compressed (negative force) state. At later times, the spring settles in a stretched state.
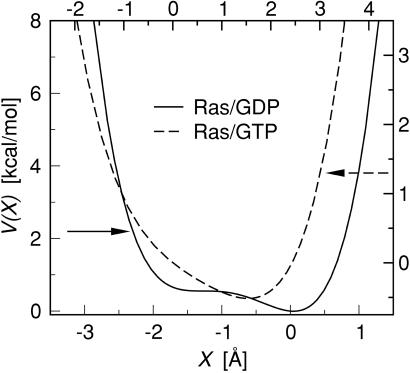
To analyze the switching behavior on a quantitative basis, we applied the potential of mean force (PMF) method. The PMF, which we will denote by V(X), is the effective potential energy of the X variable under conditions of thermodynamic equilibrium. For a known V(X), the force distribution function should be given by Peq(F) ∝ exp[−E(F)/kbT], with E(F) = F2/2k + V(a + F/k). Note that, in the limit of large spring constants k, the force distribution is predicted to be Gaussian. We first determined the form of V(X) from the Ras/spring simulation, for k = 0.2, by fitting Peq(F) to the force distribution histogram P(F) of Fig. 5b, producing the double-well potential shown in Fig. 7. The PMF of Ras/GTP on the other hand has a single-well shape. We used this PMF to obtained the Peq(F)'s for different k values, with the result shown in Fig. 5 (thick curves). For spring constants larger than k = 0.1, the predicted distributions are in reasonable agreement with the measured ones, whereas for spring constants less than k = 0.1 there are serious discrepancies. In the stress-relaxation model, the effect of the hydrolysis reaction would be to shift the minimum value of the PMF's of Ras/GTP and Ras/GDP so as to produce a net traction on the harmonic spring. Fig. 7 shows that there is indeed such a shift in the minimum value of V(X), but the more significant change is the appearance of the secondary minimum for Ras/GDP, which can be identified as a new substate.
Figure 7.
Potential of mean force V(X) for Ras/GDP (solid curve) and Ras/GTP (dashed curve), obtained by fitting Peq(F) to the force distribution histogram P(F) corresponding to a spring with k = 0.2 (see text). As indicated by the arrows, the units on the left and bottom axes of the plot refer to Ras/GDP, and the units on the right and top axes refer to Ras/GTP. Minima of V(X) correspond to force-generating substates.
It is important to be cautious about conclusions based on the PMF method; its applicability hinges on the fact whether or not the protein can be considered to be at least in some form of local thermal equilibrium over the simulation measurement period. The disagreement between predicted and measured P(F)'s in the limit of small k already indicates that this condition does not hold in that regime, which is consistent with the fact that we found that for k = 0 the fluctuations of the X variable continued to grow over the simulation time. In addition, for general k, we obtained significantly different statistical weights of the substates if one uses different sampling times, as is obvious from Fig. 6.
In summary, our MD simulations of Ras suggest that force generation proceeds in two steps. Immediately after GTP hydrolysis, Ras is in a metastable T state with a typical life time on the order of hundreds of picoseconds. Irreversible unwinding of the α2 helix, produces an R state characterized by an increased level of thermal disorder of the L4 loop. If an external load, in the form of a harmonic spring, is attached to the L4 loop, then for stiffness constants in the range of 0.1–0.2 kcal/mol⋅Å2 forces are generated of the order of 10 pN, and the protein (or the spring) can perform a limited amount of mechanical work of the order of 1 kcal/mol. Force generation is not by steady traction but, instead, by switching between force-generating substates.
Acknowledgments
We are very grateful to Willy Wriggers for providing us parameters for GTP and GDP, to Dorina Kosztin for her assistance in the early stages of the MD simulations, and especially to Per Kraulis for kindly providing us the data for Fig. 1. This work was supported by National Institutes of Health Grant PHS 5 P41 RR05969-04, and the MCA93S028 Computer Time Grant. R.B. would like to thank the Stichting voor Fundamenteel Onderzoek der Materie (Grant FB-L-CA) for financial support and the Beckmann Institute for its hospitality. I.K. also acknowledges financial support from the University of Missouri through the Life Science Mission Enhancement Program.
Abbreviations
- MD
molecular dynamics
- GAP
GTPase-activating protein
- atm
atmospheres
- COM
center of mass
- PMF
potential of mean force
- RMSD
root mean-square deviation
Footnotes
This paper was submitted directly (Track II) to the PNAS office.
References
- 1.Alberts B, Bray D, Lewis J, Raff M, Roberts K, Watson D. Molecular Biology of the Cell. 3rd Ed. New York: Garland; 1994. [Google Scholar]
- 2.Weiss S. Nat Struct Biol. 2000;7:724–729. doi: 10.1038/78941. [DOI] [PubMed] [Google Scholar]
- 3.Vale R D, Milligan R A. Science. 2000;288:88–95. doi: 10.1126/science.288.5463.88. [DOI] [PubMed] [Google Scholar]
- 4.Yin H, Wang M D, Svoboda K, Landick R, Block S M, Gelles J. Science. 1995;270:1653–1657. doi: 10.1126/science.270.5242.1653. [DOI] [PubMed] [Google Scholar]
- 5.Howard J. Mechanics of Motor Proteins and the Cytoskeleton. Sunderland, MA: Sinauer; 2001. pp. 195–212. [Google Scholar]
- 6.Sprang S R. Annu Rev Biochem. 1997;66:639–678. doi: 10.1146/annurev.biochem.66.1.639. [DOI] [PubMed] [Google Scholar]
- 7.Pai E F, Krengel U, Petsko G A, Kabsch W, Wittinghofer A. EMBO J. 1990;9:2351–2359. doi: 10.1002/j.1460-2075.1990.tb07409.x. [DOI] [PMC free article] [PubMed] [Google Scholar]
- 8.Tong L, Devos A M, Milburn M V, Kim S H. J Mol Biol. 1991;217:503–516. doi: 10.1016/0022-2836(91)90753-s. [DOI] [PubMed] [Google Scholar]
- 9.Scheffzek K, Ahmadian M R, Kabsch W, Wiesmuller L, Lautwein A, Schmitz F, Wittinghofer A. Science. 1997;277:333–338. doi: 10.1126/science.277.5324.333. [DOI] [PubMed] [Google Scholar]
- 10.Ma J, Karplus M. Proc Natl Acad Sci USA. 1997;94:11905–11910. doi: 10.1073/pnas.94.22.11905. [DOI] [PMC free article] [PubMed] [Google Scholar]
- 11.Diaz J F, Wroblowski B, Schlitter J, Engelborghs Y. Proteins. 1997;28:434–451. [PubMed] [Google Scholar]
- 12.Diaz J F, Wroblowski B, Engelborghs Y. Biochemistry. 1995;34:12038–12047. doi: 10.1021/bi00037a047. [DOI] [PubMed] [Google Scholar]
- 13.Mello L V, van Aalten D M, Findlay J B. Protein Eng. 1997;10:381–387. doi: 10.1093/protein/10.4.381. [DOI] [PubMed] [Google Scholar]
- 14.Brunger A T. X-Plor Version 3.1 : A System for X-Ray Crystallography and NMR. New Haven, CT: Yale Univ. Press; 1993. [Google Scholar]
- 15.MacKerell A D, Bashford D, Bellott M, Dunbrack R L, Evanseck J D, Field M J, Fischer S, Gao J, Guo H, Ha S, et al. J Phys Chem B. 1998;102:3586–3616. doi: 10.1021/jp973084f. [DOI] [PubMed] [Google Scholar]
- 16.Kale L, Skeel R, Bhandarkar M, Brunner R, Gursoy A, Krawetz N, Phillips J, Shinozaki A, Varadarajan K, Schulten K. J Comput Phys. 1999;151:283–312. [Google Scholar]
- 17.Feller S E, Zhang Y H, Pastor R W, Brooks B R. J Chem Phys. 1995;103:4613–4621. [Google Scholar]
- 18.Kraulis P J, Domaille P J, Campbell-Burk S J, Van. Aken T, Laue E D. Biochemistry. 1994;33:3515–3531. doi: 10.1021/bi00178a008. [DOI] [PubMed] [Google Scholar]
- 19.Diaz J F, Escalona M M, Kuppens S, Engelborghs Y. Protein Sci. 2000;9:361–368. doi: 10.1110/ps.9.2.361. [DOI] [PMC free article] [PubMed] [Google Scholar]
- 20.Block S M, Schnitzer M J, Visscher K. Mol Biol Cell. 2000;11:2213–2219. [Google Scholar]
- 21.Schnitzer M J, Visscher K, Block S M. Nat Cell Biol. 2000;2:718–723. doi: 10.1038/35036345. [DOI] [PubMed] [Google Scholar]
- 22.Humphrey W, Dalke A, Schulten K. J Mol Graphics. 1996;14:27–28. doi: 10.1016/0263-7855(96)00018-5. , 33–38. [DOI] [PubMed] [Google Scholar]


