Abstract
Defects in pancreatic β-cell function contribute to the development of type 2 diabetes, a polygenic disease that is characterized by insulin resistance and compromised insulin secretion. Hepatocyte nuclear factors (HNFs) -1α, -3β, -4α, and Pdx-1 contribute in the complex transcriptional circuits within the pancreas that are involved in β-cell development and function. In mice, a heterozygous mutation in Pdx-1 alone, but not Hnf-1α+/−, Hnf-3β+/−, or Hnf-4α+/−, causes impaired glucose-stimulated insulin secretion in mice. To investigate the possible functional relationships between these transcription factors on β-cell activity in vivo, we generated mice with the following combined heterozygous mutations: Pdx-1+/−/Hnf-1α+/−, Pdx-1+/−/Hnf-3β+/−, Pdx-1+/−/Hnf-4α+/−, Hnf-1α+/−/Hnf-4α+/−, and Hnf-3β+/−/Hnf-4α+/−. The greatest loss in function was in combined heterozygous null alleles of Pdx-1 and Hnf-1α (Pdx-1+/−/Hnf-1α+/−), or Pdx-1 and Hnf-3β (Pdx-1+/−/Hnf-3β+/−). Both double mutants develop progressively impaired glucose tolerance and acquire a compromised first- and second-phase insulin secretion profile in response to glucose compared with Pdx-1+/− mice alone. The loss in β-cell function in Pdx-1+/−/Hnf-3β+/− mice was associated with decreased expression of Nkx-6.1, glucokinase (Gck), aldolase B (aldo-B), and insulin, whereas Nkx2.2, Nkx-6.1, Glut-2, Gck, aldo-B, the liver isoform of pyruvate kinase, and insulin expression was reduced in Pdx-1+/−/Hnf-1α+/− mice. The islet cell architecture was also abnormal in Pdx-1+/−/Hnf-3β+/− and Pdx-1+/−/Hnf-1α+/− mice, with glucagon-expressing cells scattered throughout the islet, a defect that may be connected to decreased E-cadherin expression. Our data suggest that functional interactions between key islet regulatory factors play an important role in maintaining islet architecture and β-cell function. These studies also established polygenic mouse models for investigating the mechanisms contributing to β-cell dysfunction in diabetes.
Keywords: hepatocyte nuclear factors‖diabetes mellitus‖insulin secretion‖ pancreatic islets
Genetic and biochemical studies in humans and mice have identified many key transcription factors that are involved in controlling pancreas development and β−cell function in the adult islet (see ref. 1 for review). These factors have in common an islet-enriched expression pattern during pancreatic development, although each [e.g., hepatocyte nuclear factors (HNFs)] are also expressed in extrapancreatic tissues (e.g., intestine, liver, brain/neurons, and kidney). Heterozygous mutations in a subset of these genes, including HNF-4α, HNF-1α, PDX-1, HNF-1β, and BETA2, are specifically associated with a form of type 2 diabetes, termed maturity-onset diabetes of the young (MODY), that is characterized by an early disease onset (usually <25 years), autosomal dominant inheritance, and a primary defect in insulin secretion (see ref. 2 for review). There is increasing evidence that these and other islet-enriched transcription factors (e.g., Nkx2.2, Nkx6.1, Pax-4, and Pax-6) form an integrated regulatory network in the β-cell that is critical for normal glucose-stimulated insulin secretion (3, 4).
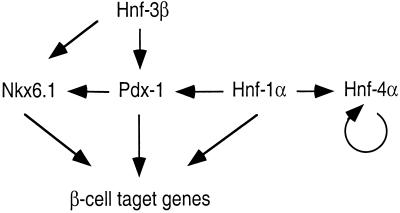
The β-cell transcriptional network is organized in a hierarchical manner. The upstream regulator of the network may be HNF-3β, a protein in the Forkhead transcription factor family. Although little is known about how HNF-3β activates transcription in pancreatic β-cell development and function, it may promote transcription in a manner similar to its action in liver and initiate the opening of the chromatin and transcription complex assembly (5, 6). HNF-3β and HNF-1β regulate HNF-4α and HNF-1α gene expression in extrapancreatic tissues (7–9), but it is unclear whether this is also true in the pancreas. In β-cells, HNF-3β and HNF-1α may directly regulate PDX-1 gene transcription (10–15). In addition, HNF-1α and HNF-4α autoregulate each other's expression (14, 16). Interestingly, in contrast to humans, only heterozygous Pdx-1 mutants but not Hnf-4α, Hnf-1α, Hnf-1β, or Beta2 induce a diabetic phenotype in mice, presumably because of the direct importance of Pdx-1 in regulating glucose transporter 2 (Glut-2), glucokinase (Gck), and insulin gene expression. Collectively, Hnf-1β, Hnf-3β, Hnf-4α, and Pdx-1 appear to contribute in controlling transcription of a number of key genes involved in glucose metabolism in the β-cell, including Glut-2, Gck, the liver isoform of pyruvate kinase (L-Pk), aldolase B (aldo-B), and insulin (17).
Because of the importance of HNF-1β, HNF-3β, HNF-4α, and PDX-1 in β-cell function, we sought to determine whether functional interactions between these islet-enriched transcription factors would be revealed upon combining heterozygous mutations of these genes in mice. Using this genetic approach, we show that Pdx-1 acts in concert with Hnf-1α and Hnf-3β to control whole body glucose levels and to maintain normal islet morphology.
Methods
Animals and Genotyping.
All animal models were maintained in C57/B6 background and were housed in the Laboratory Animal Research Center (LARC), a pathogen-free animal facility at the Rockefeller University. The animals were maintained on a 12 h light/dark cycle and fed a standard rodent chow. Genotyping was performed on DNA isolated from 3-week-old mice by PCR. The primer sequences of the wild-type and mutant alleles are available upon request.
Glucose Tolerance Tests and Insulin Release.
Mice were fasted overnight for 12 h and then injected i.p. with glucose (2 g/kg body weight). Venous blood was obtained from the tail vein at 0, 15, 30, 60, and 120 min after the injection. Blood glucose was measured with an automated glucometer (Encore, Bayer).
For insulin release, glucose (3 g/kg body weight) was injected i.p., and venous blood was collected at 0, 2, 5, 15, 30, 60, and 120 min in heparin-containing tubes and centrifuged, and the plasma was stored at −20°C. Insulin levels were measured with an ultrasensitive ELISA (Crystal Chemical, Chicago).
Metabolic Studies.
Plasma glucagon levels were measured with an RIA kit (Linco, St. Charles, MO) using rat glucagon standards. Cholesterol, bile acid, triglyceride, glycerol, and fatty acids in the plasma were measured by enzyme assays (Sigma).
Isolation of Islet RNA.
Pancreatic islets from 5-month-old mice were isolated by collagenase digestion and differential centrifugation through Ficoll gradients. Islets were cultured overnight in RPMI medium 1640 (Life Technologies) supplemented with 10% FCS and 11.1 mM glucose. Total RNA was then extracted from double hand-picked islets by using Trizol reagent (Life Technologies). Contaminating genomic DNA was removed by using 10 units of RNase-free DNase I (Boehringer Mannheim) per 5 μg of RNA.
Reverse Transcriptase (RT)-PCR.
RT-PCR was carried out for semiquantitative gene expression analysis as described (18). cDNAs were synthesized by using Moloney murine leukemia virus RT (Stratagene) with dNTPs and random hexamer primers (Stratagene). These cDNAs served as the PCR template for reactions run in the presence of specific primers, dNTPs, and Taq DNA polymerase at annealing temperatures between 60°C and 65°C. Typically, 20–28 cycles were run to maintain the amplification within the linear range. The intra-assay coefficient of variation of the RT-PCR was <5%. The primer sequences used for PCR are available upon request.
Immunohistochemistry and Immunofluorescence Analysis.
Immunofluorescence analysis was performed on 5-μm paraffin-embedded pancreatic sections from 5-month-old mice by using conditions described previously (14). The primary guinea pig anti-insulin and rabbit anti-glucagon antibodies (Linco) were used at 1:600 and 1:300 dilution in PBS, respectively. Rhodamine red-conjugated donkey anti-guinea pig (Jackson ImmunoResearch) and Alexa Fluor 488-conjugated donkey anti-rabbit antibodies (Molecular Probes) were incubated with the primary-antibody-treated samples at dilutions of 1:100 and 1:600 in PBS, respectively. Sections were washed three times in PBS between each incubation and then mounted by using the Prolong Antifade kit (Molecular Probes). Image analysis was performed on a Zeiss LSM 510 confocal laser scanning microscope with dual detectors and an argon/krypton laser for simultaneous scanning of the two different fluorochromes. Images were acquired by using the LSM 510 software package (Zeiss).
Morphometric Analysis.
The pancreata were fixed in paraformaldehyde and stained for insulin and glucagon as described above. Sections (7 μm) through the entire pancreas were taken, and every sixth section was used for morphometric analysis. At least 288 nonoverlapping images (pixel size 0.88 μm) were scanned by using a confocal laser scanning microscope (Zeiss LSM 510). The morphometry parameters were analyzed by using the metamorph software package (Universal Imaging, Media, PA). The areas covered by cells stained by insulin or glucagon were integrated by using stained objects that are greater than 3 pixels in size.
Statistical Analysis.
All values indicated are expressed as mean ± SE unless indicated otherwise. Statistical analysis was carried out with a two-tailed Student's unpaired t test, and the null hypothesis was rejected at the 0.05 level.
Results
Generation and Metabolic Characterization of Mutant Mice.
The combined heterozygous Hnf-1α+/−/Hnf-4α+/−, Hnf-3β+/−/Hnf-4α+/−, Pdx-1+/−/Hnf-3β+/−, Pdx-1+/−/Hnf-4α+/−, and Pdx-1+/−/Hnf-1α+/− mutant mice were generated by intercrossing mice heterozygous for each mutation. The effect of the combined mutants on serum glucose homeostasis was compared with Pdx-1+/− and wild-type (Wt) mice.
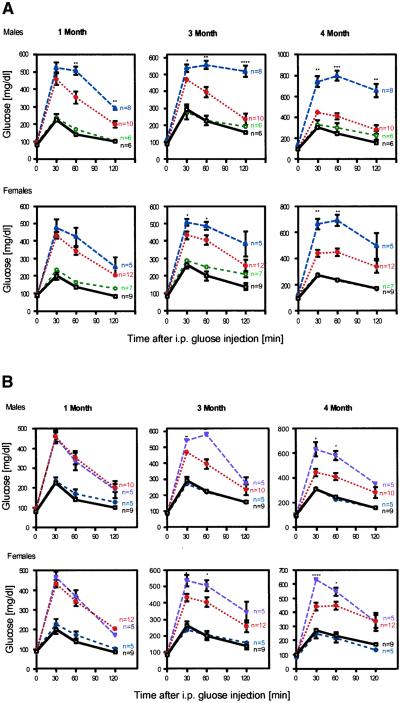
Pdx-1+/−/Hnf-1α+/− male mice developed higher fasting and ad lib feeding serum glucose levels than did Pdx-1+/− mice at 3 months of age (136 ± 11 and 188 ± 10 vs. 94 ± 4 and 167 ± 5 mg/dl, P = 0.04 and 0.03, respectively). In addition, i.p. glucose tolerance tests (IPGTTs) performed on both male and female Pdx-1+/−/Hnf-1α+/− mice showed lower glucose clearance levels compared with the Pdx-1+/−. Hyperglycemia in Pdx-1+/−/Hnf-1α+/− mice deteriorated over time, whereas the Pdx-1+/− mutant was nonprogressing (Fig. 1A). The Pdx-1+/−/Hnf-3β+/− mice also exhibited higher ad lib feeding blood glucose levels than did Pdx-1+/− mice (181 ± 8 vs. 167 ± 5 mg/dl, P = 0.02). Male and female Pdx-1+/−/Hnf-3β+/− mutant mice were phenotypically indistinguishable from Pdx-1+/− animals at 1 month of age but developed a progressively decreased ability to clear glucose by 3 and 4 months (Fig. 1B). The glucose levels during an IPGTT appeared to be intermediate between Pdx-1+/−/Hnf-1α+/− mice and Pdx-1+/− mutant animals. In contrast, Pdx-1+/−/Hnf-4α+/−, Hnf-1α+/−/Hnf-4α+/−, and Hnf-3β+/−/Hnf-4α+/− mice had indistinguishable blood glucose levels from Hnf-1α, Hnf-3β, or Hnf-4α haploinsufficient mice over a 6-month interval (data not shown).
Figure 1.
Progressive impairment of glucose homeostasis in Pdx-1+/−/Hnf-3β+/− and Pdx-1+/−/Hnf-1α+/− mice. IPGTT was performed in Wt (black, □), Hnf-1α+/− (green, ○), Pdx-1+/− (red, ⋄), Pdx-1+/−/Hnf-1α+/− (blue, ▵), and Pdx-1+/−/Hnf-3β+/− (purple,▿ ) littermates at 1, 3, and 4 months of age as described in Materials and Methods. (A) Significantly increased serum glucose concentrations were observed in male and female Pdx-1+/−/Hnf-1α+/− mice compared with Pdx-1+/− at 1, 3, and 4 months, respectively. (B) The IPGTTs of Pdx-1+/−/Hnf-3β+/− mice were indistinguishable from those of Pdx-1+/− littermates at 1 month but blood glucose levels increased in male and female mice after 3 months. A worsening of the phenotype was seen in all double heterozygous animals. *, P ≤ 0.05; **, P ≤ 0.01; ***, P ≤ 0.005; ****, P ≤ 0.0001.
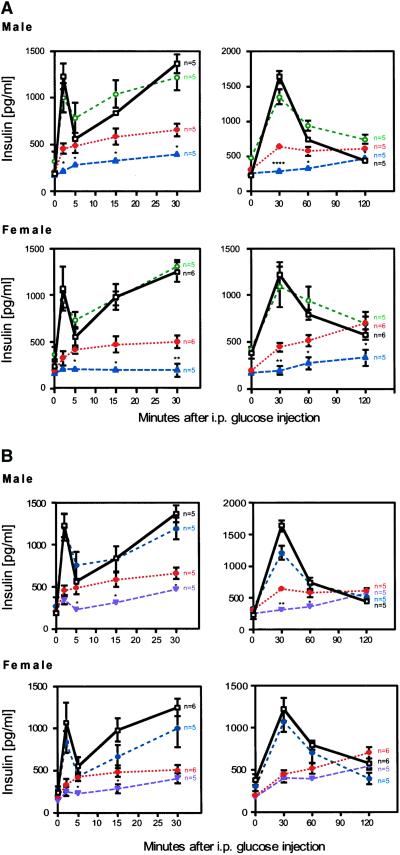
Glucose-stimulated insulin release from Pdx-1+/−/Hnf-1α+/− and Pdx-1+/−/Hnf-3β+/− mice was compared with the Wt and Hnf-1α+/−, Hnf-3β+/−, and Hnf-4α+/− mutants. In both male and female Wt and single mutant animals, a 3- to 6-fold increase in insulin levels was observed within 2 min after an i.p. glucose injection. Serum insulin levels in Wt, Hnf-1α+/−, Hnf-3β+/−, and Hnf-4α+/− mice remained higher than fasting values for up to 60 min, indicating an effective second-phase insulin secretion response (Fig. 2A, data not shown). Pdx-1+/− mice exhibited a defect in acute first- and second-phase insulin secretion. Despite the secretion defect in Pdx-1+/− mice, insulin levels gradually rose over a period of 120 min during an IPGTT. In contrast, the acute insulin response was virtually absent in Pdx-1+/−/Hnf-1α+/− mice, and insulin secretion was reduced throughout the IPGTT compared with Pdx-1+/− mice (Fig. 2A). Pdx-1+/−/Hnf-3β+/− mice also lost the first-phase insulin response. However, insulin levels were not significantly different from Wt at the 2-h point (Fig. 2B). These results suggest that synergistic interactions between Hnf-1α, Hnf-3β, and Pdx-1 profoundly affect insulin secretion and glucose homeostasis in mice.
Figure 2.
Loss of first-phase and blunted second-phase insulin secretion in response to glucose. Glucose-stimulated insulin release was measured as described in Materials and Methods. (Left) Acute insulin secretion responses. (Right) Insulin levels over a 2-h period after glucose challenge. The data of Left and Right were collected independently and mice were allowed to recover for 1 week. Wt mice are shown in black (□), Hnf-1α+/− in green (○), Pdx-1+/− in red (⋄), Pdx-1+/−/Hnf-1α+/− in blue (▵), and Pdx-1+/−/Hnf-3β+/− in purple (▿). (A) Male and female Pdx-1+/−/Hnf-1α+/− mutant mice show a complete loss of acute-phase insulin response and a blunted second-phase insulin response. (B) Selective loss of acute-phase insulin secretion in Pdx-1+/−/Hnf-3β+/− mutant mice compared with Pdx-1+/− littermates. *, P ≤ 0.05; **, P ≤ 0.01; ***, P ≤ 0.005; ****, P ≤ 0.0001.
Because Hnf-1α, Hnf-3β, and Hnf-4α are also expressed in liver and pancreatic α-cells, we investigated the levels of a number of surrogate markers that can influence glucose homeostasis. Fasting serum insulin, glucagon, fatty acid, glycerol, cholesterol, and bile acid levels in single and combined heterozygous mutant mice were indistinguishable from those in Wt mice (see Table 1, which is published as supporting information on the PNAS web site, www.pnas.org). These data further support the finding that impaired glucose homeostasis in Pdx-1+/−/Hnf-1α+/− and Pdx-1+/−/Hnf-3β+/− mice results from reduced pancreatic β-cell function.
Morphological Analysis of Pancreatic Islets.
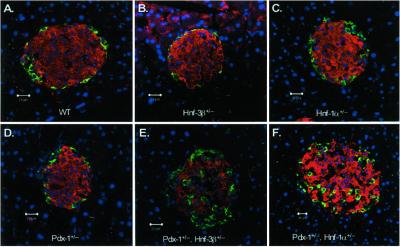
Immunofluorescent and morphometric analysis of pancreata from Wt and Pdx-1+/−/Hnf-1α+/− and Pdx-1+/−/Hnf-3β+/− mice were performed to determine whether the loss in β-cell function was associated with a reduction in islet mass or morphology. Pancreatic sections from 5-month-old mice were analyzed with insulin and glucagon antibodies to visualize β- and α-cells, respectively. We did not detect a significant difference in total pancreatic islet area or in the α- to β-cell ratios between Wt and mutant islets (see Table 2, which is published as supporting information). Thus, it is unlikely that a reduction β-cell size/number leads to the diabetic phenotype in double-mutant mice. However, the characteristic islet architecture, specifically the confinement of α-cells to the periphery of the islet, was disorganized in Pdx-1+/−/Hnf-3β+/− and Pdx-1+/−/Hnf-1α+/− mice (Fig. 3). Even though α-cells were scattered throughout the islet in the mutants, they did not coexpress insulin (i.e., no yellow cells were observed in the merged image), suggesting that they represented normal differentiated α-cells. These results indicate that the abnormal islet morphology could contribute to the phenotype of the combined heterozygous mutant mice
Figure 3.
Pdx-1+/−/Hnf-3β+/− and Pdx-1+/−/Hnf-1α+/− mice exhibit altered islet morphology. Immunofluorescent confocal microscopy of pancreatic islets of Wt (A), Hnf-3β+/− (B), Hnf-1α+/− (C), Pdx-1+/− (D), Pdx-1+/−/Hnf-3β+/− (E), and Pdx-1+/−/Hnf-1α+/− (F) mice. Insulin-expressing cells are shown in red, glucagon-containing cells in green. Nuclei of respective cells are shown in blue. Islets from Pdx-1+/−/Hnf-3β+/− (E) and Pdx-1+/−/Hnf-1α+/− (F) mice show scattered α-cells throughout the islets. Pancreatic islet size was not significantly different in the different mutant mice.
Pancreatic Gene Expression.
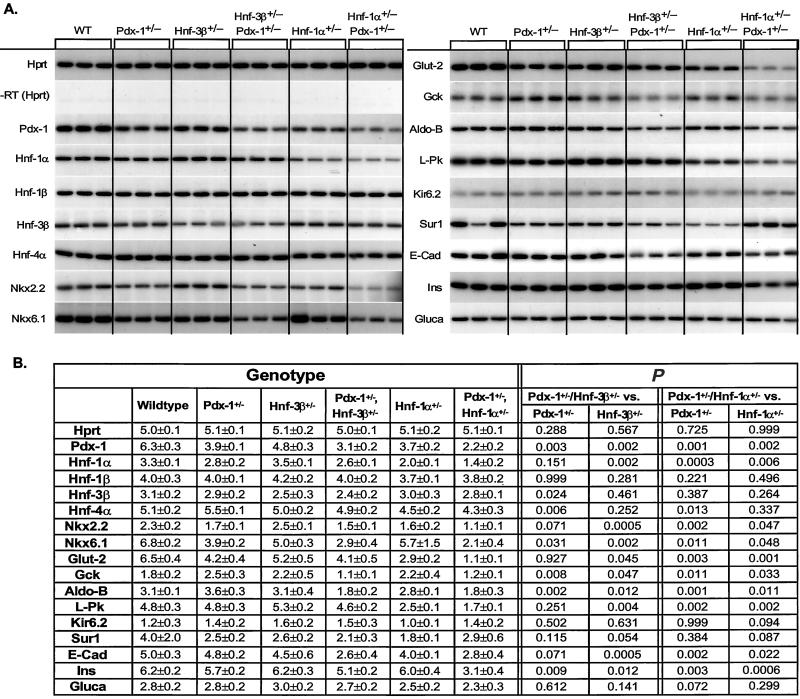
To determine more precisely why β-cell function was compromised in Pdx-1+/−/Hnf-3β+/− and Pdx-1+/−/Hnf-1α+/− mice, steady-state mRNA profiles of transcription factors, hormones, and components of the glucose-stimulated insulin secretion pathway that are essential for β-cell activity were generated by RT-PCR from Wt and mutant islet RNAs. Significant changes in expression from genes present in each effector category were identified in the combined heterozygous mutant mice (Fig. 4).
Figure 4.
(A) Steady-state mRNA levels of pancreatic islet enriched genes of wild-type (WT), Pdx-1+/−, Hnf-3β+/−, Hnf-1α+/−, Pdx-1+/−/Hnf-3β+/−, and Pdx-1+/−/Hnf-1α+/− mutant mice. The housekeeping gene hypoxanthine phosphoribosyltransferase (Hprt) was amplified to show that each sample contained similar amounts of mRNA. A lack of any amplification signal in reactions without reverse transcriptase (−RT) shows that genomic DNA did not contaminate the samples. Transcript levels were measured in three animals for each genotype by RT-PCR using [α-32P]dCTP. PCR products were separated by PAGE, and bands were visualized by autoradiography. (B) Quantitative measurements of gene expression were obtained by densitometry, and the mean of measurements are shown ± SD. The level of significance of the different comparisons (single- vs. double-heterozygous mutant) is shown on the right.
Pdx-1 mRNA levels were moderately reduced in Hnf-3 β+/− mice (24%) and decreased in Pdx-1+/−, Hnf-1α+/−, Pdx-1+/−/Hnf-1α+/−, and Pdx-1+/−/Hnf-3β+/− animals by 38%, 41%, 65%, and 51%, respectively. These results are consistent with previous reports suggesting that Hnf-3β and Hnf-1α are regulators of Pdx-1 gene expression (10–15). Hnf-1α mRNA levels were reduced only in Hnf-1α+/− and Pdx-1+/−/Hnf-1α+/− mice, whereas Hnf-1β mRNA levels were similar in all different genotypes. Interestingly, Nkx-6.1 expression was reduced in Pdx-1+/− and Hnf-3β+/− mice as well as combined heterozygous Pdx-1+/−/Hnf-3β+/− and Pdx-1+/−/Hnf-1α+/− mice but not in Hnf-1α+/− animals. Expression levels of Nkx2.2 were diminished in Pdx-1+/− and in double-heterozygous mutant mice, indicating that reduced Nkx2.2 expression is mediated mainly by Pdx-1 (Figs. 4 and 5). Islet glucagon mRNA levels were similar in all mutants studied, supporting our immunohistological findings that indicated normal α-cell differentiation and similar α-cell to β-cell ratios between islets of Wt and various mutants.
Figure 5.
Regulation of pancreatic islet transcription factors. Strong synergistic effects exist in vivo between Pdx-1, Hnf-1α, and Hnf-3β. Hnf-1α and Hnf-3β both regulate the expression of Pdx-1 in vivo and in vitro. Hnf-4α expression is normal in Hnf-4α+/− mutant mice, suggesting an autoregulatory feedback loop. Furthermore, Hnf-4α does not regulate the expression of Hnf-1α or Pdx-1 in pancreatic islets. Gene expression analysis also indicates that Nkx6.1 gene transcript levels are regulated by Pdx-1.
Decreased insulin transcript levels (11% and 46%, respectively) were detected in Pdx-1+/−/Hnf-3β+/− and Pdx-1+/−/Hnf-1α+/− mutants compared with Pdx-1+/−, indicating that a reduction in insulin gene transcription may contribute to the insulin secretion defect in these mice Fig. 4). In addition, we found a number of changes in the expression of genes that are responsible for glucose-stimulated insulin secretion. The expression of Glut-2 was reduced in Pdx-1+/−(35%, P ≤ 0.05), Hnf-1α+/− (55%, P ≤ 0.01), Pdx-1+/−/Hnf-3β+/− (37%, P ≤ 0.05), and Pdx-1+/−/Hnf-1α+/− (83%, P ≤ 0.001) compared with wild-type animals, indicating that both Pdx-1 and Hnf-1α, but not Hnf-3β, are important regulators of Glut-2 expression. There was a synergistic effect on Glut-2 expression in mice that were haploinsufficient for both Pdx-1 and Hnf-1α genes. Liver pyruvate kinase mRNA levels were reduced in Hnf-1α+/− animals and Hnf-1α+/−/Pdx-1+/− mice, and the expression pattern correlates best with this gene being under the transcriptional control of Hnf-1α (Fig. 4). Expression levels of the gene encoding Gck, which controls the rate-limiting step of glycolysis, were reduced in double-heterozygous mutants compared with Pdx-1+/− mice (56% and 52% for Pdx-1+/−/Hnf-3β+/− and Pdx-1+/−/Hnf-1α+/−, respectively) (Fig. 4).
To identify genes that may contribute to the abnormal islet morphology in the double-heterozygous mice, we also investigated the expression levels of E-cadherin, a transmembrane domain glycoprotein that mediates cell–cell adhesion in the gastrointestinal tract and endocrine pancreas (19). Interestingly, expression levels of E-cadherin were significantly reduced in Pdx-1+/−/Hnf-1α+/− and Pdx-1+/−/Hnf-3β+/− animals (44% and 48%, respectively), suggesting a possible role for cadherin in islet architecture of these mice (Fig. 4).
As described above, compound-heterozygous Pdx-1+/−/Hnf-4α+/−, Hnf-3β+/−/Hnf-4α+/−, and Hnf-1α+/−/Hnf-4α+/− mice do not have a worsened phenotype than is seen in single-mutant mice alone. These findings were surprising because heterozygous inactivation of HNF-4α, like HNF-1α, in humans is associated with the development of maturity-onset diabetes of the young. To study the possible mechanism(s) that confer(s) relative protection to the development of diabetes on an Hnf-4α+/− genetic background we assayed gene expression in pancreatic islets of mice with one or two functional Hnf-4α alleles. We did not detect a significant down-regulation in expression of any islet-enriched transcription factors, including Hnf-4α, or from genes involved in glucose-stimulated insulin secretion, such as Glut-2, Gck, liver pyruvate kinase, and aldolase B (data not shown). Moreover, known target genes of Hnf-4α such as aldo-B and Hnf-1α were not reduced in Hnf-4α+/− mice compared with Wt animals. This is in contrast to our findings in Hnf-1α+/− mice, which display reduced levels of Glut-2, liver pyruvate kinase, Hnf-4α, Hnf-1α, and Pdx-1 mRNA. Our results therefore suggest that, in mice, Hnf-4α can compensate for allelic loss by up-regulating gene expression of the functional allele.
Discussion
Type 2 diabetes is a polygenic disease, and genetic predisposition to this condition is likely due to changes in expression and/or activity of proteins important in insulin sensitivity and normal pancreatic islet function. However, a mutation in a susceptibility gene often does not result in diabetes unless present in combination with another, which together result in impaired glucose homeostasis. Such gene–gene interactions within the insulin-signaling pathway have been shown upon combining specific inactivating gene mutations in mice that are predisposed to insulin resistance (20–22). For instance, plasma insulin levels increased by almost 50-fold in mice with combined haploinsufficiencies in the insulin receptor (Ir) and insulin receptor substrate-1 (Irs-1) genes, with ≈40% of the Ir+/−/Irs-1+/− mice becoming overtly diabetic at 4–6 months of age (20). Interestingly, islet mass was greatly expanded in these diabetic mice as a means of producing more insulin to aid in glucose clearance. Although the islet has clearly been shown to have a central role in regulating glucose homeostasis, little is known about how this process is influenced by epistatic interactions between factors critical for pancreatic β-cell function. In this study, we have shown that a combination of heterozygous deletions in certain subsets of the islet transcription factor network can act synergistically to cause diabetes.
Allelic loss of Hnf-1α and Hnf-3β, although having no effect on glucose homeostasis as single mutants, markedly worsened the diabetic phenotype in Pdx-1+/− mice. Insulin secretion and blood glucose levels were compromised in both female and male double-mutant mice. These results are consistent with recent findings showing that Hnf-3β and Hnf-1α directly activate Pdx-1 transcription (10–15). Pdx-1 is a key effector of glucose sensing because of its action on Glut-2, insulin, and Gck expression. In contrast, we did not observe synergism between Hnf-3α or Hnf-4α with Pdx-1. Furthermore, Hnf-1α+/−/Hnf-4α+/− and Hnf-3β+/−/Hnf-4α+/− mutant mice have blood glucose levels similar to those of littermates with single mutations. Together, our in vivo data suggest that Hnf-3β, Hnf-1α, and Pdx-1 are key components of a common pathway that is essential for normal glucose-induced insulin secretion.
To gain insight into the mechanisms by which β-cell function was impaired in Pdx-1+/−/Hnf-1α+/− and Pdx-1+/−/Hnf-3β+/− mice, pancreatic islet gene expression profiles were generated in the individual and combined mutants. Target genes of Hnf-1α and Pdx-1, such as Glut-2, were significantly reduced in the individual mutants. L-Pk, a target gene of Hnf-1α, was also reduced in Hnf-1α+/− mice. In addition, there was a modest reduction in Pdx-1 expression levels in the phenotypically normal Hnf-3β+/− and Hnf-1α+/− mice. Interestingly, the Pdx-1+/−/Hnf-3β+/− and Pdx-1+/−/Hnf-1α+/− mice exhibited decreased mRNA expression of specific factors involved in regulated islet gene transcription (Pdx-1, Nkx2.2, and Nkx6.1) and glucose-stimulated insulin secretion signaling (Glut-2, Gck, L-Pk, and aldol-B) (Fig. 5). Insulin message was also significantly decreased in the double-heterozygous mutant mice in which Pdx-1 expression was reduced by ≥50%. A reduction in Pdx-1 expression of ≥50% seems to be a critical threshold for causing a decrease in insulin gene mRNA levels. The insulin mRNA levels found in Pdx-1+/− islets (i.e., normal) and islets wherein Pdx-1 was selectively removed (i.e., reduced) also support our data (23). Together, our findings illustrate that significant synergism exists between the Hnf-3β, Hnf-1α, and Pdx-1 transcription factors in regulating insulin gene transcription and expression of genes involved in glucose-stimulated insulin secretion.
To begin to address why β-cell function was not compromised in Pdx-1+/−/Hnf-4α+/−, Hnf-4α+/−/Hnf-1α+/−, or Hnf-4α+/−/Hnf-3β+/− mice, gene expression profiles were generated with islet RNA from Wt and Hnf-4α+/− mice. Interestingly, in contrast to the Hnf-1α, Hnf-3β, or Pdx-1 haploinsufficiency, the loss of an Hnf-4α allele did not significantly affect Hnf-4α mRNA expression levels as compared with the Wt. In addition, we did not find reduced expression of Pdx-1 or known targets of Hnf-4α (e.g., L-Pk, Hnf-1α, and aldol-B). These results suggest that mechanism(s) exist, possibly through an autoregulatory feedback loop that can compensate for the loss of one Hnf-4α allele. Furthermore, our results also suggest that factors that do not significantly reduce Pdx-1 gene expression, such as Hnf-4α+/−/Hnf-1α+/− and Hnf-3β+/−/Hnf-4α+/− (data not shown), are less likely to affect β-cell activity.
To study whether allelic variation in Pdx-1, Hnf-3β, and Hnf-1α affected islet development, a detailed morphological analysis was performed. We did not detect differences in islet size, although marked alterations in architecture were revealed by immunohistological analysis, with α-cells no longer confined to the islet periphery. However, the α-cells in double-heterozygous mutant mice appeared to be functional (no differences in plasma glucagon levels were observed in mice of various genotypes) and present at the same relative ratio to β-cells as in Wt. As a change in islet morphology has also been noted in Nkx2.2, Nkx6.1, and Hnf-3β-deficient mice (4, 24, 25), the reduced expression levels of these genes in Pdx-1+/−/Hnf-3β+/− and Pdx-1+/−/Hnf-1α+/− mice may therefore contribute to this phenotype. In addition, the double heterozygous mice had reduced expression of E-cadherin. E-cadherin is important to regulate adhesion between all pancreatic endocrine cells and to maintain correct islet topology (19, 25). Furthermore, the cell-to-cell contacts mediated by E-cadherin have been shown to be required for insulin secretion in response to nutrient stimuli (26, 27). Therefore, the reduced E-cadherin levels observed in the islets of double-mutant mice not only may lead to disorganized islets but also may contribute to impaired glucose tolerance.
In conclusion, we have created polygenic models for progressive pancreatic β-cell failure. Our results provide molecular insights of how subclinical, genetically predisposing defects in the pancreatic islet transcription network can synergize to develop progressive β-cell failure. Furthermore, these mutant mice provide unique models to dissect the epistatic interactions among different genes in complex pathways that regulate islet morphology and function, and to design specific therapeutic approaches that prevent β-cell failure.
Supplementary Material
Acknowledgments
We thank Dr. F. Gonzalez for sharing Hnf-1α mutant mice. This work was supported by National Institutes of Health Grants RO1 DK55033–04 (M.S.), RO1 DK-50203 (R.S.), and Medical Scientists Training Program Grant GM07739 (D.Q.S.), the Deutsche Forschungsgemeinschaft (M.H.), the Juvenile Diabetes Foundation International (M.S.), and the Human Science Frontier Organization (M.S.). We also thank Robert and Harriet Heilbrunn and Allen and Frances Adler for their generous support.
Abbreviations
- HNF
hepatocyte nuclear factor
- Gck
glucokinase
- RT
reverse transcriptase
- Wt
wild type
- IPGTT
i.p. glucose tolerance test
Footnotes
This paper was submitted directly (Track II) to the PNAS office.
References
- 1.Edlund H. Diabetes. 2001;50, Suppl. 1:S5–S9. doi: 10.2337/diabetes.50.2007.s5. [DOI] [PubMed] [Google Scholar]
- 2. Shih, D. Q. & Stoffel, M. (2002) Curr. Diabetes Rep. 2, in press. [DOI] [PubMed]
- 3.St-Onge L, Wehr R, Gruss P. Curr Opin Genet Dev. 1999;9:295–300. doi: 10.1016/s0959-437x(99)80044-6. [DOI] [PubMed] [Google Scholar]
- 4.Sander M, Sussel L, Conners J, Scheel D, Kalamaras J, Dela Cruz F, Schwitzgebel V, Hayes-Jordan A, German M. Development (Cambridge, UK) 2000;127:5533–5540. doi: 10.1242/dev.127.24.5533. [DOI] [PubMed] [Google Scholar]
- 5.Shim E Y, Woodcock C, Zaret K S. Genes Dev. 1998;12:5–10. doi: 10.1101/gad.12.1.5. [DOI] [PMC free article] [PubMed] [Google Scholar]
- 6.Cirillo L A, Zaret K S. Mol Cell. 1999;4:961–969. doi: 10.1016/s1097-2765(00)80225-7. [DOI] [PubMed] [Google Scholar]
- 7.Duncan S A, Navas M A, Dufort D, Rossant J, Stoffel M. Science. 1998;281:692–695. doi: 10.1126/science.281.5377.692. [DOI] [PubMed] [Google Scholar]
- 8.Barbacci E, Reber M, Ott M, Breillat C, Huetz F, Cereghini S. Development (Cambridge, UK) 1999;126:4795–4805. doi: 10.1242/dev.126.21.4795. [DOI] [PubMed] [Google Scholar]
- 9.Coffinier C, Thepot D, Babinet C, Yaniv M, Barra J. Development (Cambridge, UK) 1999;126:4785–4794. doi: 10.1242/dev.126.21.4785. [DOI] [PubMed] [Google Scholar]
- 10.Stein R, Gerrish K, Gannon M, Shih D, Henderson E, Stoffel M, Wright C V E. J Biol Chem. 2000;275:3485–3492. doi: 10.1074/jbc.275.5.3485. [DOI] [PubMed] [Google Scholar]
- 11.Wu K L, Gannon M, Peshavaria M, Offield M F, Henderson E, Ray M, Marks A, Gamer L W, Wright C V, Stein R. Mol Cell Biol. 1997;17:6002–6013. doi: 10.1128/mcb.17.10.6002. [DOI] [PMC free article] [PubMed] [Google Scholar]
- 12.Ben-Shushan E, Marshak S, Shoshkes M, Cerasi E, Melloul D. J Biol Chem. 2001;276:17533–17540. doi: 10.1074/jbc.M009088200. [DOI] [PubMed] [Google Scholar]
- 13.Marshak S, Benshushan E, Shoshkes M, Havin L, Cerasi E, Melloul D. Mol Cell Biol. 2000;20:7583–7590. doi: 10.1128/mcb.20.20.7583-7590.2000. [DOI] [PMC free article] [PubMed] [Google Scholar]
- 14.Shih D Q, Screenan S, Munoz N K, Phillipson L, Pontoglio M, Yaniv M, Polonsky K S, Stoffel M. Diabetes. 2001;50:2464–2481. doi: 10.2337/diabetes.50.11.2472. [DOI] [PubMed] [Google Scholar]
- 15.Gerrish K, Cissell M A, Stein R. J Biol Chem. 2001;276:47775–47784. doi: 10.1074/jbc.M109244200. [DOI] [PubMed] [Google Scholar]
- 16.Boj S F, Parrizas M, Maestro M A, Ferrer J. Proc Natl Acad Sci USA. 2001;98:14481–14486. doi: 10.1073/pnas.241349398. [DOI] [PMC free article] [PubMed] [Google Scholar]
- 17.Ohneda K, Ee H, German M. Semin Cell Dev Biol. 2000;11:227–233. doi: 10.1006/scdb.2000.0171. [DOI] [PubMed] [Google Scholar]
- 18.Wilson P A, Melton D A. Curr Biol. 1994;4:676–686. doi: 10.1016/s0960-9822(00)00152-4. [DOI] [PubMed] [Google Scholar]
- 19.Perl A K, Wilgenbus P, Dahl U, Semb H, Christofori G. Nature (London) 1998;392:190–193. doi: 10.1038/32433. [DOI] [PubMed] [Google Scholar]
- 20.Brüning J C, Winnay J, Bonner-Weir S, Taylor S I, Accili D, Kahn C R. Cell. 1998;88:561–572. doi: 10.1016/s0092-8674(00)81896-6. [DOI] [PubMed] [Google Scholar]
- 21.Kido Y, Burks D J, Withers D, Brüning J C, Kahn C R, White M F, Accili D. J Clin Invest. 2000;105:199–205. doi: 10.1172/JCI7917. [DOI] [PMC free article] [PubMed] [Google Scholar]
- 22.Withers D J, Burks D J, Towery H H, Altamuro S L, Flint C L, White M F. Nat Genet. 1999;23:32–40. doi: 10.1038/12631. [DOI] [PubMed] [Google Scholar]
- 23.Ahlgren U, Jonsson J, Jonsson L, Simu K, Edlund H. Genes Dev. 1998;12:1763–1768. doi: 10.1101/gad.12.12.1763. [DOI] [PMC free article] [PubMed] [Google Scholar]
- 24.Sussel L, Kalamaras J, Hartigan-O'Connor D J, Meneses J J, Pedersen R A, Rubenstein J L, German M S. Development (Cambridge, UK) 1998;125:2213–2221. doi: 10.1242/dev.125.12.2213. [DOI] [PubMed] [Google Scholar]
- 25.Sund N J, Vatamaniuk M Z, Casey M, Ang S L, Magnuson M A, Stoffers D A, Matschinsky F M, Kaestner K H. Genes Dev. 2001;15:1706–1715. doi: 10.1101/gad.901601. [DOI] [PMC free article] [PubMed] [Google Scholar]
- 26.Dahl U, Sjödin A, Semb H. Development (Cambridge, UK) 1996;122:2895–2902. doi: 10.1242/dev.122.9.2895. [DOI] [PubMed] [Google Scholar]
- 27.Hauge-Evans A C, Squires P E, Persaud S J, Jones P M. Diabetes. 1999;48:1402–1408. doi: 10.2337/diabetes.48.7.1402. [DOI] [PubMed] [Google Scholar]
Associated Data
This section collects any data citations, data availability statements, or supplementary materials included in this article.


