

Abstract
G197del is the most prevalent LDL receptor (LDLR) mutation causing familial hypercholesterolemia (FH) in Ashkenazi Jew (AJ) individuals. The purpose of this study was to determine the origin, age, and population distribution of G197del, as well as to explore environmental and genetic effects on disease expression. Index cases from Israel (n=46), South Africa (n=24), Russia (n=7), The Netherlands (n=1), and the United States (n=1) were enlisted. All trace their ancestry to Lithuania. A highly conserved haplotype (D19S221:104-D19S865:208-D19S413:74) was identified in G197del chromosomes, suggesting the occurrence of a common founder. When two methods were used for analysis of linkage disequilibrium (LD) between flanking polymorphic markers and the disease locus and for the study of the decay of LD over time, the estimated age of the deletion was found to be 20 ± 7 generations (the 95% confidence interval is 15–26 generations), so that the most recent common ancestor of the mutation-bearing chromosomes would date to the 14th century. This corresponds with the founding of the Jewish community of Lithuania (1338 a.d.), as well as with the great demographic expansion of AJ individuals in eastern Europe, which followed this settlement. The penetrance of mutation-linked severe hypercholesterolemia is high (94% of heterozygotes have a baseline concentration of LDL cholesterol (LDL-C) that is >160 mg/dl), and no significant differences in the mean baseline lipid level of G197del carriers from different countries were found. Polymorphisms of apolipoprotein E and of scavenger-receptor class B type I were observed to have minor effects on the plasma lipid profile. With respect to determinative genetic influences on the biochemical phenotype, there is no evidence that could support the possibility of a selective evolutionary metabolic advantage. Therefore, the founder effect in a rapidly expanding population from a limited number of families remains a simple, parsimonious hypothesis explaining the spread of G197del-LDLR–linked FH in AJ individuals.
Introduction
Familial hypercholesterolemia (FH; also known as “hyperlipoproteinemia type IIa” [MIM 143890]) is an autosomal codominant disorder characterized by elevated plasma levels of LDL cholesterol (LDL-C), tendinous xanthomas, corneal arcus, and premature atherosclerotic coronary artery disease. FH results from mutations at the LDL receptor (LDLR) gene, which lies on the short arm of chromosome 19 (at 19p13.1-p13.3 [Couture et al. 1999]). LDLR consists of a 160-kD transmembrane glycoprotein, ubiquitously distributed and involved in the receptor-mediated endocytosis of LDL particles from plasma (Goldstein et al. 1985). LDLR gene spans 45 kb and contains 18 exons encoding the six functional domains of the mature protein (Südhof et al. 1985). A reduction of LDLR activity leads to diminished catabolism of LDL-C, resulting in elevated plasma levels of cholesterol.
FH is one of the most common inherited metabolic diseases, with a worldwide frequency of ⩾1/500 for heterozygotes and 1/1,000,000 for homozygotes (Goldstein et al. 1995). More than 680 LDLR mutations have been identified (Varret et al. 1998 [LDLR Database]; Heath et al. 2001 [The Low Density Lipoprotein Receptor (LDLR) Gene in Familial Hypercholesterolemia]). In relatively isolated populations—including the French Canadians in northeastern Quebec (Moorjani et al. 1989; Leitersdorf et al. 1990), Afrikaners in South Africa (Steyn et al. 1989; Kotze et al. 1991), Ashkenazi Jew (AJ) individuals (Seftel et al. 1989; Meiner et al. 1991), Druze (Landsberger et al. 1992), Christian Lebanese (Lehrman et al. 1987), Finns (Aalto-Setala et al. 1992; Koivisto et al. 1992), and Tunisians (Slimane et al. 1993)—there is an increased prevalence of FH, which reaches its height in AJ individuals (in whom the frequency is 1 heterozygote per 67–69 individual [Seftel et al. 1989]). In these populations, a small number of LDLR mutations predominate, which either were introduced at a founder time or appeared in more-recent generations.
Wide interindividual variability in plasma lipid profile (PLP) has been observed in FH heterozygotes, and this feature is only partly due to mutational heterogeneity at the LDLR locus (Moorjani et al. 1993; Bertolini et al. 2000). Genetic and/or environmental factors are suspected to influence the pathways of lipoprotein metabolism in patients with FH, to an extent and by a mechanism that remain to be ascertained.
The most prevalent FH-causing LDLR mutation in Jews from eastern Europe (mainly Lithuania) now residing in Israel is a 3-bp deletion in exon 4 of the LDLR gene (652delGGT) (Meiner et al. 1991). The mutation results in the deletion of Gly197 (G197del) in a highly conserved cysteine-rich repeat of the ligand-binding domain of the receptor. The defective protein fails to be transported to the Golgi complex at a normal rate (LDLR mutational functional class IIb [Hobbs et al. 1990]), most likely because of improper folding. G197del was originally described in a patient homozygous for FH who was from the United States (Hobbs et al. 1990). It was also found in eight South African Jews (Meiner et al. 1991), six unrelated Jewish families from the United Kingdom (Gudnason et al. 1993), one German (Geisel et al. 1995), and seven Jews with FH who were from St. Petersburg (Mandelshtam et al. 1998). In this article, we address the question as to whether this mutation had a single origin and, if so, when and where the mutational event occurred. To this end, we used the observed distribution of allelic variants of three flanking short tandem-repeat (STR) markers (D19S221, D19S865, and D19S413) on mutant and control chromosomes, to estimate the age of the mutation by linkage disequilibrium (LD) analysis and by modeling LD's decay over time.
Among disease in AJ individuals, FH has received scarce attention from population geneticists. This is due to its allelic heterogeneity at the LDLR locus and to the consequent difficulty in enlisting a number of genetically homogeneous independent cases (to date, eight different mutations have been detected in families with FH that are of AJ origin [Varret et al. 1998: LDLR Database). However, the dominant inheritance pattern of FH, an infrequent phenomenon among disorders in AJ individuals, supplies a novel opportunity to address the intriguing issue of why such an array of genetic disease has a high frequency in the AJ population. Provided that their penetrance is high even in heterozygotes and that modifying genetic factors do not influence, in a considerable way, the expressed phenotypes, dominant mutations are exposed to direct selection uniformly within and among populations, and the hypothesis of carrier advantage does not apply in this case. In an attempt to exclude major interference that polymorphisms known to affect cholesterol metabolism in other circumstances might have on the G197del-linked biochemical phenotype, the influences that common genotypes of apolipoprotein E (ApoE; Hagberg et al. 2000) and of scavenger receptor class B type I (SR-BI; Iwaki et al. 1999) have on the baseline PLP of index cases from different countries were investigated. The results support the eligibility of this FH founder mutation for a straightforward model for studying the genetic history (and the underlying mechanisms) that have yielded the spectrum of inherited disorders observed at remarkable frequency in the AJ population today.
Subjects, Material, and Methods
Families and Subjects
A total of 46 families from Israel, 24 families from South Africa, 7 families from Russia, 1 family from The Netherlands, and 1 family from United States were collected by an international cooperative effort aimed at comparing the FH phenotypic variance among geographic areas, to evaluate disease penetrance and the effects that environmental and modifying genetic factors have on the biochemical manifestations of the disorder. Written informed consent was obtained prior to the families' participation, under protocols approved by the local institutional review boards. Index cases (table 1) were patients with marked hypercholesterolemia and a documented history of FH in their families and were carriers of G197del in the LDLR gene (Meiner et al. 1991). Information on the geographic location of current and ancestral settlements of families was obtained by asking for the birthplace of the proband and of his or her grandparents. Detailed interviews excluded cases from related families. Most, if not all, index cases are of AJ origin or of mixed AJ–non-AJ origin. Of the 46 patients residing in Israel, one (index case 430-002) belongs to an Iraqi Jewish family whose pedigree includes a marriage between one ancestor and an AJ women. Of the three nonwhite patients (“coloured” population) residing in South Africa, two are known to have AJ-mixed ancestry (Loubser et al. 1999). The case from The Netherlands is Christian, whereas the patient from the United States (Piscataway, NJ) is of AJ origin (Poland) and represents the only subject homozygous for the 197del LDLR mutation.
Table 1.
Location, Ancestry, Sex, Age, ApoE and SR-BI Polymorphisms, and PLP of Patients with G197del LDLR
|
Polymorphismsb |
PLP(mg/dl) |
||||||
| Family Locationand Index Case(Sex/Age [years]) | Ancestral Origina | ApoEb(ε) | SR-BIc(C/T) | TC | TG | HDL-C | LDL-C |
| Israel: | |||||||
| 302-001 (M/48) | AJ (E) | 2,3 | C,C | 500 | … | … | … |
| 303-006 (F/62) | AJ (E) | 3,3 | C,C | 286 | 67 | 46 | 227 |
| 307-004 (M/49) | AJ (E) | 3,3 | C,C | 363 | 182 | 38 | 289 |
| 314-003 (M/41) | AJ (E) | 3,3 | C,T | 439 | 125 | 38 | 375 |
| 339-001 (F/57) | AJ (E) | 3,3 | C,T | 367 | 177 | 28 | 304 |
| 340-001 (M/31) | AJ (E) | 3,3 | C,C | 600 | … | … | … |
| 341-002 (M/11) | Unknown | 3,3 | C,C | 425 | 116 | 61 | 341 |
| 342-001 (F/60) | Unknown | 3,3 | C,T | 283 | 102 | 51 | 212 |
| 343-001 (M/76) | AJ (E) | 3,4 | C,T | 237 | 175 | 35 | 167 |
| 344-001 (F/55) | AJ (E) | 3,4 | C,T | 458 | 232 | 31 | 381 |
| 357-001 (F/26) | AJ (E) | 3,4 | T,T | 275 | 59 | 40 | 223 |
| 358-001 (F/34) | AJ (E) | 3,3 | C,T | 320 | … | … | … |
| 359-001 (F/23) | AJ (US) | 2,4 | C,T | 420 | … | … | … |
| 382-001 (F/20) | AJ (E) | 2,3 | T,T | 380 | 124 | 61 | 294 |
| 383-001 (F/19) | Unknown | 3,3 | T,T | 450 | … | … | … |
| 384-001 (M/10) | Unknown | 2,3 | C,T | 300 | … | … | … |
| 388-001 (F/58) | AJ (E) | 3,3 | C,T | 348 | 150 | 68 | 250 |
| 402-001 (F/33) | AJ (E) | 3,3 | T,T | 350 | 178 | 51 | 263 |
| 404-001 (M/32) | AJ (PL) | 3,4 | C,C | 300 | 91 | 34 | 248 |
| 405-001 (F/66) | AJ (E) | 3,3 | C,C | 493 | 164 | … | … |
| 406-001 (F/56) | AJ (E) | 3,4 | C,C | 483 | 162 | 44 | 407 |
| 413-001 (F/57) | AJ (E) | 3,3 | C,C | 238 | 142 | 36 | 174 |
| 421-001 (M/61) | Unknown | 3,3 | T,T | 376 | 100 | 32 | 324 |
| 426-001 (M/27) | AJ (E) | 3,3 | C,C | 403 | 157 | 39 | 332 |
| 430-002 (F/9) | IJ-AJ (mx) | 3,3 | T,T | 338 | 40 | 51 | 279 |
| 453-001 (F/40) | AJ (E) | 4,4 | T,T | 245 | 67 | 39 | 193 |
| 463-001 (M/27) | AJ (E) | 3,3 | C,C | 278 | 83 | 35 | 223 |
| 494-001 (F/61) | AJ (E) | 3,3 | T,T | 464 | 133 | 78 | 359 |
| 496-001 (F/34) | AJ (E) | 3,3 | C,T | 402 | 114 | 41 | 338 |
| 503-001 (F/74) | AJ (E) | 2,4 | C,C | 360 | … | … | … |
| 549-001 (F/36) | AJ (E) | 3,3 | T,C | 379 | 97 | 53 | 306 |
| 558-002 (F/15) | AJ (E) | 3,3 | C,C | 284 | 71 | 41 | 229 |
| 560-001 (F/54) | Unknown | 3,3 | C,C | 435 | 326 | 52 | 319 |
| 569-001 (F/38) | Unknown | 3,3 | T,T | 388 | 166 | 60 | 295 |
| 577-001 (F/72) | AJ (E) | 3,3 | C,C | 500 | … | … | … |
| H-009 (M/39) | AJ (E) | 3,3 | T,T | 472 | 114 | 36 | 413 |
| H-011 (F/53) | AJ (E) | 3,3 | C,C | 515 | 373 | 28 | 412 |
| T-007 (M/44) | AJ (E) | 3,3 | C,C | 231 | 69 | 35 | 182 |
| T-010 (M/40) | AJ (E) | 3,3 | T,T | 217 | 111 | 26 | 169 |
| T-014 (F/30) | AJ (E) | 3,3 | T,T | 296 | 124 | 37 | 234 |
| T-026 (F/42) | AJ (E) | 3,3 | C,C | 275 | 86 | 53 | 205 |
| T-028 (M/40) | AJ (E) | 3,3 | C,C | 292 | 126 | 30 | 237 |
| T-029 (M/43) | AJ (E) | 2,3 | C,C | 241 | 61 | 31 | 198 |
| T-032 (F/49) | AJ (E) | 3,3 | C,C | 357 | 174 | 35 | 287 |
| T-035 (M/36) | AJ (E) | 3,3 | C,C | 281 | 101 | 65 | 196 |
| T-040 (F/65) | Unknown | 3,3 | … | 331 | 188 | 42 | 252 |
| Mean ± SD for Israeld | 362.5 ± 91.6 | 134.9 ± 67.7 | 43.3 ± 12.5 | 274.0 ± 72.0 | |||
| South Africa: | |||||||
| 107 (M/49) | Coloured (mx) | 3,3 | C,C | 398 | 212 | 35 | 320 |
| 181 (F/33) | White (E) | 3,4 | … | 358 | 62 | 58 | 289 |
| 238 (F/48) | White (E) | 3,3 | C,C | 490 | 328 | 50 | 375 |
| 442 (M/30) | AJ (E) | 3,4 | … | 390 | 301 | 35 | 293 |
| 523 (F/35) | White (E) | 2,2 | T,T | 289 | 80 | 62 | 212 |
| 636 (F/48) | White (E) | 3,4 | C,C | 289 | 150 | 31 | 231 |
| 642 (F/71) | White (E) | 3,3 | C,T | 472 | 124 | 35 | 414 |
| 651 (F/58) | White (E) | 2,3 | … | 445 | 283 | 43 | 344 |
| 716 (F/49) | AJ (E) | 2,3 | C,T | 317 | 71 | 62 | 244 |
| 922 (F/19) | Coloured (mx) | 3,3 | C,C | 428 | 106 | 43 | 363 |
| 1101 (M/31) | AJ (D) | 3,3 | T,C | 270 | 204 | 43 | 183 |
| 1102 (F/51) | AJ (LT) | 3,3 | … | 542 | 133 | 54 | 460 |
| 1103 (M/48) | AJ (LT) | 3,3 | … | 456 | 274 | 35 | 367 |
| 1104 (F/44) | AJ (Russia) | 3,3 | C,C | 398 | 141 | 23 | 333 |
| 1105 (M/36) | AJ (LT) | 3,3 | T,T | 401 | 345 | 54 | 272 |
| 1106 (F/73) | AJ (UK) | 3,3 | … | 476 | 186 | 42 | 395 |
| 1107 (M/48) | AJ (LT) | 3,4 | T,C | 321 | 97 | 35 | 267 |
| 2584 (F/24) | White (E) | 3,3 | … | 294 | 124 | 54 | 216 |
| 2611 (F/18) | White (E) | 2,3 | C,T | 391 | 71 | 50 | 328 |
| 4084 (M/22) | White (E) | 3,3 | T,T | 452 | 230 | 27 | 378 |
| A104 Hb (F/41) | AJ (E) | 3,3 | T,T | 231 | 45 | 42 | 181 |
| A129 CD (F/53) | AJ (E) | 3,3 | C,C | 301 | 53 | 58 | 231 |
| D185 NL (F/12) | AJ (E) | 3,3 | T,T | 385 | 85 | 30 | 339 |
| D729/91 (F/61) | Coloured | … | … | 564 | 245 | 32 | 484 |
| Mean ± SD for South Africae | 389.9 ± 88.2 | 164.6 ± 93.3 | 43.0 ± 11.5 | 313.3 ± 83.5 | |||
| Russia: | |||||||
| 50-001 (M/47) | AJ | 2,3 | C,C | 265 | 312 | 19 | 184 |
| 51-001 (F/56) | AJ | 2,3 | T,C | 492 | 105 | 52 | 419 |
| 52-001 (M/37) | AJ | 2,3 | T,C | 362 | 188 | 38 | 286 |
| 53-003 (M/29) | AJ | 3,3 | … | 286 | 134 | 58 | 201 |
| 54-003 (F/33) | AJ | 2,3 | T,C | 319 | 103 | 60 | 238 |
| 55-001 (M/44) | AJ | 2,3 | T,C | 500 | 285 | 64 | 379 |
| 56-001 (M/38) | AJ | … | … | 408 | 85 | 49 | 342 |
| Mean ± SD for Russiaf | 376.0 ± 94.6 | 173.1 ± 92.1 | 48.6 ± 15.6 | 292.7 ± 90.5 | |||
| Onb-2341 (F/69) | AJ | 3,4 | C,C | 366 | 68 | 71 | 289 |
| Piscataway (M/9) | AJ (E) | … | … | 870 | … | … | … |
D = German; E = European; IJ = Iraqi Jew; LT = Lithuanian; NL = Dutch; PL = Polish; UK = British; US = North American; mx = mixed.
2 = ε2; 3 = ε3; 4 = ε4.
In exon 8.
Mean age ± SD = 42.5 ± 17.4 (n=46).
Mean age ± SD = 41.8 ± 16.2 (n=24).
Mean age ± SD = 40.6 ± 9.1 (n=7).
A cohort of 45 control AJ individuals from Israel, providing 90 normal independent chromosomes, was used for estimating the frequencies of alleles at marker loci. Control subjects included family members and unrelated individuals.
Biochemical Determinations
PLPs of the index cases are reported in table 1. Blood was collected in tubes containing EDTA, after an overnight fast and before any hypolipidemic drug or dietary treatment. By means of commercially available diagnostic kits, plasma total cholesterol (TC), triglycerides (TG), and LDL cholesterol (HDL-C) were analyzed in local laboratories, by standardized enzymatic methods, either directly (in the case of TC and TG) or in the supernatant after chemical precipitation of ApoB-containing lipoproteins (in the case of HDL-C). LDL-C was calculated by means of the Friedewald et al. (1972) formula.
Genotyping and Haplotyping
DNA was isolated from peripheral blood leukocytes, by standard procedures. Chromosomes were screened for the G197del LDLR mutation, by PCR amplification and heteroduplex analysis as described elsewhere (Meiner et al. 1991). With one exception (the individual from Piscataway, NJ), all patients were heterozygous for the mutation. Three polymorphic markers (The Genome Database accession number; repeat, amplimer) were used for genotyping disease and normal chromosomes: D19S221 (188431; (CA)n, AFM224ye9), D19S865 (602894; (CA)n, AFMa107xc9), and D19S413 (199839; (CA)n, AFM292wd9). Fluorescently labeled primers (ABI-PRISM [F]dUTPs) for D19S221 and D19S865 were purchased from PE Applied Biosystems. PCR conditions were according to the manufacturer’s protocols. Fluorescently labeled primers for D19S413 were 5′-GTTTATTTTAAATGCTCTTACCACA-3′ (forward) and 5′-CCATCAACTCACCTACTTATCGT-3′ (reverse). PCR was performed under the following condition: 95°C for 12 min; followed by 10 cycles of 94°C for 15 s, 55°C for 15 s, and 72°C for 30 s; 20 cycles of 89°C for 15 s, 55°C for 15 s, and 72°C for 30 s; and a final extension at 72°C for 10 min. The reaction mixture contained 1.2 μl of DNA (50 ng/μl), 1 μl each of the forward and reverse primers (10 pmol/μl), 2.8 ml of double-distilled water (DDW), and 9 μl of ABI-PRISM PCR premix solution. Allele sizes were determined on an ABI 310 semiautomated sequencer, by comparison with size standards (400 HD Rox GENESCAN software). Haplotype data were obtained either from informative pedigrees (via cosegregation of microsatellite alleles) or via homozygosity at marker loci.
ApoE Restriction Isotyping
Restriction isotyping (restriction-enzyme isoform genotyping) has been used for typing common ApoE alleles (ε2–ε4) by means of a modified version of the procedure described by Hixson and Vernier (1990). The method relies on PCR amplification of ApoE gene sequences that encompass amino acid positions 112 and 158, followed by CfoI cleavage of amplified DNA and separation of the resulting digestion fragments by gel electrophoresis. The following primers were used: 5′-GAGAAGCTTGCGGCGCAGGCCCGGCTGGGCGCG-3′ (forward) and 5′-TGAAGCTTCGCTCGGCGCCCTCGCGGGCCCGGG-3′ (reverse). PCR was performed under the following conditions: 94°C for 5 min, followed by 30 cycles of 94°C for 1.5 min and 72°C for 3 min. The PCR mixture contained 23 μl of each dNTP (10 mM), 1.14 μl of dimethylsulfoxide, 190 μl of NH4SO4 (1 M), 600 μl of Tris-HCl (1 M; pH 9), 160 μl of Tris-HCl (1 M; pH 8), 76 μl of MgCl2 (1 M), 140 μl of DTT (1 M), 193 μl of BSA, 7.44 μl of DDW, 2 μl of DNA (50 ng/ml), and 0.2 μl of Taq DNA polymerase (5 U/ml). After amplification, 1 μl of CfoI (10 U/ml; Boehringer-Mannheim) was added to 15 μl of PCR mixture, according the manufacturer’s instructions. The restriction mixture was left for 3 h at 37°C, and the product was separated on 8% polyacrylamide gel and was visualized by ethidium bromide staining. The sizes of CfoI fragments were estimated by comparison with markers of known size.
Analysis of SR-BI Polymorphisms
SNP C/T at codon 350 in exon 8 of the gene encoding for the SR-BI was detected by HaeIII (Acton et al. 1999). The following primers were employed: 5′-CTTGTTTCTCTCCCATCCTCACTTCCTCAAGGC-3′ (forward) and 5′-CACCACCCCAGCCCACAGCAGC-3′ (reverse). PCR conditions were 94°C for 5 min, followed by 30 cycles of 94°C for 1 min, 68°C for 1 min, and 75°C for 1 min. The reaction mixture contained 0.2 μl of α-[32P]dCTP (5 Ci/μl), 1 μl of each dNTP (10 mM), 1 μl each of the forward and reverse primers (optical density 5), 0.2 μl of Taq DNA polymerase (5 U/μl), 2 μl of PCR buffer (Roche Diagnostics), and 13.6 μl of DDW. Digestion with HaeIII (Boehringer Mannheim) was performed at 37°C for 2 h, according to the manufacturers’ instructions. The product (20 μl) was separated on 8% polyacrylamide gel and was visualized by overnight exposure to a film plate. The sizes of HaeIII fragments were estimated by comparison with markers of known size.
LD Analysis
Allele-frequency distributions in disease and control AJ chromosomes were compared by evaluating the difference in proportions (Daniel 1995). The cohorts of mutation-bearing and normal chromosomes were considered as two independent random samples—of size nD and nN, respectively—that are drawn from two populations of dichotomous variables; then, the proportion of observations with the characteristics of interest in the two populations are pD and pN (the frequencies of a marker’s allele on disease-mutation–bearing and normal chromosomes, respectively), and the distribution of the difference between sample proportions is approximately normal, with normal mean equal to pD − pN and with variance
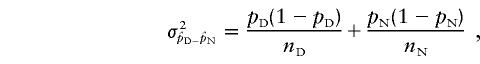 |
when nD and nN are large. According to standard biometrics, nD and nN can be considered sufficiently large when nDpD, nNpN, nD(1−pD), and nN(1−pN) are all >5 and the population proportions are not too close to 0 or 1. For the area under the curve of the standard normal distribution (one sided, since each allele was tested for evidence of increased frequency on mutation-bearing chromosomes), significance of the observed difference can be derived by the statistic z=(pD-pN)/σ. Under these circumstances, it is also possible to compute a 100(1-α)% interval for the estimated difference,  . Theoretically, in the event that the constraint indicated above is not met (frequency ⩽5), a correction should be introduced; however, conditions requiring the correction are also those that recommend against the use of the corresponding alleles for LD analysis. Similarly, nonsymmetric variance should be used for proportions close to 0 or 1, and, again, these circumstances do not recommend the allele as a candidate for LD analysis. Consequently, whenever the sample of chromosomes is reasonably large, the general formula can be applied. Since more than one allele was tested at each marker locus, a Bonferroni correction was applied by multiplication of the nominal significance level (P) by the number of alleles tested.
The measure of LD, δ, between each marker locus and G197del was calculated, according to the method of Bengtsson and Thomson (1981), as (pD−pN)/(1−pN). Recently, Diaz et al. (2000) suggested that a confidence interval (CI) for δ can be conveniently calculated under the assumption of independence for the sampled chromosomes. Since δ=1-(1-pD)/(1-pN) is a function of the ratio of two independent random variables, the variance of δ can be approximated by
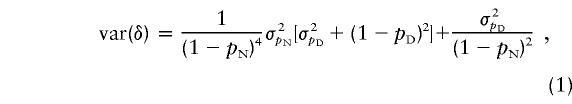 |
where σ2pN=[pN(1-pN)]/nN and σ2pD=[pD(1-pD)]/nD. An appropriate CI (i.e., 90%) of δ can then be obtained as δ±1.64σδ, where σ2δ=var(δ).
Recombination Fraction (θ)
The sex-averaged θ between each polymorphic marker and LDLR gene was obtained from Couture et al. (1999). The θ's between D19S221, D19S413, and the LDLR locus were also estimated on the basis of physical distances (in Mb) available from the Metric Physical Map (Maps of Human Chromosome 19). The genetic-distance:physical-distance ratio assumed for chromosome 19p13.1-13.2 (1.9 cM/Mb) is according to Mohrenweiser et al. (1998, fig. 2A). To calculate the genetic distance of D19S839, its radiation-hybrid distance (in cR10,000) from D19S413 (GeneMap’99) was converted into centimorgans, by use of a ratio of 0.2 Mb/cR10,000. Kosambi’s function, θ=0.5[exp(w/25)-1]/[exp(w/25)+1], was applied to convert genetic map distance, w (in cM), into θ.
Age Estimation
To yield an appropriate estimate of the age of the mutation, two different algorithms were used, both of which are based on the “genetic clock” equation (Labuda et al. 1997), lnP=-θg, relating the time (in generations [g]) back to the most recent common ancestor of mutant chromosomes, the frequency of recombination between the disease locus and the marker (i.e., θ), and the probability that a marker’s allele on a disease chromosome is the ancestral one (P). An unbiased estimate of P is the proportion of observed haplotypes that are ancestral. The first method relies on the algorithm of Risch et al. (1995),
 |
The second method (Reich and Goldstein 1999) generates a Markov transition matrix (K), which gives the probabilities that, in a single generation, any one haplotype will be transformed into any other one. K is calculated as the weighted sum of matrices corresponding to recombination (R), mutation (M), and no event occurring (I):
where m is the frequency of mutation at the marker locus. Matrix R has the elements R11=pN, R12=pN, R21=1-pN, and R22=1-pN. If a stepwise mutation model for microsatellites (Goldstein and Pollock 1997) and a distribution of marker allele sizes on disease chromosomes that matches that seen in the control population are assumed, then M has the elements M11=0, M12=f/2, M21=1, and M22=1-(f/2), where f is the frequency of all one-mutant neighbors of the ancestral allele in the control population. With the parameters of K specified (under the assumption of μ=.00056 for dinucleotide repeats [Weber and Wong 1993]), the number of generations g that have passed since the foundation event is estimated by multiplication of the state vector (q, 1-q) by K iteratively until the observed proportion of ancestral haplotypes is reached (q≈pD). Iteration begins at a frequency vector of (1,0), corresponding to the archetypal condition of only ancestral haplotype. The number of times that K is multiplied yields the estimate of g (Reich and Goldstein 1999).
The setting of the genetic clock according to the approach of Luria and Delbrück (1943), which takes into account the population growth rate, was performed by correction of the estimated age, as follows:
with
 |
fD being equal to ed/(ed-1), where d is the population growth rate (for small d values, fd≈1/d) (Labuda et al. 1996).
Age estimates based on each marker’s data have been analyzed by the conventional procedures used for parametric variables, by the SPSS program, version 9 (SPSS). A minimum CI for the age estimates was calculated by means of equation (2), with the minimum CI for d (Diaz et al. 2000).
Statistical Analysis
Statistical analysis was performed by the SPSS program, version 9. Before comparison of subgroups of G197del carriers according to country of residence, PLPs were adjusted for sex and age, by linear multiple-regression analysis. The allele distribution for ApoE and SR-BI polymorphisms was determined by gene counting. The impact of ApoE and SR-BI genotype on PLP of carriers was tested by application of variance-covariance analysis to each plasma-lipid variable, with genotype subgroup as fixed factor, sex as random factor, and age as covariate. The general linear model (multivariate analysis) failed to provide more information. The level of statistical significance was set at P=.05.
Results
LD Analysis and Age Estimation
Genomic DNA samples from 79 index cases with FH (table 1) and from additional family members (when available) were typed for the G197del LDLR mutation and for alleles at three flanking polymorphic markers (D19S221, D19S865, and D19S413), to determine whether patients from unrelated families and different locations harbored the same mutation identical by descent. A putative ancestral three-allele haplotype (D19S221:104-D19S865:208-D19S413:74) was identified in G197del chromosomes from 54 (68%) of the index cases, either as certain (when phase could be unambiguously determined) or as most likely (when genotypes were consistent with the conserved haplotype). As well, five related haplotypes (104-208-70, 104-202-74, 104-210-74, 98-208-74, and 106-208-74) were found in 14 (18%) of the index cases, either as certain or as most likely. Since it is only at one marker that these haplotypes vary from the ancestral 104-208-74 haplotype, it is likely that they derived from the latter by either recombination or mutation.
We analyzed the frequencies of STR alleles associated with G197del and compared them with the corresponding allele frequencies in the background AJ population (table 2). On G197del chromosomes, alleles at each marker locus were counted only when the marker’s haplotype was known for certain (phased chromosomes or locus homozygosity). When data from the certain haplotypes and from the most likely haplotypes were pooled, the resulting allele frequencies proved to be similar to those reported in table 2 (pD=.83, .67, and .86 for alleles 104, 208, and 74, respectively). The three alleles defining the ancestral 104-208-74 haplotype on the G197del chromosomes occurred at significantly (corrected P<.0001) increased frequency (table 3). In light of the frequencies of the same alleles on normal chromosomes (pN=.400, .222, and .311, respectively), the probability of finding the ancestral haplotype identical by state in the general AJ population is low (i.e., 2.8×10⁻²). LD index values show a higher degree of allelic excess at D19S221 (allele 104, δ=.808 [90%CI .635–.981]) and D19S413 (allele 74, δ=.868 [90%CI .748–.988]) than at D19S865 (allele 208, δ=.618 [90%CI .455–.780]).
Table 2.
Frequencies of Alleles at Marker Loci D19S221, D19S865, and D19S413, in G197del-Mutation–Bearing and Control Chromosomes
|
Frequency in Chromosomes |
||
| Allele Size(bp) | Control | G197del |
| D19S221:a | ||
| 88 | .022 | … |
| 90 | .011 | … |
| 92 | .022 | … |
| 94 | .067 | … |
| 96 | .122 | … |
| 98 | .033 | .038 |
| 100 | .156 | … |
| 102 | .111 | .038 |
| 104 | .400 | .885 |
| 106 | .056 | .038 |
| D19S865:b | ||
| 200 | .089 | .027 |
| 202 | .200 | .054 |
| 204 | .078 | .081 |
| 206 | .078 | .027 |
| 208 | .222 | .703 |
| 210 | .156 | .081 |
| 212 | .167 | .027 |
| D19S413:c | ||
| 64 | .011 | … |
| 66 | .011 | … |
| 68 | .022 | … |
| 70 | .089 | .030 |
| 72 | .111 | … |
| 74 | .311 | .909 |
| 76 | .178 | .030 |
| 78 | .111 | … |
| 80 | .100 | .030 |
| 82 | .067 | … |
For control chromosomes, n=90; for G197del chromosomes, n=26.
For control chromosomes, n=90; for G197del chromosomes, n=37.
For control chromosomes, n=90; for G197del chromosomes, n=33.
Table 3.
LD between the G197del LDLR Mutation and Chromosome 19p13 Flanking Markers, as Evidenced by Allelic Excess
|
Haplotype Data |
||||||||
| Estimate of Difference in Proportions |
LDb |
|||||||
| Marker | Maximum Heterozygositya | Allele Size(bp) | pD | pN | Mean ± SE (95%CI) | Pc | δ (vard) | 90% CI |
| D19S221 | .87 | 104 | .885 (23/26) | .400 (36/90) | .485 ± .081 (.325–.644) | <.0001 | .808 (.011) | .635–.981 |
| D19S865 | .89 | 208 | .703 (26/37) | .222 (20/90) | .480 ± .087 (.310–.651) | <.0001 | .618 (.010) | .455–.780 |
| D19S413 | .78 | 74 | .909 (30/33) | .311 (28/90) | .598 ± .070 (.461–.635) | <.0001 | .868 (.005) | .748–.988 |
Source: Centre d'Étude du Polymorphisme Humain.
Calculated according to the method of Bengtsson and Thomson (1981): δ=(pD-pN)/(1-pN).
Corrected according to the Bonferroni method.
Obtained by use of equation (1).
The presence of detectable LD at markers flanking the LDLR locus, as well as the availability of defined map distances for each of them, allowed the estimation of the coalescence time for G197del chromosomes. To account for the uncertainty inherent in the mapping of tightly linked loci, genetic distances between markers and the LDLR locus were obtained from two sources: directly, from sex-averaged θ values (Couture et al. 1999), and indirectly (via genetic to physical distance ratio), from physical maps publicly available from the Lawrence Livermore National Laboratory Human Genome Center (see its Maps of Human Chromosome 19 website) and GeneMap’99. The two θ values were in excellent agreement for D19S865 (θ=.025 and .026, respectively), whereas a significant difference was observed for D19S221 and D19S413 (the difference in θ values was .006 and .008, respectively). This minor inconsistency is not uncommon when a comparison is made between genetic distances from different sources (e.g., see Colombo and Carobene 2000; Diaz et al. 2000).
Age was estimated in two ways. First, we applied the algorithm of Risch et al. (1995), a method for estimating the coalescent time of mutant chromosomes that focuses on the proportion of lineages not having undergone either a mutation or a recombination event (eq. [5]). The age of the most recent common ancestor (expressed in terms of g) is expressed as a function of θ and δ, which is a measure of LD (Bengtsson and Thomson 1981) (also known as “Pexcess” [Lehesjoki et al. 1993]). Because δ is a function of two conditional probabilities—that is, pD and pN—it could be estimated from case-control data obtained from separate samples of independent mutation-bearing and normal chromosomes (table 2). Using a simple general model, Lazzeroni (1998) recently showed how δ can be interpreted in terms of identity-by-descent probabilities. To take into account the presence of a proportion of nonancestral alleles among the mutation-bearing chromosomes, a second approach was undertaken, which models the regeneration of the ancestral haplotype by the recombination process. This can be done in a number of ways. We chose the Markov transition-matrix method of Reich and Goldstein (1999), for its flexibility. Under this model, it was straightforward to include both recombination and mutation data for each marker. As suggested by Goldstein et al. (1999), for simplicity we assumed a strict stepwise mutation model for STRs (Goldstein and Pollock 1997).
Table 4 shows the age of origin of the G197del LDLR mutation, as estimated by the two methods. The age estimate varies considerably from marker to marker. This disappointing feature of the results is probably due both to sampling variation in allele frequencies at different loci and to the uncertainty linked to the calculation of the θ values and is common to mutation dating by LD analysis (Guo and Xiong 1997). The mean ± SD overall age estimate is 11.8±6.4 g (95%CI 6.7–16.9 g) according to the Risch et al. (1995) algorithm and is 11.3±6.1 g (95%CI 6.4–16.2 g) according to the Reich and Goldstein (1999) iterative method. Since the age estimate provided by LD analysis at each marker locus is based on two θ values, it is questionable whether the six available age estimates are really independent of each other. If we consider the pair of θ values as nonindependent variables, then the mean age estimates obtained by the two methods remain unchanged and a small change is observed in their SD, whereas the corresponding 95%CIs increase remarkably (to 4.0–19.6 and 3.6–19.0, respectively).
Table 4.
Estimation of Age of the G197del Mutation in the LDLR Gene Causing FH in AJ Individuals
|
Estimated Ageb |
|||||||||
|
Distance from LDLR |
Method 1 |
Method 2 |
|||||||
| Markeror Allele | Megabases | Centimorgans | θ | LDa(δ) | g0 | g1 | g1c | g2 | g2c |
| D19S221 | .015c | .808 | 8.2 | 14.1 | 22.3 | 13 | 21.2 | ||
| 104 | 1.1 | 2.1 | .021d | .808 | 7.4 | 10.0 | 17.4 | 10 | 17.4 |
| D19S865 | .025c | .618 | 6.9 | 19.0 | 25.9 | 18 | 24.9 | ||
| 208 | 2.6 | .026e | .618 | 6.8 | 18.3 | 25.1 | 18 | 24.8 | |
| D19S413 | .026c | .868 | 6.8 | 5.4 | 12.2 | 5 | 11.8 | ||
| 74 | 1.8 | 3.4 | .034d | .868 | 6.2 | 4.1 | 10.3 | 4 | 10.2 |
g1 is the age calculated by use of equation (2) (Risch et al. 1995); g2 is the age obtained according to the iterative procedure of Reich and Goldstein (1999), when equation (3) is used; g1c and g2c were obtained from equation (4). Iterations stopped at an average distance of ±5×10⁻³ from the corresponding pD value. g0 was calculated by use of equation (5), under the assumptions d=.4 and fd=1/d.
Calculated according to the method of Bengtsson and Thomson (1981): δ=(pD-pN)/(1-pN).
Sex averaged, from Couture et al. (1999).
Estimated on the basis of physical distance (in Mb), by use of the conversion factor 1.9 Mb/cM and Kosambi’s map function.
Estimated by use of radiation-hybrid distance (in cR10,000) of D19S865 from D19S413 (conversion factor 0.2 Mb/cR10,000) and Kosambi’s map function.
It is possible that the age estimated by the two methods is an underestimate: attention has been directed, by several previous reports, to the fact that, when applied to growing populations, the genetic clock ticks more slowly than expected (Luria and Delbrück 1943; Hästbacka et al. 1992; Kaplan et al. 1995; Labuda et al. 1996). This was originally described for mutations in growing bacterial cultures and can be corrected as proposed by Luria and Delbrück (1943). In human population genetics, this correction was first applied in an LD fine-mapping study that used Finnish-population haplotype data to study the diastrophic dysplasia gene (Hästbacka et al. 1992). When genetic distances are available and the unknown parameter is the age of the founder effect, this approach (Labuda et al. 1996; Colombo 2000) sets the genetic clock by introducing a correction factor, g0 (eq. [4]). Given the θ between each marker and the LDLR locus, and under the assumption that d=.4 is the mean AJ population growth rate (Risch et al. 1995; Labuda et al. 1997), the parameter g0 was calculated (table 4) by equation (5). The mean ± SD overall estimates corrected for population growth according to the Luria-Delbrück approach are 18.9±6.6 g (95%CI 13.6–24.2 g) and 18.4±6.4 g (95%CI 13.3–23.5 g), for the ages calculated according to the methods of Risch et al. (1995) and Reich and Goldstein (1999), respectively. However, a common source of uncertainty in the Luria-Delbrück correction of the genetic clock is the value of d. To account for the variability of d, we calculated the geometric mean ± SD of the corrected ages estimated with the extreme values of a reasonable range of AJ population growth rate (.1–.8), 20.6±7.1 g (95%CI 14.9–26.3 g) and 20.1±6.9 g (95%CI 14.6–25.6 g), respectively. Thus, according to the results from the two methods used and with consideration of θ values (from which the results were obtained) as independent estimates, the age of the most recent common ancestor of G197del chromosomes can be estimated as 20 g (95%CI 15–26 g).
The minimum CIs for the estimated age can also be calculated with reference to the variance of the LD index, by use of equation (2), with the approximate CI for δ being derived from var(δ), obtained by equation (1). When the mean θ values for each marker are used, the minimum CIs are 9–33 g (for D19S221), 16–37 g (for D19S865), and 7–16 g (for D19S413). The median value for g (corrected for population growth at d=.4) is 21. As recently pointed out by Diaz et al. (2000), it is difficult to calculate a “true” CI for the estimate of g, because, under the assumption of LD, the mutation-bearing chromosomes are not independent (Risch et al. 1995; Rannala and Slatkin 1998). For convenience, we have been using the term “confidence interval” (here denoted as “CI”), but it is important to appreciate that these calculations are meant to be illustrative of how an estimated demographic parameter (i.e., d) influences confidence and that they cannot be construed as producing the formal CI. Assumptions concerning the population growth rate strongly influence the degree of mutation-bearing chromosomes’ nonindependence and, hence, the CI. Rapid demographic expansion soon after the mutational event (or a bottleneck) leads to greater statistical independence and narrower CIs, whereas a flat demographic curve leads to less independence and broader CIs (Rannala and Slatkin 1998; Goldstein et al. 1999). Thus, the minimum CIs for g calculated by means of the var(δ) are not independent of the CI obtained with the extreme values of a reasonable CI for AJ population growth rate, and it is not evident which of the two CIs reflects more reliably the “true” CI. Further investigations will be necessary to refine an appropriate algorithm to solve the CI problem; however, it is questionable whether its implementation will be either easy or of great benefit (Diaz et al. 2000).
Genotype and Biochemical Phenotype
Despite remarkable changes in climate and diet, no significative difference in PLP, adjusted for sex and age, was observed among index cases clustered according to the three main countries of residence (Israel, South Africa, and Russia) (table 1).
Analysis of ApoE allele frequencies in our sample of patients with FH who have G197del yielded ε2=.105, ε3=.803, and ε4=.092 (for counted alleles [n=152]). The obtained values do not significantly deviate from the frequencies estimated in the normal AJ population (ε2=.058, ε3=.791, and ε4=.151 for n=86 [Tsuda et al. 1994]; p=0.14, 0.62, and 1.36, respectively, corrected according to the method of Bonferroni).
ApoE polymorphism is known to influence PLP (Hagberg et al. 2000). In our sample of patients with FH, no statistically significant effect of ApoE genotype on PLP was observed (table 5). However, in ε4 carriers, baseline TC (345±81 mg/dl) and HDL-C (38±8 mg/dl) are appreciably lower than those in noncarriers (380±90 and 45±13 mg/dl, respectively), and this unexpected result, although devoid of statistical significance (the sample of ε4 carriers and noncarriers is small), nonetheless suggests that the reported hyperlipidemic effect of ε4 in normal subjects does not apply also to patients with FH who have G197del. Sex was a statistically significant factor in the determination of HDL-C levels, with females exhibiting a constantly higher profile (P=.012). As has been reported elsewhere (Leitersdorf et al. 1991), in G197del heterozygotes age is a significant predictor of TG plasma level, with the elderly having a level higher than that in younger individuals (P=.017). A mild age-dependent increase in TC, HDL-C, and LDL-C was observed also.
Table 5.
PLP Traits According to the Absence or Presence of ApoE Allele ε2 and ε3
| ApoE ε2 |
ApoE ε4 |
|||||
| Mean ± SD Concentration(mg/dl) |
Mean ± SD Concentration(mg/dl) |
|||||
| PLP Trait | Absent | Present | P | Absent | Present | P |
| TC | 368.5 ± 90.3 (n=60) | 372.1 ± 85.4 (n=15) | .814 | 373.9 ± 90.1 (n=63) | 344.7 ± 81.0 (n=12) | .241 |
| TG | 147.8 ± 77.6 (n=56) | 153.0 ± 96.8 (n=11) | .705a | 150.2 ± 80.8 (n=57) | 139.6 ± 80.6 (n=10) | .554b |
| HDL-C | 42.8 ± 11.8 (n=55) | 49.3 ± 14.9 (n=11) | .122c | 44.8 ± 12.9 (n=56) | 38.2 ± 8.0 (n=10) | .138c |
| LDL-C | 286.4 ± 76.8 (n=55) | 284.2 ± 76.9 (n=11) | .956 | 288.9 ± 76.5 (n=56) | 269.9 ± 76.6 (n=10) | .446 |
For age, P=.017.
For age, P=.016.
For sex, P=.012.
There is evidence that SR-BI may affect LDL-C and HDL-C metabolism (Acton et al. 1999). However, in our sample of patients with FH, in no instance did SR-BI genotype play a statistically significant role in the determination of PLP (table 6). Again, sex was associated with a borderline statistical significance (P=.049) in the determination of HDL-C, with females exhibiting a constantly higher level except in the subgroup of patients who are homozygous for the common (i.e., wild-type) allele C.
Table 6.
PLP Traits According to SR-BI Genotype
|
Mean ± SD Concentration (mg/dl) of SR-BI Genotype |
|||
| PLP Trait | C,C | C,T | T,T |
| TC | 369.0 ± 100.0 (n = 30) | 369.9 ± 76.0 (n = 20) | 357.5 ± 84.0 (n = 16) |
| TG | 154.1 ± 91.1 (n = 25) | 142.4 ± 59.6 (n = 17) | 128.1 ± 79.2 (n = 15) |
| HDL-C | 40.1 ± 11.7 (n = 24) | 46.1 ± 12.4 (n = 17) | 44.3 ± 14.7 (n = 15) |
| LDL-C | 272.6 ± 74.1 (n = 24) | 299.5 ± 78.2 (n = 17) | 281.1 ± 73.1 (n = 15) |
Discussion
A highly conserved 104-208-74 haplotype—as well as five closely related haplotypes, which vary from the former at one marker only—were identified in 86% of G197del-bearing chromosomes of 79 unrelated families with FH who were from five countries. This finding suggests that most, if not all, G197del chromosomes derive from a single ancestral chromosome on which the mutation arose in a 104-208-74 background.
The presence of G197del chromosomes with haplotypes differing from the conserved one at more than one locus (14% of the families with FH who have G197del) could be explained either by greater decay of the ancestral haplotype in some descent or by recurrent G197del mutation on different haplotypes. The former possibility would imply that the founder mutation had existed earlier in the non-AJ populations and subsequently was introduced, by two or more independent G197del chromosomes, into the AJ population, in which it spread. Although rare, the case of a recurrent 3-bp deletion cannot be excluded. Recently, Klein et al. (1998) reported two identical de novo GAG deletions in the DYT1 gene; the same mutation has arisen a limited number of times throughout the centuries (Valente et al. 1999). However, the discovery that G197del occurs at a high frequency in patients with FH who are of Lithuanian Jewish origin (Meiner et al. 1991) suggests that this mutation may have originated (or been introduced by gene flow) and subjected to earlier expansion in Lithuanian Jewry. To provide further evidence for the hypothesis of a “Lithuanian mutation,” we compared the apparent age of G197del versus the historical and demographic data on eastern-European Jews.
Two different methods of age estimation were used, both of which are based on quantitative analysis of haplotype data for LD decay over time. The first algorithm (Risch et al. 1995), which neglects the contribution of STR mutation rate to the decay of LD, requires three parameters—pD, pN, and θ—that are potential sources of errors due to either sampling bias (in the case of pD and pN) or uncertainty in the estimate (in the case of θ). Significance of LD with respect to observed pD and pN was then assessed by estimation of the difference in allele proportions for each marker (corrected P<.0001). A critical factor in LD methods for dating the age of mutations is the confidence in the θ between the disease locus and the marker: the resulting value for g is very sensitive to fluctuations in θ. Since, because of the short (4 cM) genomic interval, the crossover-based genetic distances between the enlisted markers and the LDLR locus (Couture et al. 1999) are based on a limited number of observed recombinations, θ values were also conveniently derived from physical distances. However, this approach suffers from a source of uncertainty too. The genetic-distance:physical-distance ratio is not uniform along the chromosomes, and an average conversion factor from megabases (or cR) to centimorgans underestimates physical distances close to the centromeres and overestimates them in telomeric regions (Watkins et al. 1994). Even within each region there are remarkable differences between cytogenetic bands, which could be responsible for gross errors in the estimation of θ. In our case, the study by Mohrenweiser et al. (1998), which is based on the incorporation of 180 genetic markers into the metric physical map of human chromosome 19, provided a reliable tool for inference of a definite conversion factor (1.9 cM/Mb) for 19p13.1-p13.2. In addition to the three parameters discussed above, the Markov transition-matrix method (Reich and Goldstein 1999) requires an STR mutation–rate estimate that is not free from uncertainty. In our study, we assumed the μ value given by Weber and Wong (1993) for dinucleotide repeats (i.e., 5.6×10⁻⁴). An order-of-magnitude increase in STR mutation rate (which is probably the case for D19S965) does not substantially change the overall three-marker estimate of g.
The age estimates resulting from the application of the two algorithms, which are different ways of solving the same dynamic system, agree remarkably with each other. This is consistent with the fact that, in our case, θ values are two orders of magnitude higher than the average frequency of mutation at marker loci; thus, the contribution that mutation makes to the breaking of LD over time is comparatively very small. For d=.4 (Risch et al. 1995; Labuda et al. 1997), the Luria-Delbrück correction of the genetic clock yields ages that are 6–8 g older than the uncorrected estimations. However, because of the uncertainty with regard to the AJ population growth rate (d varies from century to century and from settlement to settlement), we preferred to rely on the mean (i.e., 20 g) of the corrected ages estimated by use of d interval (.1–.8) that reflects conservatively the available demographic data. Although the expected coalescence time is independent of the shape of the genealogy, CIs are strongly dependent on the precise shape (Goldstein et al. 1999). Growing populations produce star genealogies, which are not the same as those assumed in the Luria-Delbrück correction, which have regular internode lengths (as pointed out by one of the anonymous reviewers of the present article). However, even if we account for this source of uncertainty, it is striking that the CI for the coalescence time still includes the approximate time of foundation of the ancestral Lithuanian Jewish community (see below).
If it is assumed that g=30 years (Tremblay and Vézina 2000; Sigurgardottir et al. 2000) and that 1960 is the average year of birth of the subjects enlisted in the present study (table 1), the present results would date the most recent common ancestor bearing G197del back to 1360 a.d. (95%CI 1180–1510 a.d), where the CI for the three-markers–based mean estimate relies on the range of AJ population growth rate assumed for the Luria-Delbrück correction. Alternatively, the same coalescence analysis would date back to 1330 a.d. if a median value (i.e., 21 g) for the corrected age is calculated by use of the minimum CIs derived from the variance of LD index (see the Results section
Several disease mutations present in AJ individuals can be traced back to medieval progenitor Jewish populations; these mutations include Bloom syndrome (MIM 210900) blm(Ash), mutations associated with factor XI deficiency (MIM 264900) type II, Gaucher disease (MIM 230800) N370S and 84GG, adenomatous polyposis of the colon (APC [MIM 175100]) I1307K, mutations associated with familial dysautonomia (MIM 223900), the idiopathic torsion dystonia (MIM 128100) DYT1 GAG deletion, and breast-ovarian cancer (MIM 113705) BRCA1 185delAG mutations. LD analyses have suggested that chromosomes bearing some of these mutations identically by descent coalesced in the AJ population around or before the 11th century (Colombo 2000, table 2; Diaz et al. 2000). This is consistent with major AJ bottlenecks occurring during the second half of the first millennium and the beginning of the second one, when the population became established in Europe. Our mutation-dating results suggest that the most recent common ancestor of G197del chromosomes belongs to the first half of the second millennium—that is, the late Middle Ages—when new opportunities for a founder effect were offered by Jewish settlers moving eastward. Despite the methodological limits associated with LD-based age estimation, the present results, taken together with the ancestral Lithuanian AJ origin of most G197del chromosomes, are consistent with the following historically plausible scenario for the origin and spread of the mutation. It is well known that, before the 16th century, AJ individuals preferred to reside in small urban communities (Motulsky 1979). Early migrations of AJ individuals from medieval Germany eastward could have been encouraged by new opportunities related to the rise of towns in the developing new states (Davies 1984). Furthermore, in western Europe the life conditions for Jews soon became unfavorable: persecutions increased during the time of the Crusades and intensified on the occasion of the outburst of bubonic plague (14th century), resulting in the decimation of the Jewish communities. Privileges were granted to Jews in eastern countries—for example, in Kalisz (1264), Cracow (1334), Lesser Poland and Red Russia (1364), and Lithuania (1338). The foundation of the ancestral Jewish community of Lithuania occurred in 1338 a.d. (Ankori 1979). During the 14th century, the G197del LDLR mutation could have been introduced into the chromosomes of the first Lithuanian AJ settlers by either a mutational event or gene flow. The favorable circumstances, which led to the great demographic expansion of AJ individuals in this part of Europe (Davies 1984; Barnavi 1992; Beirnart 1992), were presumably promoted by the establishment of the Jagiellonian commonwealth (Poland, Lithuania, Ukraine, and Belarus) toward the end of the 14th century. The total number of Jews living in Poland and Lithuania around 1500 a.d. is estimated to have been 10,000–12,000 (Weinryb 1972). Such a rapid population growth from a limited number of settlers would have established a founder effect. When Lithuania was conquered by Russian troops during the 17th century, Lithuanian AJ individuals became inhabitants of Russia. It is known that during the following centuries practically all of St. Petersburg’s Jews came from the western territories of the former Russian Empire settled by AJ individuals from Lithuania and Poland (Bershadskyi 1893). Lithuanian Jews lived in a relative cultural and environmental isolation until the turn of the 19th century, when many of them emigrated to South Africa, Great Britain, Australia, America, and Palestine (Gar 1971). The presence of G197del in six unrelated Jewish families with FH who live in England (Gudnason et al. 1993) could be explained by the fact that Great Britain assisted emigration of Jews from Tsarist Russia. Since ∼40,000 Lithuanian immigrants came to South Africa during 1880–1910 and gave rise to most of the local AJ population, it is not surprising that G197del was found in 8 of 10 FH cases in the local Jewish community (Meiner et al. 1991). The same argument applies to Israel, where hundreds of thousands of Jews from eastern Europe settled after the World War II, thus introducing G197del by gene flow from multiple independent families with FH. Therefore, the estimated age of the G197del LDLR mutation, the origin and geographic distribution of families with FH, and the history of eastern-European AJ individuals are consistent with the hypothesis that the mutation originated (or was originally introduced) and has been subjected to earlier expansion in Lithuania.
The high frequencies of certain single-locus genetic diseases in the AJ population has long been a subject of interest (Goodman and Motulsky 1979). However, the underlying genetic mechanism(s) accounting for their elevated prevalence remains controversial. Some authors have attributed this epidemiological figure to the demographic upheavals thought to have occurred during or shortly after the 16th and 17th centuries: the founder effect resulted from the AJ population’s extraordinary growth after a fortuitous introduction of disease alleles into a relatively small group of individuals from whom present-day the AJ individuals have descended (Risch et al. 1995). Other investigators have suggested that a heterozygote selective advantage has been the operative genetic mechanism (Myrianthopoulos et al. 1972; Petersen et al. 1983; Diamond 1994; Zoossmann-Diskin 1995). For Tay-Sachs (MIM 272800) and other recessive lysosomal storage disorders, it has been speculated that heterozygotes may have an increased resistance to some infectious diseases—for example, tuberculosis. Although this suggestion is attractive and although some geographic distributions of allele frequencies appear to support, in part, the argument of positive selection, a clear biological benefit of heterozygosity for these (Jorde 1992) and other (Högenauer et al. 2000) mutations is difficult to document. Genetic drift in a population ancestral to AJ individuals remains a third possibility (Goldstein et al. 1999), and the recent finding that a common N370S allele, causing Gaucher disease type 1, is concurrently present in the AJ population and in the neighboring non-Jewish European populations allows some inferences to be drawn (Diaz et al. 2000).
For diseases in the AJ population, the study of the origin and spread of an autosomal dominant mutation offers an advantage over the investigation of recessive disorders such as Tay-Sachs disease or Gaucher disease. The distinct opportunity derives from the consideration that heterozygote selective advantage does not operate in this case: dominant pathological mutations are subject to direct selection over disease phenotype. This opportunity has been exploited already by Risch et al. (1995), who studied the DYTAJ mutation causing idiopathic torsion dystonia in AJ individuals. Unfortunately, the DYTAJ model is complicated by the highly variable expression of the gene, since only a small proportion of carriers manifest a severe form of the disease. If both mild and severe cases are included, the overall penetrance is ∼30% (Bressman et al. 1989; Risch et al. 1990). According to Risch et al. (1995, p. 156), “perhaps only a third of those with clinical symptoms would be categorized as severely affected,” and only “severely affected individuals tend not to reproduce.” Other autosomal dominant AJ diseases—for example, BRCA1, BRCA2, and APC—show reduced penetrance as well.
The G197del LDLR mutation causes clinically manifested FH both in heteroallelic status and in homoallelic status (although the latter is rare—our Piscataway index case is the only patient described so far), and its biochemical phenotype is easily quantifiable. Ninety-four percent of the heterozygotes (n=98) in our G197del-FH register (i.e., index cases and their G197del-positive family members) were hypercholesterolemic (LDL-C >160 mg/dl), and there is no significant difference in the mean PLP of patients with FH who have G197del and are from the three main countries of residence (Israel, South Africa, and Russia), whose geographic characteristics, dietary habits, and lifestyles are remarkably different. These findings are consistent with a disease mutation with both a high degree of penetrance and independence of major environmental effects. This is not always the case for LDLR mutations causing FH (Moorjani et al. 1993; Bertolini et al. 2000). We have no clear-cut explanation of the discrepancy between our results and those of the study by Pimstone et al. (1998), who compared PLPs in Chinese subjects with FH and defined LDLR mutations who were living in China and Canada. Higher LDL-C levels, apparently not linked to a different functional class of LDLR mutations, were observed in FH heterozygotes residing in Canada than were seen in FH heterozygotes living in China. These differences were ascribed, at least in part, to the striking contrast, both in dietary lipids and in physical-exercise level, between the two groups of patients.
The frequency distribution of ApoE alleles ε2–ε4 in our sample of G197del carriers was similar to that found in the general AJ population (Tsuda et al. 1994). This observation confirms the lack of difference in ApoE allele distribution among patients with FH from Europe and North America who have been reported elsewhere (O’Malley and Illingworth 1990; De Knijff et al. 1990; Dallongeville et al. 1991; Carmena-Ramón et al. 2000). By contrast, Eto et al. (1988) described a higher frequency of ε4 in Japanese patients with FH, which may reflect specific genetic differences between Asian and white population samples with FH. The lack of association between ApoE polymorphism and G197del is consistent both with the genetic distance between ApoE and the LDLR locus (45 cM) and with the hypothesis that the founder mutation arose on the most common haplotype (i.e., ε3) in the AJ population. The effect of ApoE genotype on basal plasma-lipid levels has been studied in different populations. In some studies of subjects without FH, ε4 carriers showed the highest plasma TC and LDL-C levels, whereas lowest levels were found in ε2 carriers (reviewed in Hagberg et al. 2000). Our results suggest that ApoE polymorphism does not significantly contribute to variations in plasma baseline TC or LDL-C in patients who are heterozygous for G197del. The lack of statistical significance is likely due to the small sample of ApoE subgroups. Our finding is in contrast with those of Eto et al. (1988) in Japan, Ward et al. (1996) in northern Ireland, and Bertolini et al. (2000) in Italy, who found, among ε4 carriers, significantly higher plasma levels in individuals who are heterozygous for FH, but it is consistent with those of Carmena-Ramón et al. (2000) in Spain and other investigators in Europe and North America, including a study of 112 unrelated French Canadian FH heterozygotes with a class I (null allele) 10-kb deletion in the LDLR 5′ region (Bétard et al. 1996). Taken together with the absence of evidence for significant country-dependent difference in FH baseline PLPs (our data) and the observation that, in contrast to subjects without FH, in patients with FH the individual response to changes in dietary lipids is not affected by their ApoE genotype (Carmena-Ramón et al. 2000), the results of the present study are consistent with the hypothesis that the impact of severe mutations at the LDLR locus could prevail over genetic factors and genetically modified response to environmental changes. This is true also for the SR-BI polymorphism, which does not appear to modify plasma LDL-C levels in our sample of patients with FH. The present study cannot be considered in any sense a systematic screen for genetic modifiers of the biochemical effect of G197del; further investigations should shed light on whether the “right modifiers” exist. We may therefore conclude that both the environmental factors and the candidate modifying genes analyzed in the present study do not affect to a significant extent the phenotypic expression of G197del FH, which appears to be a severe, highly penetrant inherited disease in AJ individuals. Nevertheless, we cannot exclude the possibility that the G197del LDLR mutation and other common mutations in AJ individuals may be endowed with some selective advantage that is not linked to known functions of the expressed proteins; however, so far, this remains, in practice, an unverifiable speculation.
Taken as a whole, the evidence presented in this and other studies suggests that heterozygote advantage is not essential for a mutation to cause elevated disease incidence among contemporary AJ individuals. The evidence also strengthens the importance of consideration of the founder effect in a population rapidly expanding from a limited number of families, as a simple, parsimonious hypothesis to explain the spread of recent mutations in the AJ population. However, the role of positive selection due to some heterozygote advantages or genetic factors modifying the response of a mutation’s carriers to historical or local environmental constraints cannot be generally dismissed without proof.
Acknowledgments
This study was supported by a grant from the Sarah and Moshe Mayer Research Foundation (to E.L.). We thank Helen H. Hobbs (Dallas) for having supplied the DNA sample from the patient homozygous for FH, as well as for insightful comments on the manuscript, and we thank Angelo A. Bignamini (Milan) for advice regarding statistical analysis.
Electronic-Database Information
Accession numbers and URLs for data in this article are as follows:
- GeneMap’99, http://www.ncbi.nlm.nih.gov/genemap99 (for radiation-hybrid distance)
- Genome Database, The, http://www.gdb.org (for D19S221 [accession number 188431], D19S865 [accession number 602894], and D19S413 [accession number 199839])
- LDLR Database, http://www.umd.necker.fr/LDLR/database.html (for LDLR mutations)
- Low Density Lipoprotein Receptor (LDLR) Gene in Familial Hypercholesterolemia, The, http://www.ucl.ac.uk/fh (for LDLR mutations)
- Maps of Human Chromosome 19, http://bbrp.llnl.gov/bbrp/genome/html/chrom_map.html (for θ values)
- Online Mendelian Inheritance in Man (OMIM), http://www.ncbi.nlm.nih.gov/Omim/ (for FH [MIM 143890], Tay-Sachs disease [MIM 272800], Gaucher disease [MIM 230800], idiopathic torsion dystonia [MIM 128100], breast cancer types 1 [MIM 113705] and 2 [MIM 600185], APC [MIM 175100], Bloom syndrome [MIM 210900], factor XI deficiency [MIM 264900], and familial dysautonomia [MIM 223900])
References
- Aalto-Setala K, Koivisto U-M, Miettinen TA, Gylling H, Kesaniemi YA, Savolainen M, Pyorala K, Ebeling T, Mononen I, Turtola H, Viikari J, Kontula K (1992) Prevalence and geographical distribution of major LDL receptor gene rearrangements in Finland. J Intern Med 231:227–234 [DOI] [PubMed] [Google Scholar]
- Acton S, Osgood D, Donoghue M, Corella D, Pocovi M, Cenarro A, Mozas P, Keitly J, Squazzo S, Woolf EA, Ordovas JM (1999) Association of polymorphisms at the SR-BI gene locus with plasma lipid levels and body mass index in a White population. Arterioscler Thromb Vasc Biol 19:1734–1743 [DOI] [PubMed] [Google Scholar]
- Ankori Z (1979) Origins and history of Ashkenazi Jewry (8th to 18th century). In: Goodman RM, Motulsky AG (eds) Genetic diseases among Ashkenazi Jews. Raven Press, New York, pp 19–46 [Google Scholar]
- Barnavi E (ed) (1992) A historical atlas of the Jewish people. Schocken Books, New York [Google Scholar]
- Beirnart H (1992) Atlas of medieval Jewish history, Simon & Schuster, New York [Google Scholar]
- Bengtsson BO, Thomson G (1981) Measuring the strength of associations between HLA antigens and diseases. Tissue Antigens 18:356–363 [DOI] [PubMed] [Google Scholar]
- Bershadskyi S (1893) Jews in Lithuania. In: Arsenjev KK, Petrovski FF (eds) Encyclopedic dictionary (in Russian). Vol 11. Brockhaus-Efron, St Petersburg, pp 453–454 [Google Scholar]
- Bertolini S, Cantafora A, Averna M, Cortese C, Motti C, Martini S, Pes G, Postiglione A, Stefanutti C, Blotta I, Pisciotta L, Rolleri M, Langheim S, Ghisellini M, Rabbone I, Calandra S (2000) Clinical expression of familial hypercholesterolemia in clusters of mutations of the LDL receptor gene that cause a receptor-defective or receptor-negative phenotype. Arterioscler Thromb Vasc Biol 20:E41–E52 [DOI] [PubMed] [Google Scholar]
- Bétard C, Kessling AM, Roy M, Davignon J (1996) Influence of genetic variability in the nondeletion LDL-receptor allele on phenotypic variation in French-Canadian familial hypercholesterolemia heterozygotes sharing a ‘null’ LDL-receptor gene defect. Atherosclerosis 119:43–55 [DOI] [PubMed] [Google Scholar]
- Bressman SB, de Leon D, Brin MF, Risch N, Burke RE, Greene PE, Shale H, Fahn S (1989) Idiopathic dystonia among Ashkenazi Jews: evidence for autosomal dominant inheritance. Ann Neurol 26:612–620 [DOI] [PubMed] [Google Scholar]
- Carmena-Ramón R, Real JT, Ascaso JF, Ordovas JM, Carmena R (2000) Effect of apolipoprotein E genotype on lipid levels and response to diet in familial hypercholesterolemia. Nutr Metab Cardiovasc Dis 10:7–13 [PubMed] [Google Scholar]
- Colombo R (2000) Age estimate of the N370S mutation causing Gaucher disease in Ashkenazi Jews and European populations: a reappraisal of haplotype data. Am J Hum Genet 66:692–697 [DOI] [PMC free article] [PubMed] [Google Scholar]
- Colombo R, Carobene A (2000) Age of the intronic GAA triplet repeat expansion mutation in Friedreich ataxia. Hum Genet 106:455–458 [DOI] [PubMed] [Google Scholar]
- Couture P, Morissette J, Gaudet D, Vohl M-C, Gagné C, Bergeron J, Després J-P, Simard J (1999) Fine mapping of low-density lipoprotein receptor gene by genetic linkage on chromosome 19p13.1-p13.3 and study of the founder effect of four French Canadian low-density lipoprotein receptor gene mutations. Atherosclerosis 143:145–151 [DOI] [PubMed] [Google Scholar]
- Dallongeville J, Roy M, Leboeuf N, Xhignesse M, Davignon J, Lussier-Cacan S (1991) Apolipoprotein E polymorphism association with lipoprotein profile in endogenous hypertriglyceridemia and familial hypercholesterolemia. Arterioscler Thromb 11:272–278 [DOI] [PubMed] [Google Scholar]
- Daniel WW (1995) Biostatistics: a foundation for analysis in the health sciences, 6th ed. Wiley & Sons, New York, pp 139–140, 175 [Google Scholar]
- Davies N (1984) God’s playground: a history of Poland. Columbia University Press, New York [Google Scholar]
- De Knijff P, Stalenhoef AF, Mol MJ, Gevers Leuven JA, Smit J, Erkelens DW, Schouten J, Frants RR, Havekes LM (1990) Influence of apo E polymorphism on the response to simvastatin treatment in patients with heterozygous familial hypercholesterolemia. Atherosclerosis 83:89–97 [DOI] [PubMed] [Google Scholar]
- Diamond JM (1994) Jewish lysosomes. Nature 368:291–292 [DOI] [PubMed] [Google Scholar]
- Diaz GA, Gelb BD, Risch N, Nygaard TG, Frisch A, Cohen IJ, Miranda CS, Amaral O, Maire I, Poenaru L, Caillaud C, Weizberg M, Mistry P, Desnick RJ (2000) Gaucher disease: the origins of the Ashkenazi Jewish N370S and 84GG acid β-glucosidase mutations. Am J Hum Genet 66:1821–1832 [DOI] [PMC free article] [PubMed] [Google Scholar]
- Eto M, Watanabe K, Chonan N, Ishii K (1988) Familial hypercholesterolemia and apolipoprotein E4. Atherosclerosis 72:123–128 [DOI] [PubMed] [Google Scholar]
- Friedewald WT, Levy RI, Fredrickson DS (1972) Estimation of the concentration of low-density lipoprotein cholesterol in plasma, without use of the preparative ultracentrifuge. Clin Chem 18:499–502 [PubMed] [Google Scholar]
- Gar J (1971) Lithuania. In: Berman MM, Carlebach (eds) Judaica encyclopedia. Keter, Jerusalem, pp 362–390 [Google Scholar]
- Geisel J, Holzem G, Oette K (1995) Screening for mutations in exon 4 of the LDL receptor gene in a German population with severe hypercholesterolemia. Hum Genet 96:301–304 [DOI] [PubMed] [Google Scholar]
- Goldstein DB, Pollock DD (1997) Launching microsatellites: a review of mutation process and methods of phylogenetic inference. J Hered 88:335–342 [DOI] [PubMed] [Google Scholar]
- Goldstein DB, Reich ED, Bradman N, Usher S, Seligsohn U, Peretz H (1999) Age estimates of two common mutations causing factor XI deficiency: recent genetic drift is not necessary for elevated disease incidence among Ashkenazi Jews. Am J Hum Genet 64:1071–1075 [DOI] [PMC free article] [PubMed] [Google Scholar]
- Goldstein JL, Brown MS, Anderson RGW, Russell DW, Schneider WJ (1985) Receptor-mediated endocytosis: concepts emerging from the LDL receptor system. Annu Rev Cell Biol 1:1–39 [DOI] [PubMed] [Google Scholar]
- Goldstein JL, Hobbs HH, Brown MS (1995) Familial hypercholesterolemia. In: Scriver CR, Beaudet AL, Sly WS, Valle D (eds) The metabolic and molecular bases of inherited disease, 7th ed. McGraw-Hill, New York, pp 1981–2030 [Google Scholar]
- Goodman RM, Motulsky A (eds) (1979) Genetic diseases among Ashkenazi Jews. Raven Press, New York [Google Scholar]
- Gudnason V, King-Underwood L, Seed M, Sun X-M, Soutar AK, Humphries SE (1993) Identification of recurrent and novel mutations in exon 4 of LDL receptor gene in patients with familial hypercholesterolemia in the United Kingdom. Arterioscler Thromb 13:56–63 [DOI] [PubMed] [Google Scholar]
- Guo S-W, Xiong M (1997) Estimating the age of mutant disease alleles based on linkage disequilibrium. Hum Hered 47:315–337 [DOI] [PubMed] [Google Scholar]
- Hagberg JM, Wilund KR, Ferrell RE (2000) APO E gene and gene-environment effects on plasma lipoprotein-lipid levels. Physiol Genomics 4:101–108 [DOI] [PubMed] [Google Scholar]
- Hästbacka J, de la Chapelle A, Kaitila I, Sistonen P, Weaver A, Lander E (1992) Linkage disequilibrium mapping in isolated founder populations: diastrophic dysplasia in Finland. Nat Genet 2:204–211 [DOI] [PubMed] [Google Scholar]
- Heath KE, Gahan M, Whittall RA, Humphries SE (2001) Low-density lipoprotein receptor gene (LDLR) world-wide website in familial hypercholesterolaemia: update, new features and mutation analysis. Atherosclerosis 154:243–246 [DOI] [PubMed] [Google Scholar]
- Hixson JE, Vernier DT (1990) Restriction isotyping of human apolipoprotein E by gene amplification and cleavage with HhaI. J lipid Res 31:545–548 [PubMed] [Google Scholar]
- Hobbs HH, Russell DW, Brown MS, Goldstein JL (1990) The LDL receptor locus in familial hypercholesterolemia: mutational analysis of a membrane protein. Annu Rev Genet 24:133–170 [DOI] [PubMed] [Google Scholar]
- Högenauer C, Santa Ana CA, Porter JL, Millard M, Gelfand A, Rosenblatt RL, Prestidge CB, Fordtran JS (2000) Active intestinal chloride secretion in human carriers of cystic fibrosis mutations: an evaluation of the hypothesis that heterozygotes have subnormal active intestinal chloride secretion. Am J Hum Genet 67:1422–1427 [DOI] [PMC free article] [PubMed] [Google Scholar]
- Iwaki K, Nakajima T, Ota N, Emi M (1999) A common Ile796Val polymorphism of the human SREBP cleavage-activating protein (SCAP) gene. J Hum Genet 44:421–422 [DOI] [PubMed] [Google Scholar]
- Jorde LB (1992) Genetic diseases in the Ashkenazi population: evolutionary considerations. In: Bonné-Tamir B, Adam A (eds) Genetic diversity among Jews: diseases and markers at the DNA level. Oxford University Press, New York, pp 305–318 [Google Scholar]
- Kaplan NL, Hill WG, Weir BS (1995) Likelihood methods for locating disease genes in nonequilibrium populations. Am J Hum Genet 56:18–32 [PMC free article] [PubMed] [Google Scholar]
- Klein C, Brin MF, de Leon D, Limborska SA, Ivanova-Smolenskaya IA, Bressman SB, Fiedman A, Markova ED, Risch NJ, Breakefield XO, Ozelius LJ (1998) De novo mutations (GAG deletion) in the DYT1 gene in two non-Jewish patients with early-onset dystonia. Hum Mol Genet 7:1133–1136 [DOI] [PubMed] [Google Scholar]
- Koivisto U-M, Turtola H, Aalto-Setala K, Top B, Frants RR, Kovanen PT, Syvanen A-C, Kontula K (1992) The familial hypercholesterolemia (FH)-North Karelia mutation of the low density lipoprotein receptor gene deletes seven nucleotides of exon 6 and is a common cause of FH in Finland. J Clin Invest 90:219–228 [DOI] [PMC free article] [PubMed] [Google Scholar]
- Kotze MJ, Langenhoven E, Warnich L, du Plessis L, Retief AE (1991) The molecular basis and diagnosis of familial hypercholesterolaemia in South African Afrikaners. Ann Hum Genet 55:115–121 [DOI] [PubMed] [Google Scholar]
- Labuda M, Labuda D, Korab-Laskowska M, Cole DE, Zietkiewicz E, Weissenbach J, Popowska E, Pronicka E, Root AW, Glorieux FH (1996) Linkage disequilibrium analysis in young populations: pseudo-vitamin D-deficiency rickets and the founder effect in French Canadians. Am J Hum Genet 59:633–643 [PMC free article] [PubMed] [Google Scholar]
- Labuda D, Zietkiewicz, Labuda M (1997) The genetic clock and the age of the founder effect in growing populations: a lesson from French Canadians and Ashkenazim. Am J Hum Genet 61:768–771 [PMC free article] [PubMed] [Google Scholar]
- Landsberger D, Meiner V, Reshef A, Levy Y, van der Westhuyzen DR, Coetzee GA, Leitersdorf E (1992) A nonsense mutation in the LDL receptor gene leads to familial hypercholesterolemia in the Druze sect. Am J Hum Genet 50:427–433 [PMC free article] [PubMed] [Google Scholar]
- Lazzeroni LC (1998) Linkage disequilibrium and gene mapping: an empirical least-squares approach. Am J Hum Genet 62:159–170 [DOI] [PMC free article] [PubMed] [Google Scholar]
- Lehesjoki AE, Koskiniemi M, Norio R, Tirrito S, Sistonen P, Lander E, de la Chapelle A (1993) Localization of the EPM1 gene for progressive myoclonus epilepsy on chromosome 21: linkage disequilibrium allows high resolution mapping. Hum Mol Genet 2:1229–1234 [DOI] [PubMed] [Google Scholar]
- Lehrman MA, Schneider WJ, Brown MS, Davis CG, Elhammer A, Russell DW, Goldstein JL (1987) The Lebanese allele at the low density lipoprotein receptor locus: nonsense mutation produces truncated receptor that is retained in endoplasmic reticulum. J Biol Chem 262:401–410 [PubMed] [Google Scholar]
- Leitersdorf E, Friedlander Y, Bard JM, Fruchart JC, Eisenberg S, Stein Y (1991) Diverse effect of ethnicity on plasma lipoprotein[a] levels in heterozygote patients with familial hypercholesterolemia. J Lipid Res 32:1513–1519 [PubMed] [Google Scholar]
- Leitersdorf E, Tobin EJ, Davignon J, Hobbs, HH (1990) Common low-density lipoprotein receptor mutations in the French Canadian population. J Clin Invest 85:1014–1023 [DOI] [PMC free article] [PubMed] [Google Scholar]
- Loubser O, Marais AD, Kotze MJ, Godenir N, Thiart R, Scoltz CL, de Villiers JN, Hillermann R, Firth JC, Weich HF, Maritz F, Jones S, van der Westhuyzen DR (1999) Founder mutations in the LDL receptor gene contribute significantly to the familial hypercholesterolemia phenotype in the indigenous South African population of mixed ancestry. Clin Genet 55:340–345 [DOI] [PubMed] [Google Scholar]
- Luria SE, Delbrück M (1943) Mutations of bacteria from virus sensitivity to virus resistance. Genetics 28:491–511 [DOI] [PMC free article] [PubMed] [Google Scholar]
- Mandelshtam M, Chakir K, Shevtsov S, Golubkov V, Skobeleva N, Lipovetsky B, Konstantinov V, Denisenko A, Gaitskhoki V Schwartz E (1998) Prevalence of Lithuanian mutation among St. Petersburg Jews with familial hypercholesterolemia. Hum Mutat 12:255–258 [DOI] [PubMed] [Google Scholar]
- Meiner V, Landsberger D, Berkman N, Reshef A, Segal P, Seftel HC, van der Westhuyzen DR, Jeenah MS, Coetzee GA, Leitersdorf E (1991) A common Lithuanian mutation causing familial hypercholesterolemia in Ashkenazi Jews. Am J Hum Genet 49:443–449 [PMC free article] [PubMed] [Google Scholar]
- Mohrenweiser HW, Tsujimoto S, Gordon L, Olsen AS (1998) Regions of sex-specific hypo- and hyper-recombination identified through integration of 180 genetic markers into the metric physical map of human chromosome 19. Genomics 47:153–162 [DOI] [PubMed] [Google Scholar]
- Moorjani S, Roy M, Gagné C, Davignon J, Brun D, Toussaint M, Lambert M, Campeau L, Blaichman S, Lupien P (1989) Homozygous familial hypercholesterolemia among French Canadians in Québec province. Arteriosclerosis 9:211–216 [DOI] [PubMed] [Google Scholar]
- Moorjani S, Roy M, Torres A, Betard C, Gagne C, Lambert M, Brun D, Davignon J, Lupien P (1993) Mutations of low-density-lipoprotein-receptor gene, variation in plasma cholesterol, and expression of coronary heart disease in homozygous familial hypercholesterolaemia. Lancet 341:1303–1306 [DOI] [PubMed] [Google Scholar]
- Motulsky AG (1979) Possible selective effects of urbanization on Ashkenazi Jews. In: Goodman RM, Motulsky AG (eds) Genetic diseases among Ashkenazi Jews. Raven Press, New York, pp 301–312 [Google Scholar]
- Myrianthopoulos NC, Naylor AF, Aronson SM (1972) Founder effect in Tay-Sachs disease unlikely. Am J Hum Genet 24:341–342 [PMC free article] [PubMed] [Google Scholar]
- O'Malley JP, Illingworth DR (1990) The influence of apolipoprotein E phenotype on the response to lovastatin therapy in patients with heterozygous familial hypercholesterolemia. Metabolism 39:150–154 [DOI] [PubMed] [Google Scholar]
- Petersen GM, Rotter JI, Cantor RM, Field LL, Grenwald S, Lim JS, Roy C, Schoenfeld V, Lowden JA, Kaback MM (1983) The Tay-Sachs disease gene in North American Jewish populations: geographic variations and origin. Am J Hum Genet 35:1258–1269 [PMC free article] [PubMed] [Google Scholar]
- Pimstone SN, Sun XM, du Souich C, Frohlich JJ, Hayden MR, Soutar AK (1998) Phenotypic variation in heterozygous familial hypercholesterolemia: a comparison of Chinese patients with the same or similar mutations in the LDL receptor gene in China or Canada. Arterioscler Thromb Vasc Biol 18:309–315 [DOI] [PubMed] [Google Scholar]
- Rannala B, Slatkin M (1998) Likelihood analysis of disequilibrium mapping and related problems. Am J Hum Genet 62:459–473 [DOI] [PMC free article] [PubMed] [Google Scholar]
- Reich DE, Goldstein DB (1999) Estimating the age of mutations using variation at linked markers. In: Goldstein GB, Schlötterer C (eds) Microsatellites: evolution and applications. Oxford University Press, Oxford, pp 129–138 [Google Scholar]
- Risch N, Bressman SB, deLeon D, Brin MF, Burke RE, Greene PE, Shale H, Claus EB, Cupples LA, Fahn S (1990) Segregation analysis of idiopathic torsion dystonia in Ashkenazi Jews suggests autosomal dominant inheritance. Am J Hum Genet 46:533–538 [PMC free article] [PubMed] [Google Scholar]
- Risch N, de Leon D, Ozelius L, Kramer P, Almasy L, Singer B, Fahn S, Breakefield X, Bressman S (1995) Genetic analysis of idiopathic torsion dystonia in Ashkenazi Jews and their recent descent from a small founder population. Nat Genet 9:152–159 [DOI] [PubMed] [Google Scholar]
- Seftel HC, Baker SG, Jenkins T, Mendelson D (1989) Prevalence of familial hypercholesterolemia in Johannesburg Jews. Am J Med Genet 34:545–547 [DOI] [PubMed] [Google Scholar]
- Sigurgardottir S, Helgason A, Gulcher JR, Stefansson K, Donnelly P (2000) The mutation rate in the human mtDNA control region. Am J Hum Genet 66:1599–1609 [DOI] [PMC free article] [PubMed] [Google Scholar]
- Slimane MN, Pousse H, Maatoug F, Hammami M, Ben-Farhat MH (1993) Phenotypic expression of familial hypercholesterolaemia in central and southern Tunisia. Atherosclerosis 104:153–158 [DOI] [PubMed] [Google Scholar]
- Steyn K, Weight MJ, Dando BR, Christopher KJ, Rossouw JE (1989) The use of low density lipoprotein receptor activity of lymphocytes to determine the prevalence of familial hypercholesterolemia in a rural South African community. J Med Genet 26:32–36 [DOI] [PMC free article] [PubMed] [Google Scholar]
- Südhof TC, Goldstein JL, Brown MS, Russell DW (1985) The LDL receptor gene: a mosaic of exons shared with different proteins. Science 228:815–822 [DOI] [PMC free article] [PubMed] [Google Scholar]
- Tremblay M, Vézina H (2000) New estimates of intergenerational time intervals for the calculation of age of origins of mutations. Am J Hum Genet 66:651–658 [DOI] [PMC free article] [PubMed] [Google Scholar]
- Tsuda T, Lopez R, Rogaeva EA, Freedman M, Rogaev E, Drachman D, Pollen D, Haines J, Liang Y, McLachlan DR, Duara R, St George-Hyslop P (1994) Are the associations between Alzheimer's disease and polymorphisms in the apolipoprotein E and the apolipoprotein CII genes due to linkage disequilibrium? Ann Neurol 36:97–100 [DOI] [PubMed] [Google Scholar]
- Valente EM, Povey S, Warner TT, Wood NW, Davis MB (1999) Detailed haplotype analysis in Ashkenazi Jewish and non-Jewish British dystonic patients carrying the GAG deletion in the DYT1 gene: evidence for a limited number of founder mutations. Ann Hum Genet 63:1–8 [DOI] [PubMed] [Google Scholar]
- Varret M, Rabes J-P, Thiart R, Kotze J, Baron H, Cenarro A, Descamps O, Ebhart M, Hondelijn J-C, Kostner GM, Miyake Y, Pocovi M, Schmidt H, Schmidt H, Schuster H, Stuhrmann M, Yamamura T, Junien C, Béroud C, Boileau C (1998) LDLR database (second edition): new additions to the database and the software, and results of the first molecular analysis. Nucleic Acids Res 26:248–252 [DOI] [PMC free article] [PubMed] [Google Scholar]
- Ward AJ, O’Kane M, Nicholls DP, Young IS, Nevin NC, Graham CA (1996) A novel single base deletion in the LDLR gene (311delG): effect on serum lipid profiles and the influence of other genetic polymorphisms in the ACE, APOE and APOB genes. Atherosclerosis 120:83–91 [DOI] [PubMed] [Google Scholar]
- Watkins WS, Zenger R, O’Brien E, Nyman D, Eriksson AW, Renlund M, Jorde B (1994) Linkage disequilibrium patterns vary with chromosomal location: a case study from the von Willebrand factor region. Am J Hum Genet 55:348–355 [PMC free article] [PubMed] [Google Scholar]
- Weber JL, Wong C (1993) Mutation of human short tandem repeats. Hum Mol Genet 2:1123–1128 [DOI] [PubMed] [Google Scholar]
- Weinryb BD (1972) The Jews of Poland: a social and economic history of the Jewish community in Poland from 1100 to 1800. Jewish Publication Society of America, Philadelphia [Google Scholar]
- Zoossmann-Diskin A (1995) ITD in Ashkenazi Jews: genetic drift or selection? Nat Genet 11:13–14 [DOI] [PubMed] [Google Scholar]