

Abstract
The high attrition rate of drug candidates in clinical trials underscores the urgent need for more predictive preclinical models that accurately replicate human physiology. Traditional two-dimensional (2D) cell cultures and animal models often fail to predict human responses due to their limited physiological relevance. This highlights the need for modeling and measurements of multiorgan interactions at higher throughput prompting the development of multiorgan-on-a-plate (MOAP) platforms. Here, we present OrganRX™, a modular, gravity-driven recirculation-based MOAP system designed to imitate human organ function, fluid dynamics, and inter-organ communication in vitro. The platform based on Fluidic Programmable Gravi-maze Array (FPGA) integrates multiple organ types—gut, liver, kidney, brain, and endothelium—within a microfluidic architecture that replicates physiological shear stress and unidirectional flow. Using computational fluid dynamics (CFD) simulations and impedance-based flow validation, we confirmed accurate shear control across organ compartments. Organ-specific and multiorgan models were constructed with 3D extracellular matrix hydrogels and assessed for metabolism and senescence. Liver-kidney co-cultures demonstrated metabolic interplay via differential albumin and urea production. Additionally, in drug response studies, phenylbutyrate (PB) alone reduced brain ROS in a gut-brain model, while subsequent treatment with curcumin (C) unexpectedly reversed this benefit, revealing context-specific drug interactions not observable in isolated organ models. Overall, the FPGA trademarked as OrganRX™ offers a physiologically relevant, scalable, and automation-compatible platform for preclinical drug evaluation and disease modeling. Its ability to capture complex, dynamic inter-organ effects positions it as a powerful tool for advancing translational research and precision medicine.
Introduction
The pharmaceutical industry faces significant challenges in advancing novel therapeutics from preclinical studies to clinical trials1–4, a critical stage in drug development, serves to evaluate the efficacy, safety, and pharmacokinetics of compounds before they can be tested in humans. Unfortunately, traditional preclinical models such as two-dimensional (2D) cell cultures and animal testing have consistently demonstrated poor predictive accuracy of human drug responses5,6. This has resulted in a staggering 90% failure rate for drug candidates in clinical trials, where unexpected toxicities and inadequate therapeutic efficacy become apparent only after considerable financial and time investments7. The limitations of 2D cell cultures stem from their inability to mimic the complexity of human tissue architecture and the microenvironment, leading to oversimplified models of cellular interactions and drug responses8. Animal models9, while offering some systemic insights, often fail to accurately replicate human physiology due to interspecies differences. This lack of translatability from animal models to human outcomes has contributed significantly to the inefficiency of the drug development pipeline, driving the need for more predictive, human-relevant preclinical models10,11.
To address these deficiencies, multiorgan-on-a-chip (MOOC) systems have emerged as promising tools to replicate human organ functions and inter-organ interactions more accurately in vitro12–14. MOOC platforms combine microfluidic technology with tissue engineering to create physiologically relevant models of human organ systems, enabling the study of complex biological processes15,16 such as drug metabolism, toxicity, and multi-organ pharmacokinetics. These systems offer distinct advantages over conventional models, including the ability to simulate dynamic fluid flow, shear stress, and nutrient transport, all of which are critical for maintaining the viability and functionality of human tissues in vitro17,18. However, despite their promise, current MOOC technologies still face significant limitations. A major challenge lies in recreating the intricate physical and biochemical cues that govern cellular behavior in vivo. Accurate simulation of fluid dynamics, particularly the shear stress and pressure conditions experienced by cells in different organs, remains technically challenging due to the need for precise control over microfluidic flows and pressure gradients19–21. Moreover, the scaling of MOOC platforms for high-throughput drug screening applications remains an unresolved issue. While some platforms have demonstrated the ability to model single organs with reasonable accuracy, the integration of multiple organ systems into a unified, scalable platform has proven difficult22. Each organ has unique physiological needs, and replicating the microenvironments necessary to sustain multiple organ types within the same system presents substantial technical hurdles23. Furthermore, many existing MOOC platforms lack the robustness and reproducibility required for widespread adoption in pharmaceutical R&D, with significant variability in results across experiments24.
Early iterations of organ-on-a-chip platforms primarily utilized 2D cell culture techniques within microfluidic systems, allowing for the controlled delivery of nutrients, gases, and other factors necessary for cell survival25. As the field matured, advances in tissue engineering, biomaterials, and microfabrication techniques enabled the development of more sophisticated organ models that could more accurately replicate in vivo organ function..
Building on these foundational advancements, multiorgan platforms were developed to address the need for studying systemic drug effects. Multiorgan-on-a-chip systems aim to replicate the complex interactions between different organs involved in processes such as drug absorption, distribution, metabolism, and excretion (ADME)26. These platforms often incorporate liver, kidney, heart, and lung models to evaluate drug candidates’ effects across multiple organ systems simultaneously27. While these systems have demonstrated significant potential in providing a more holistic view of drug effects, their widespread application in preclinical drug testing remains limited by the challenges discussed earlier, including scalability, robustness, and the accurate simulation of human physiological conditions28.
Despite remarkable progress, several challenges continue to impede the widespread adoption and commercialization of multiorgan-on-a-chip systems. One of the primary hurdles lies in the recreation of physiologically relevant fluid dynamics within the microfluidic channels of these platforms. Proper fluid flow is critical for simulating blood circulation, which governs nutrient and drug delivery as well as waste removal29,30. The fluid shear stress on the endothelial lining of blood vessels differs across organs31, in vivo and significantly influences cellular behavior, gene expression, and drug metabolism. Replicating these dynamic forces in vitro, while maintaining the appropriate flow rates and pressure gradients across multiple organ models, is technically challenging due to the precise engineering required to avoid flow inconsistencies or mechanical disruptions32. Furthermore, a key need for drug development applications is the need for parallel replicates to be integrated within the chip, which current designs may not readily support. Additionally, scaling up multiorgan platforms using external pumps, valves, and tubing may not be practical or user-friendly for preclinical pharmacological studies, limiting their broader adoption33.
To address the limitations of current multiorgan-on-a-chip (MOOC) technologies, we have developed the Fluidic Programmable Gravi-maze Array (FPGA)—a modular, gravity-driven multiorgan platform that robustly simulates human physiological conditions through unidirectional flow guided by a precisely engineered maze architecture. This multiorgan-on-a-plate (MOAP) system, termed OrganRX™, integrates organ-specific models—liver, kidney, lung, gut, and brain—within a microfluidic circuit designed to replicate key aspects of inter-organ communication, fluid dynamics, and biochemical signaling. OrganRX™ features organ-specific microenvironments and dynamic flow to simulate complex pharmacokinetic interactions in a controlled, customizable manner. The system offers tunable flow rates and pressure gradients, allowing tailored preclinical testing to meet diverse experimental needs. The gravity-driven recirculation system mimics physiological blood flow and shear stress across organ compartments to potentially become a human on a plate (HOAP). Furthermore, it will enable accurate modeling of drug distribution, metabolism, and inter-organ responses, with real-time monitoring of drug concentrations, metabolites, and cellular activity34. The OrganRX™ platform enables clinical trials-on-a-chip35 by replicating human multi-organ physiology, drug metabolism36, and inter-organ interactions37 within a patient-relevant system38.
Methods and Materials
Development of Multiorgan Plate and Recirculation System
The OrganRX™ has two recirculation channels separated by a blood-brain-barrier (BBB) model as shown in Fig. 1. The brain organ model is located in the inner recirculation channel which allows media to flow across multiple cellular models of the brain at a lower shear flow. Other organ models such as gut, liver, kidney or heart contain epithelial regions connected to the outer recirculation channel. The endothelial regions in the outer recirculation channel experience higher shear flow. The variation in shear flow across different organ systems is important because it shapes tissue-specific endothelial function, influences local immune responses, and affects how cells respond to drugs and physiological cues. All of the organs within the system share one common media unless a BBB is established in the system
Fig. 1:

Schematic of multiorgan plate, OrganRX™
The multiorgan plate with six repeated units was injection molded with polystyrene and bonded with a 0.17mm glass at the bottom as shown in Fig. 2a. The width of the channels is 2mm and depths ranging from 0.2mm at the bridges to 0.7mm at the main endothelial and epithelial channels. The epithelial channels are loaded first with the gel and they stop at the bridges due to Laplace stop force as in Fig. 2b. The plate is compatible with standard well format and is accessible to imaging systems such as Synentec’s Nyone and multiplate readers such as Agilent’s Synergy2. The plate is also compatible with automated liquid dispensing robots such as Opentrons, OT2.
Fig. 2:

(a) Design of injection molded OrganRX™ plate(b) Gel loaded at the epithelial channels
Two organ-plate models were developed, as illustrated in Figure 3. The first model is designed to study barrier function, using TEER (transendothelial electrical resistance) measurements, with barrier-forming cells seeded at the blood-brain barrier (BBB) region that separates two recirculating flow loops. The second model focuses on vascularization, where cells are seeded in the central channel, while media, co-cultured cells, or extracellular matrix (ECM) are placed in the adjacent channels to support angiogenic interactions. In both models, gravity-driven recirculation is established by tilting the plate to drive flow between four inner corner wells and four outer corner wells, maintaining directional flow in the inner and outer fluidic loops.
Fig. 3:

OrganRX™models for (a) Barrier Function TEER measurement with BBB channel shown in red (b) Vascularization studies with vascular channel shown in brown
The OrganRX™ plate operates under controlled recirculation with physiologically relevant shear flow using the OrganRX™ system, as in Fig. 4a. Following sterilization with 70% ethanol, the system is placed inside a standard cell culture incubator. To demonstrate high-throughput capability, we developed an expandable system (Fig. 4b) capable of cascading up to 30 plates (arranged in a 2×3×5 configuration) across the x, y, and z axes. Notably, two such units can fit within a conventional incubator, enabling parallel experimentation at scale.
Fig. 4:

(a) Recirculation System single plate (b) Recirculation System with multiple plates (c) Recirculation System with multiple random access plates (d) Injection-molded OrganRX™plate with glass bottom
When conducting multiple experiments with different intervention requirements simultaneously, independent access to individual plates becomes essential to ensure experimental flexibility and precision. To address this, the multi-plate recirculation system (Fig. 4c) incorporates a drawer-based design, allowing users to retrieve any specific plate independently without disrupting others. Additionally, we developed and published a Bluetooth-enabled iOS app on the App Store, which provides remote control of the recirculation system. This app enables users to select from multiple shear flow rates, set programmable waiting times between tilt-direction changes, and reset the system as needed—enhancing both precision and usability.
Computational Fluid Dynamics (CFD) Simulations
Precise control and prediction of fluid flow are critical where physiologically relevant shear stresses must be recreated to support organ-specific function. Traditional analytical models often fail to capture the complex, transient behaviors arising from gravity-driven flow in non-planar geometries. To ensure that the OrganRX™ platform accurately mimics in vivo-like fluid dynamics across multiple organ compartments, computational fluid dynamics (CFD) simulations were employed to model media movement during plate tilting. We used Simcenter STAR-CCM+ to perform CFD simulations of transient fluid flow within the OrganRX™ plate during gravitational tilting. The volume fraction module was utilized, assigning the 2.5 mL of medium in the organ plate physical properties corresponding to the culture media, while the surrounding region was defined as air. No-slip boundary conditions were applied to all channel walls, and zero pressure was imposed at the media surface in each well. The initial condition assumed an equal media height across all wells.
To simulate a high-shear condition, the plate was tilted by 20°, elevating the lower right corner relative to the upper left. This induced a pressure gradient across the system, generating unidirectional flow. The CFD analysis enabled dynamic mapping of velocity and pressure fields within the microchannels, confirming that shear stress gradients and directional flow closely mimic those observed in physiological circulation (Fig. 5). These simulations were foundational for validating the flow architecture of OrganRX™ and informing the design of experiments involving shear-dependent cellular responses.
Fig. 5:
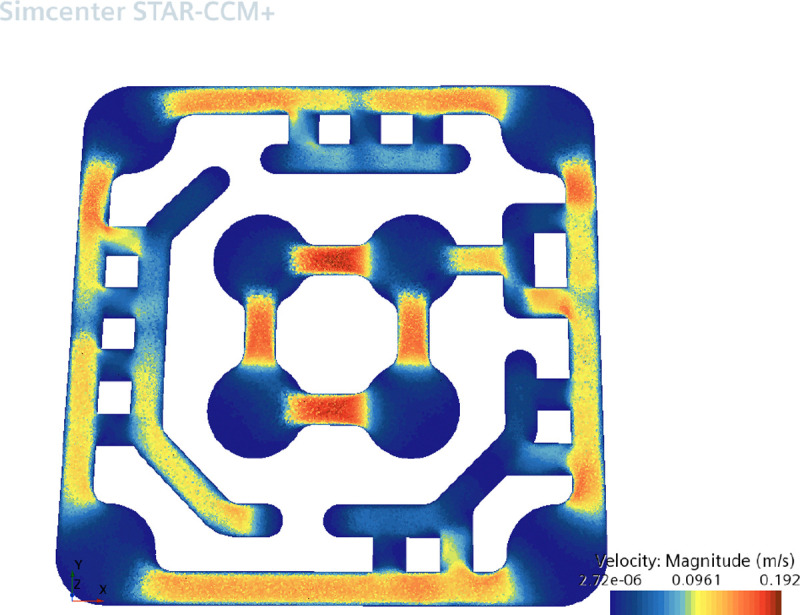

CFD Simulations for unidirectional flow In the OrganRX plate (a) velocity profile (b) pressure profile
The plots show the velocity (in Fig. 5a) and pressure (in Fig. 5b) distributions in one of the units in the OrganRX plate. This shows that the flow is the highest in the channels in the inner brain loop where speeds can reach up to 192 mm/s. Average speeds in the endothelial channels are approximately 100 mm/s. Lower flow is observed in most of the epithelial regions. The head pressure reached 83.1 Pa in the lowest region of the upper left outer well. These calculations do not account for conditions where the channel is filled with a 3D hydrogel at a specific concentration.
Calculation of Shear Stresses
The organ system tilting is accomplished by moving the four stepper motors simultaneously. One of the motors moves one of the organ plate connection points to an incremental height while the diagonal connection point is moved to the lowest position . The other two connection points are moved to the half-height position . The incremental tilt angle is defined as:
where is the diagonal distance between the connection points. The incremental height in one unit in the organ plate is given by:
where is the distance between corner wells in one unit. This incremental height is then used to calculate the pressure gradient in one unit in the organ plate:
where is the density of the fluid and is the gravitational acceleration. Assuming laminar steady-state flow39 of media through the channel, the velocity profile is given by:
where is the half-height of the channel, is the half-width of the channel, , and . The shear stress profile is given by:
[1] where is the viscosity of the fluid. We evaluated the shear stress at and to find the maximum value. The volumetric flow rate through the channel is given by:
From this, the average speed can be computed by:
where is the cross-sectional area of the rectangular channel. The table below shows designs with different parameters and the resulting flow rates and shear stresses.
The maximum tilt that the OrganRX system can provide to the organ plate is 20°. Given an incremental tilt angle, the incremental height change of each unit in the organ plate as well as the incremental pressure head across the channel in a unit is calculated. Assuming laminar steady-state flow of media through the channel, we applied the poiseuille’s formula that relates pressure drop to flow in a rectangular channel with a given channel width and height.
Experimental Setup for Shear Flow Rate
In this study, we utilized the OrganRX organ-on-a-chip system to investigate fluid dynamics40 and shear stress within microchannels under different experimental conditions. We used impedance measurements to verify the flow rate of 1M NaCl salt solution injected into a corner well of the organ plate. An impedance spectrometer was connected to a computer running dedicated impedance data acquisition software, which was used to capture and record impedance changes in real time. The software allowed for precise monitoring of impedance using voltage variations between the two probes. The impedance at the well of the delivery of the salt solution and an adjacent well of the organ plate was measured to determine the average time between the two impedance peaks during the gravity-driven flow. For the two impedance measurement channels, each probe is connected via electrical clips to an electrode board designed to fit securely on top of the organ plate. A set of stainless steel electrodes were inserted into the wells of the organ plate, with one probe positioned in Channel 1 (pink, Fig. 6) and the other in Channel 2 (blue, Fig. 6), corresponding to a known distance within the microfluidic channel. From the time of travel, the velocity of the flow and shear stresses were calculated based on the time intervals between impedance peaks.
Fig. 6:

Experimental Setup for Shear-flow Rate Measurements
The organ plate was subjected to controlled tilting at various z height increment steps. To control the flow dynamics of the OrganRX, an iOS App was employed to set eight predefined z-height (tilt angle) increment steps. Trial experiments were conducted to examine how fluid flow and shear stress were influenced by both the fluid volume and the addition of solutes.
By analyzing the time intervals between impedance peaks at the two probe locations, we calculated the fluid velocity () between them. The Length () between the two probes was 27 mm, and the velocity was obtained by dividing this distance by the average time interval () between the impedance peaks:
To compute the volumetric flow rate (Q), the velocity was multiplied by the cross-sectional area of the microchannel, where the area is given by the product of the channel’s width (2 mm) and height (0.7 mm):
Shear stress , was determined using the formula:
Cell Expansion in T-Flasks
All cell lines used in the organ model studies were expanded in T-75 flasks (Corning, Cat. #430641U) according to the manufacturer’s recommended protocols for thawing and subculture. Human umbilical vein endothelial cells (HUVECs) (Lonza, Cat. #CC-2517) and human brain microvascular endothelial cells (Angio-Proteomie, Cat. #cAP-0001) were cultured for application in the blood-brain barrier (BBB) model. For the brain organ model, SK-N-SH neuroblastoma cells (ATCC, Cat. #HTB-11) and HMC3 human microglia (ATCC, Cat. #CRL-3304) were used. For the gut–liver–kidney model, cell lines sourced from ATCC—HepG2 (Cat. #HB-8065), HK-2 (Cat. #CRL-2190), and T84 (Cat. #CCL-248)—were utilized. The cells were expanded under recommended growth conditions by ATCC, in EMEM or DMEM supplemented with 10% FBS and 1% Penicillin-Streptomycin. All cultures were maintained in a humidified incubator at 37 °C with 5% CO2, and passaged at 70–90% confluence prior to use in 3D encapsulation or seeding within OrganRX™ plates.
3-D Organ Model Experiments
Three-dimensional (3D) organ models were constructed using extracellular matrix (ECM) hydrogels41 tailored to support specific tissue types. Initial 3-D culture experiments were performed using rat tail type I collagen gel (Corning, Cat. #354236) at a final concentration of 4 mg/mL with pH-adjusted to 7.4 using NaHCO3. The collagen ECM consisted of rat tail type I collagen gel, NaHCO3 and HEPES solution combined in a 8:1:1 ratio42. Fibrinogen from bovine plasma (Sigma-Aldrich, Cat. #F8630) at a final concentration of 3 mg/mL was dissolved in sterile PBS and mixed 1:1 with thrombin from bovine plasma solution (Sigma-Aldrich, Cat. #T4648) at 2 U/mL prepared in heparin-supplemented media to form a fibrin hydrogel43–45. This formulation was used for encapsulating HUVECs, and GFP-expressing human brain microvascular endothelial cells for Blood-Brain Barrier (BBB) models. For the brain organ model, a 1:1 co-culture of SK-N-SH neuroblastoma cells and HMC3 human microglia was seeded at a density of 30,000 cells/μL per unit. For the gut–liver–kidney model, cell lines sourced from ATCC—HepG2, HK-2, and T84 were seeded along with HuVEC in 1:1 ratio. All experiments were performed using the OrganRX™ plate, with tissue channel gel volumes ranging from 15 μL (kidney), 20 μL (gut) and 50 μL (liver). Each co-culture suspension was combined with a fibrinogen/thrombin-based ECM and incubated at 37 °C for 40 minutes in a humidified 5% CO2 incubator to allow for gelation. OrganRX™ recirculation system was configured to achieve organ-specific shear stress levels, delivering approximately 0.5 dyn/cm2 for epithelial models and 4 dyn/cm2 for endothelial barrier models.
Image-Based Assays
Organ models cultured in the OrganRX™ plate were monitored daily using brightfield microscopy to assess cell morphology, attachment, and tissue integrity. Whole-plate imaging was performed at 4× magnification, while higher-resolution imaging of selected organ units was conducted at 20× magnification. For each selected field, 20 Z-stack images were acquired spanning a depth range of 0.2 mm to 0.7 mm to capture the three-dimensional architecture of the tissue construct. Fluorescent imaging was used to visualize labeled cells within the organ system. Brain microvascular endothelial cells expressing green fluorescent protein (GFP) were imaged using a standard FITC filter set (excitation: ~488 nm; emission: ~520 nm). All imaging was performed using an automated inverted fluorescence microscope equipped with motorized stage control and Z-stack capability. Image data were subsequently processed for qualitative and quantitative assessment of cellular distribution, barrier coverage, and structural organization46.
Establishment of a Blood-Brain Barrier (BBB) Model
To develop a functional in vitro blood-brain barrier (BBB) model47–49 within the OrganRX™ platform, a type I collagen hydrogel 4mg/ml was injected into the designated BBB channel (volume 8 uL) in Fig. 3a using a micropipette. The collagen ECM consisted of 5 mg/mL rat tail type I collagen gel (Corning, Cat. #354236), NaHCO3 and HEPES solution combined in a 8:1:1 ratio (include reference on bbb protocol). The collagen matrix was allowed to polymerize at 37 °C in a humidified incubator with 5% CO2 for 30–45 minutes. Following gelation, human brain microvascular endothelial cells (hBMECs) were seeded directly onto the vertical interface of the collagen gel.
To promote uniform cell attachment along the vertical gel surface, the plate was gently tilted at an angle of 30° and incubated for 4–6 hours under standard conditions (37 °C, 5% CO2). After the attachment period, 1 ml of complete endothelial cell medium was added to both the apical and basal compartments of the channel system. The BBB model was maintained under static condition for 24 hours and then flow conditions in the incubator, and brightfield imaging was performed daily to monitor cell adhesion, confluence, and monolayer formation on the collagen interface.
Establishment of a Vascular Model
To develop a functional vascular model43–45 within the OrganRX™ platform, a fibrinogen/thrombin-based ECM was injected into the designated vascular channel (volume 20 uL) (as shown previously in Fig. 3b) using a micropipette. The gel was allowed to polymerize at 37 °C in a humidified incubator with 5% CO2 for 30–45 minutes. To avoid premature gelation, it is recommended to mix the thrombin gel with cells and fibrinogen for each unit, as shown in Fig. 7. Following gelation, 2 ml media is added into the wells and placed in the recirculation system.
Fig. 7:

3-D gel with cells for seeding into the organ plate
Dasatinib and Quercetin Dosing
Dasatinib and Quercetin are both senolytics50,51 that target senescent cells, thereby preventing the senescent induction of surrounding cells by lowering senescence-associated secretory phenotype (SASP) factors secretion. After culturing the cells for 7 days in the incubator, stock solutions of 500 uM Dasatinib and 15 mM Quercetin (D / 10Q) in DMSO were used to prepare 6 working solutions of varying concentrations in media. Working solutions were added to the 6 units of the OrganRX plate. The following working concentrations of D / 10Q were prepared: 0 μM (0.7% DMSO), 0.25/2.5 μM, 0.5/5 μM, 1/10 μM, 2/20 μM, 3/30 μM. Doxorubicin (0.1 μM) was used to induce senescence within the cells in the organ plate.
Cell Painting using JUMP Cell Painting Kit
For Cell Painting52, cells the organ model is grown for 5 days under flow conditions. Prior to staining, models were washed once with pre-warmed 1× PBS and fixed using 3.7% paraformaldehyde for 15 minutes at room temperature. After fixation, cells were permeabilized with 0.1% Triton X-100 in PBS for 10 minutes and subsequently washed twice with PBS. The staining protocol followed the manufacturer’s instructions provided in the JUMP Cell Painting Kit (Revvity, Cat. #CPJ-001), which includes six fluorescent probes targeting distinct cellular compartments: Hoechst 33342 (nuclei), SYTO 14 (cytoplasm), Concanavalin A–Alexa Fluor 488 (endoplasmic reticulum), Wheat Germ Agglutinin–Alexa Fluor 555 (plasma membrane and Golgi), Phalloidin–Alexa Fluor 568 (F-actin), and MitoTracker Deep Red (mitochondria). Each dye was diluted in a staining buffer to the recommended working concentrations and applied simultaneously for 2 hours at room temperature, protected from light. Following incubation, cells were washed three times with PBS to remove excess dye, and plates were imaged using the LSM 780 confocal microscope from Carl Zeiss at UC Irvine (Optical Biology Core) using linear unmixing53. at appropriate excitation/emission settings for each fluorophore. In this linear unmixing, spatial expression patterns of Angiotensin-Converting Enzymes54 (ACE1 and ACE2) in the model are computationally distinguished using multiple fluorescent signals with overlapping spectra.
Phenylbutyrate and Curcumin Sequential Dosing
To evaluate the combined effects of epigenetic modulation55 and anti-inflammatory intervention on senescence and stress response pathways56, organ models were treated sequentially with phenylbutyrate followed by curcumin. After 7 days of standard culture in OrganRX™ plates, phenylbutyrate (4-phenylbutyric acid; Sigma-Aldrich, Cat. #P21005) was dissolved in sterile DMSO to prepare a 5000 mM stock solution. Working solutions were freshly diluted in complete medium. The dosage of phenylbutyrate solution (3 μM) was applied to the organ cultures for 48 hours.
Following phenylbutyrate treatment, media was removed and replaced with curcumin-containing media. Curcumin (Sigma-Aldrich, Cat. #C1386) was dissolved in DMSO to create a 50 mM stock, and working concentrations were freshly prepared in media. Curcumin dosage of 10 μM was applied for an additional 24 hours. The sequential treatment protocol was designed to evaluate additive or synergistic effects on inflammation, oxidative stress, and cellular senescence markers. All treatments were performed under standard incubation conditions (37 °C, 5% CO2).
Preparation of Oligomers ()
oligomers () were prepared following previously published57,58 protocols with minor modifications. Synthetic peptides (GenScript, Cat. #RP10001) were first pretreated with hexafluoroisopropanol (HFIP) to monomerize the peptides and then air-dried. The dried peptide film was resuspended in dimethyl sulfoxide (DMSO) (Sigma-Aldrich, Cat. #D8418) to generate a 5 mM stock solution. This stock was further diluted to a final concentration of 100 μM in phenol red-free DMEM/F-12 medium (Thermo Fisher Scientific, Cat. #11039021). The solution was vortexed for 15 seconds and incubated at 4 °C for 24 hours to allow oligomer formation. The resulting solution was used directly in experiments or aliquoted and stored at −80 °C for single use to minimize freeze–thaw variability.
Reactive Oxygen Species (ROS) Assay
Reactive oxygen species (ROS) generation was assessed59 in co-culture models following exposure to metabolic stress. Cells were pretreated with the drugs (for eg. D/10Q) in media for 2 days, followed by treatment with 0.1 μM doxorubicin (Sigma-Aldrich, Cat. #D1515) for 24 hours. To quantify intracellular ROS levels indicative of cellular senescence60, the fluorescent probe 2′,7′-dichlorodihydrofluorescein diacetate (H2DCF-DA) (Thermo Fisher Scientific, Cat. #D399) was added to the culture medium within OrganRX™ units at a final concentration of 10 μM and circulated on the OrganRX perfusion platform for 4 hours at 37 °C. Following incubation, the organ models were imaged on 4X and 20X using a fluorescence microscope with an excitation wavelength of 480 nm and an emission wavelength of 540 nm. Fluorescent images were analyzed using intensity as a readout for ROS accumulation across the co-culture system.
Measurement of Senescence-Associated β-Galactosidase Activity
Senescence-associated β-galactosidase (SA-β-gal) activity was assessed61 in fixed co-culture organ models using a commercial SA-β-gal staining kit (Cell Signaling Technology, Cat. #9860), following the manufacturer’s instructions. The induce senescence, the organ models cultured within the OrganRX plates were treated for 48 hours with either oligomers () or doxorubicin (DOX). Following fixation, samples were stained for SA-β-gal activity. Quantitative measurement was performed by reading absorbance at 420 nm and 600 nm using a Synergy2 microplate reader (Agilent). Additionally, stained organ cultures were imaged using light microscopy to qualitatively assess senescent cell morphology and distribution.
Biochemical Assays
Biochemical assays62 were performed using an Agilent Synergy2 microplate reader configured with a modified XML file to accommodate sporadic 1536-well formats. Assays employing absorbance, fluorescence, or chemiluminescence detection were conducted according to manufacturer protocols. Urea levels in conditioned media were quantified using a colorimetric assay kit (BioAssay Systems, Cat. #DIUR-100), and albumin was measured using a quantitative ELISA (Bethyl Laboratories, Cat. #E88–129). Cytochrome P450 1A2 (CYP1A2) enzymatic activity was assessed using a luciferin-based chemiluminescent assay (Promega, P450-Glo™ CYP1A2 Assay, Cat. #V8751), following chemical induction of the organ models. Standard curves and controls were included for all assays to ensure quantitative accuracy.
Sample Recovery and Gene Expression Analysis
To retrieve samples for gene expression analysis, OrganRX™ plates were first cleaned with 70% ethanol, and a one-sided adhesive tape (3M, Cat. #465) was applied to the bottom surface. Adhesion was secured using a handheld roller (VWR, Cat. #89097–614). Plates were then frozen at −86 °C for approximately 2 hours until the bottom glass was loose enough to be separated. Following freezing, the adhesive tape and 0.17 mm cover glass were carefully removed. Gel samples were scraped into 1.5 mL RNase-free microcentrifuge tubes (Eppendorf, Cat. #022431081) for downstream RNA isolation.
For efficient gel collection, media-only channels were scraped first to allow partial thawing (~30 seconds), followed by recovery of cell-containing gel sections. In cases where gel melted into the perfusion channels, a long pipette tip (Rainin, Cat. #17014079) was used to gently push the gel through. Optionally, dowel pins (McMaster-Carr, Cat. #91595A005) were used to block channels and prevent gel leakage.
Total RNA was extracted63 using the Direct-zol RNA Microprep Kit (Zymo Research, Cat. #R2062) according to the manufacturer’s protocol. Complementary DNA (cDNA) was synthesized from isolated RNA using the SuperScript™ VILO™ cDNA Synthesis Kit (Invitrogen, Cat. #11754050).
Quantitative real-time PCR (qRT-PCR) was performed using Maxima SYBR Green/Fluorescein qPCR Master Mix (2X) (Thermo Scientific, Cat. #K0241) on a QuantStudio™ 3 Real-Time PCR System (Applied Biosystems, Cat. #A28567). Gene-specific primers were ordered from Integrated DNA Technologies (IDT) and used as follows: ZO-1: Forward CGG TCC TCT GAG CCT GTA AG; Reverse GGA TCT ACA TGC GAC GAC AA, ß-actin: Forward TGC CGA CAG GAT GCA GAA G; Reverse GCC GAT CCA CAC GGA GTA CT, Occludin: Forward TCA GGG AAT ATC CAC CTA TCA CTT CAG; Reverse CAT CAG CAG CAG CCA TGT ACT CTT CAC, Claudin-5: Forward GAC TCG GTG CTG GCT CTG AG; Reverse CGT AGT TCT TCT TGT CGT AG, p21 : Forward: 5′-CGA TGG AAC TTC GAC TTT GTC A-3′; Reverse: 5′-GCA CAA GGG TAC AAG ACA GTG-3′ and PAI-1 : Forward: 5′-ACC GCA ACG TGG TTT TCT CA-3′; Reverse: 5′-TTG AAT CCC ATA GCT GCT TGA AT-3′
Data collection and analysis were conducted using QuantStudio™ Design and Analysis Software (Applied Biosystems, Cat. #A28219). Fluorescence data were exported in .xlsx format, and quantitative assessment was based on the multicomponent plot for SYBR signal (Cycles vs. Fluorescence).
Statistics
All studies were conducted in triplicate. Bar plots represent the mean ± SEM. Statistical analyses were performed using Excel, MATLAB, or custom Python scripts. Error bars are omitted for fluidic experiments involving high-frequency data acquisition. For image-based ROS measurements, outliers were removed by sorting pixel intensities in ascending order and excluding the top and bottom 10% of values. For phenylbutyrate and curcumin sequential dosing experiment images, the drug treatment images are normalized with control (no drug treatment) images.
Results and discussion
Shear flow validation
In the shear flow experiment, 2 mL of DI water was introduced into the well, and 0.5 mL of 1M NaCl solution was incrementally dispensed into Channel 1 in 5 steps of 0.1 mL each. The system was set to run at 8 different predefined z-height(tilt angle) increment steps. For each step of NaCl dispensed, impedance measurements were taken, allowing us to track the velocity at each of the 5 corresponding peaks as shown in Fig 8.
Fig. 8:

Measurement of fluidic flow during tilting of the organ plate
The graph presented in Fig 8 is an example dataset used to demonstrate the calculation of delta time (Δt) between impedance peaks at two different probe locations (Channel 1 and Channel 2). These are real voltage signals obtained from the impedance spectroscopy system during fluid flow in the microfluidic channels. To calculate the delta time (Δt) between peaks, we identified a kink in the graph for both Channel 1 and Channel 2. We calculated the time difference between kinks at the two probe locations. This process was repeated for other sets of peaks or kinks to get multiple Δt values. Finally, all the Δt values are average to get <Δt>.
The results demonstrated a direct relationship between the set incremental steps and the calculated shear stress values. As the z-height (tilt angle) of the organ plate increased, the flow rate increased, resulting in higher shear stress values. The parameters w and h denote the width and half-height of the rectangular channel (m), respectively. Using the volumetric flow in the Formula for Shear Stress in a Rectangular Channel64, the Shear Stress was calculated for each corresponding predefined z-height (angle tilt). The calculated shear stress and its corresponding predefined z-height are Tabulated in Table 1.
Table 1:
Calculation of shear flow parameters
| Unit | w (mm) | x (mm) | h (mm) | δ⊝ (deg) | δz (mm) | δP (Pa) | Q (mL/min) | Shear (dyn / cm2) |
|---|---|---|---|---|---|---|---|---|
| 6 | 2 | 27 | 0.7 | 0.5 | 0.24 | 2.34 | 0.23 | 0.30 |
| 6 | 2 | 27 | 0.7 | 10 | 4.77 | 46.74 | 4.63 | 5.95 |
| 6 | 2 | 27 | 0.7 | 17.5 | 8.49 | 83.21 | 8.24 | 10.59 |
| 24 | 1.6 | 14 | 0.7 | 0.5 | 0.12 | 1.21 | 0.17 | 0.29 |
| 24 | 1.6 | 14 | 0.7 | 10 | 2.47 | 24.24 | 3.44 | 5.79 |
| 24 | 1.6 | 14 | 0.7 | 17.5 | 4.40 | 43.14 | 6.13 | 10.30 |
| 96 | 0.8 | 7 | 0.7 | 0.5 | 0.06 | 0.61 | 0.06 | 0.22 |
| 96 | 0.8 | 7 | 0.7 | 10 | 1.24 | 12.12 | 1.14 | 4.46 |
| 96 | 0.8 | 7 | 0.7 | 17.5 | 2.20 | 21.57 | 2.02 | 7.95 |
CFD calculations were compared to the velocity measurements in the endothelial channels. Using the spatial velocity profiles from the CFD calculations, the shear flow rates at the different regions of the OrganRX plate is predicted as in Fig. 9.
Fig. 9:

Shear flow calculations for multiple angles of tilt
Comparison between experimental measurements and analytical calculations
We also used impedance measurements to experimentally verify the calculated velocities65 and shears that we calculated using the equations stated above. Five injections of 0.1 mL of 1 M NaCl salt solution were injected into one of the outer wells for organ plate tilting with incremental angles. The impedance between this well and an adjacent well was measured to determine the average time between the successive impedance peaks. These peaks corresponded to the time of flow of the salt solution from the initial well to the adjacent well due to the gravity-driven flow by tilting. From this data, the average velocity of the flow and the shear stress was calculated for each incremental tilt angle.
We observed some discrepancies between the theoretical values and the experimentally measured values. This could be due to the transient nature of the flow during the incremental tilting of the organ plate incremental. However, the formulas we used earlier were defined for steady-state flow. We defined an effective incremental height to resolve the differences between the datasets as shown in Fig.10a.
Fig. 10.

(a) Incremental height correction for velocity prediction (b) Accurate prediction of theoretical velocity from experimental velocity
The effective incremental height is defined as:
where is the actual height, , and . By using this conversion, we calculated the velocities and shear flow rates that are in good agreement with the experimentally measured values as shown in Fig. 10b.
Unidirectional flow in OrganRX endothelial channel
We used the technique for velocity measurements within the microfluidic channels to establish unidirectional flow66 in our plate. In a separate experiment, 2 mL of DI water was introduced into the well, and 1 M NaCl solution was incrementally dispensed into two opposite sides channels in 40 steps (20 steps in each channel) of 0.05 mL each corresponding to 360° angle of rotation of the organ plate. For each step of NaCl dispensed, impedance measurements were taken, allowing us to track the velocity at each of the 40 corresponding peaks. The velocities recorded over a full rotation of the organ plate in the recirculation system are plotted in Fig. 11. The first 20 data points, corresponding to angles 0° to 180°, represent the forward flow, while the second 20 data points, corresponding to 180° to 360°, represent the reverse flow. As the forward flow velocities are significantly higher than those of the reverse flow, the system effectively operates under a unidirectional flow regime.
Fig. 11.

Unidirectional flow velocity during the recirculation
While manual dispensing using a syringe introduced minor variations in the volume and consequently velocity due to differences in applied force for injection, the velocities at each peak were expected to remain largely consistent.
Development of a vascularized endothelial barrier
To establish a vascularized endothelial network43–45, HUVECs were seeded into the vascular channel of the OrganRX™ plate. The organ plate was integrated into a continuous recirculation system and maintained under standard culture conditions (37 °C, 5% CO2). Vascular structure formation was monitored by brightfield and fluorescence microscopy, with visible network formation observed between days 2 and 7 post-seeding. The vascular formation after 5 days of recirculation with 30 M cells/uL of HuVEC mixed with 1.3mg/ml thrombin and 2 mg/ml of fibrinogen solutions is presented in Fig. 12a. When we increased the gel concentrations to 2 mg/ml of thrombin and 3 mg/ml of fibrinogen, the vascular network was well-defined. The image after 1 day of recirculation is presented in Fig. 12b.
Fig. 12:


Vascular structure formation with endothelial cells (HUVECs) (a) 1.3mg/ml thrombin and 2 mg/ml of fibrinogen five days after seeding (4X) (b) 2 mg/ml thrombin and 3 mg/ml of fibrinogen one day after seeding (20X)
We performed RT-PCR to assess the expression of tight junction markers—ZO-1, Occludin, and Claudin—using β-actin as a positive control and a gel without cells as the negative control, as shown in Fig. 13a. Notably, a parallel experiment conducted using a static transwell culture did not yield detectable expression of tight junction markers within 40 PCR cycles. In contrast, the flow-based culture exhibited markedly higher expression of tight junction genes, with signals even exceeding that of β-actin, indicating enhanced barrier formation under dynamic conditions.
Fig. 13:

(a) Gene expression of tight junction proteins using RT PCR (b) [i] Vascular HuVEC cells using cell painting using spectral unmixing Angiotensin-Converting Enzyme 1 [ii] Angiotensin-Converting Enzyme 2
In another experiment, HUVECs were used to form perfusable 3D vascular structures, which were subsequently stained using the Cell Painting JUMP Kit. High-resolution spectral unmixing imaging was performed using confocal microscopy to characterize the structural and morphological integrity of the vascularized network as shown in Fig. 13b. The image shows how HUVECs can self-organize into vessel-like tubes with central lumens (empty spaces) expressing ACE enzymes on their surfaces. The vascularized HUVECs with expression of ACE1 and ACE2 could reveal important biological insights—especially in the context of vascular function, inflammation, or disease modeling. ACE1 upregulation often correlates with inflammation and leakiness. ACE2 may be reduced or redistributed during such stress, as seen in viral infection or oxidative damage.
We conducted a separate experiment by introducing 25 μL of Type I collagen gel through the small port, followed by seeding GFP-labeled hBMECs from the large well side, positioning them along the vertical face of the pre-gelled matrix (Refer to Fig. 3a). To promote uniform cell attachment along the collagen interface, the plate was tilted at a 70° angle for 4–6 hours. This setup resulted in the formation of a confluent, barrier-like monolayer of hBMECs tightly adhered to the gel surface, as demonstrated in Figure 14a. However, the apical side of the endothelial cells are directed to the brain side instead of the blood side. Therefore, we seeded the cells on the other side of the gel so that the apical side of the cells will be on the blood side. For this we introduced 8 uL of 4 mg/ml collagen I gel from the well side to form a vertical wall near the port side. After gelation, we introduced 75uL of cell suspension containing 10,000 cells through the port and tilted the plate to allow cell attachment on the vertical wall of the gel. After 6 hours, we filled the organ model with 2 ml of media and placed the plate on the recirculation system. The cells were monitored every day. The cells adhered on the collagen are seen as a dark cloud on the gel interface at 4X magnifications. One of the Z-stack images (20X) of the interface with 20 slices within 200 um of depth of the channel is shown in Fig. 14b.
Fig. 14:

(a) Brain microvascular endothelial cells on gel vertical wall (well side) (b) HuVECs on gel vertical wall (port side). Side image is taken from Z-stack images to view the cells on the vertical wall.
To assess maturation and barrier tightness of the BBB, Transendothelial electrical resistance (TEER) was monitored using pin electrodes modified on the EVOM2 probe from World Precision Instrument. HUVEC cultures achieved a peak TEER value of approximately 900 Ω·cm2, indicating the formation of a functionally mature and tight endothelial barrier.
Albumin and urea generation from multiorgan models
Initial multi-organ experiments, which included gut, brain, liver, and kidney models simultaneously, led to complex and inconsistent results that were difficult to interpret and reproduce. Subsequent studies focused on simplified dual-organ systems67–69, such as liver–kidney and gut–brain models, to better investigate inter-organ communication under controlled conditions. Later, kidney and liver organ models were established in a 3D co-culture system incorporating HUVECs to emulate vascular integration. The multiorgan constructs consisted of HUVECs co-cultured with HT-2 cells to model renal tissue and HepG2 cells to model hepatic function. Functional output was assessed by quantifying albumin and urea concentrations in the culture medium (Fig. 15). By day 8, albumin levels in the liver–kidney co-culture were reduced relative to the liver-alone condition, whereas urea levels were elevated in the multiorgan model compared to the hepatic monoculture, suggesting dynamic interorgan metabolic interactions70.
Fig. 15:

Albumin and urea evaluation in the liver–kidney co-culture model on the 2nd day and 8th day
The observed reduction in albumin levels within the liver–kidney with HUVEC co-culture systems may be attributed to several factors71,72. First, in a multiorgan configuration, albumin secreted by HepG2 hepatocytes is likely distributed across a larger extracellular volume and may be partially absorbed or retained by non-hepatic cells. This dilution or adsorption effect can result in lower measurable concentrations of albumin in the collected media. Second, both HT-2 and HuVEC cells possess surface receptors and endocytic pathways capable of albumin binding or uptake, thereby reducing its extracellular concentration without affecting overall hepatic synthesis. Additionally, inter-organ crosstalk may modulate hepatic function directly. Co-culture with HT-2 or HUVEC cells may influence HepG2 metabolic activity through nutrient competition, the secretion of inflammatory cytokines, or shear stress exposure in the presence of recirculation. These factors may suppress albumin synthesis or secretion over time. In contrast, urea concentrations were elevated in the multiorgan system compared to liver monocultures, a result consistent with increased nitrogenous metabolic load. The presence of HT-2 and HUVEC cells likely introduces additional amino acid turnover and metabolic waste, thereby providing more ammonia substrates for hepatic urea cycle activity and stimulating urea synthesis by HepG2 cells. Moreover, in this model, renal urea clearance mechanisms are absent, as HT-2 cells do not possess the specialized transport and excretory functions of proximal tubule epithelial cells. Consequently, urea accumulates73 in the culture medium, producing higher measurable levels over time despite functional hepatic metabolism.
Evaluation of brain disease model and neuroprotection
To induce cellular senescence, we established a 3D brain model using a 1:1 co-culture of HMC3 microglia and SK-N-SH neuroblastoma cells, seeded at a density of 30,000 cells/μL. Senescence was triggered by treatment with hydrogen peroxide (H2O2)74, doxorubicin75, or Aβ oligomers76. After 7 days of culture, 10 μL of the H2DCF-DA probe was added to each unit and incubated for 4 hours on the OrganRX™ circulation system for reactive oxygen species (ROS) analysis. ROS fluorescence imaging was performed using 20× magnification, for quantification. H2O2 was applied at varying concentrations to induce oxidative stress, and the resulting ROS levels were measured. In a separate set of experiments, the combination of dasatinib and quercetin (D+10Q) was administered at different concentrations to evaluate its neuroprotective potential. There was a concentration dependent increase in ROS levels following H2O2 exposure, as seen in Fig. 16a. D+10Q treatment resulted in a reduction in ROS Fig. 16b,, indicating a protective effect against oxidative stress. We observed that ROS imaging in the brain model varies depending on the type of stressor applied. Representative ROS images following exposure to H2O2 and DOX are shown in Fig. 17.
Fig. 16:

(a) ROS assay after stressing using H2O2 (b) ROS assay after protecting using D+Q drugs
Fig. 17:

(a) ROS image after stressors using H2O2 (b) ROS assay after stressors using DOX
With relevance to Alzhemier’s disease drug screening, we used Aβ oligomers to challenge the brain organ model and verified the senescence using SAβGal assay and RTPCR. The neuroprotective effects of D+Q drugs are exhibited through SAβGal assay (Fig. 18b) and RTPCR (Fig. 18b).
Fig. 18:

(a) Senescence assay after stressing using Aβ oligomers followed by neuroprotection using D+Q drugs (b) RTPCR assay after stressing using Aβ oligomers followed by neuroprotection using D+Q drugs
Sequential Drug Treatment
For gut-brain senescence studies, we treated the model with phenylbutyrate77 and subsequently with curcumin78 to test the serial effects of drugs79 on a gut-brain organ model. Phenylbutyrate functions as a histone deacetylase inhibitor (HDACi)80 and is commonly used in the treatment of urea cycle disorders. While it can promote beneficial gene expression changes, phenylbutyrate may also increase ROS as a side effect, primarily due to mitochondrial stress and disturbances in cellular redox balance81. In contrast, curcumin is a well-known natural compound with potent antioxidant and anti-inflammatory properties. It directly scavenges ROS and activates protective cellular pathways, particularly the Nrf2/HO-1 axis82, to reduce oxidative stress and enhance cellular resilience. Representative ROS images of gut-brain models deformed by the drug exposu are presented in Fig. 19.
Fig. 19:


Representative ROS images after sequential drug exposure (a) Gut model alone control (no drug treatment) (b) Brain model alone after Phenylbutyrate treatment (c) Gut-Brain model control (d) Gut-Brain model after Phenylbutyrate treatment PB followed by curcumin treatment
In the gut-brain organ model, phenylbutyrate (PB) treatment significantly reduced ROS levels in the brain region, indicating a neuroprotective effect likely mediated by HDAC inhibition, while the gut model showed little to no change (Fig. 20). When curcumin (C) was added following phenylbutyrate (PB+C), brain model ROS levels increased compared to phenylbutyrate alone, suggesting a potential antagonistic interaction where curcumin83 may interfere with phenylbutyrate’s protective effects. Meanwhile, the gut model remained largely unaffected in the combined treatment. Curcumin alone led to a moderate reduction in ROS in both the gut and brain models, consistent with its known antioxidant properties. Overall, phenylbutyrate was most effective in reducing brain oxidative stress on its own, while curcumin provided a broader but milder antioxidant benefit as presented in Fig. 20.
Fig. 20:

ROS analysis after sequential drug exposure (a) control (no drug treatment) gut-brain model (b) after PB treatment (c) PB followed by curcumin treatment (d) only curcumin treatment
In the gut-only organ model, phenylbutyrate tends to increase ROS levels due to endoplasmic reticulum stress and local inflammation, while curcumin effectively mitigates this oxidative stress by upregulating antioxidant enzymes and suppressing pro-inflammatory cytokines84. In the brain-only model, PB induces neurotoxic ROS elevation through mitochondrial stress and potentially HDAC-related apoptotic signaling. However, curcumin offers strong neuroprotection in this context by enhancing pathways such as BDNF and HO-1, and it can cross BBB-like structures in chip models to exert its antioxidant effects. In the interconnected gut-brain model, phenylbutyrate may disrupt the gut barrier, leading to increased systemic inflammation and elevated ROS in the brain, amplified by gut-derived inflammatory mediators85. Curcumin, in this combined system, may lower gut inflammation and consequently reduce downstream brain ROS, providing a systemic antioxidant benefit through organ-organ interaction, where stabilizing the gut environment contributes to brain protection86.
Conclusions
The OrganRX™ platform presents a significant advancement in multiorgan systems, offering a physiologically relevant, gravity-driven, unidirectional recirculation system capable of modeling inter-organ interactions and systemic drug effects with high fidelity. CFD modeling and impedance-based flow validation confirm the platform’s ability to generate consistent, quantifiable shear profiles across organ compartments, supporting its application in preclinical pharmacokinetic and toxicity studies. By integrating multiple organ models, including gut, liver, kidney, brain, and endothelium, within a modular microfluidic plate with dynamic fluid shear, OrganRX™ enables the modeling of barrier function, vascularization, and drug metabolism under tunable conditions. This work demonstrates the system’s functional utility through a series of complex biological assays, including 3D tissue construction, vascular formation, ROS quantification, senescence evaluation, and biochemical marker analysis. Albumin and urea measurements from liver–kidney co-cultures validate metabolic interactions across organ models, offering translational relevance to human physiology. Furthermore, drug response studies highlight the importance of multiorgan context: PB alone reduced brain ROS in the GB model, while the addition of curcumin reversed this benefit, revealing an antagonistic effect not observed78,79 in single-organ systems. These results underscore the unique insights provided by multiorgan systems, where inter-organ crosstalk can significantly influence pharmacodynamics and toxicity outcomes87,88. However, these initial findings, focused primarily on engineering validation, highlight the need for more systematic pharmacological studies to elucidate the underlying mechanisms of drug action and organ model responses.
In summary, the OrganRX™ platform, built on the FPGA technology, represents a significant advancement in MOOC research by addressing long standing challenges in physiological relevance, scalability, and modularity bridging the gap between conventional in vitro models and human clinical biology. This system not only enhances predictive power in preclinical drug development but also supports mechanistic studies of disease processes such as neuroinflammation, senescence, and inter-organ signaling89. The platform’s compatibility with automated imaging, barrier functions, biochemical assays, and transcriptomic profiling further positions it as a versatile and high-throughput-ready tool for pharmaceutical R&D and precision medicine applications90. Ultimately, this platform holds promise as a scalable and automation-compatible HOAP system for advancing precision medicine, drug screening, and systems pharmacology91.
Supplementary Material
Acknowledgements
The authors acknowledge the funding from NIH (1R43ES032357-01, 1R44GM139413-01 and 1R43AG073040-01) and NASA (80NSSC24PB276) for the development of the multiorgan plate. Dr. Adeela Syed (UC Irvine) is acknowledged for helping to acquire images from LSM 780 confocal microscope at Optical Biology Core using linear unmixing. Dr. Jay Sharma (Celprogen), Dr. Masashi Kitazawa (UC Irvine), Dr. Siok Lam Lim (UC Irvine), Dr. Subramanian Veedamali (UC Irvine) and Mr. Trevor Teafatillar (UC Irvine) are acknowledged for helping with cell culture and performing preliminary experiments on the OrganRX system.
Footnotes
Conflicts of interest
In accordance with our policy on Conflicts of interest the authors declare that they are employees of Biopico Systems Inc
Data availability
Z-stack images of selected organ models will be posted in the Supplemental Information Section. RTPCR Data will be made available. The protocol for multiorgan culture using 3D gel is available in mathematical formula-enabled forms on the Biopico Systems Inc. website: https://biopico.com/organ-culture-estimate/
Notes and references
- (1).Franklin M. R.; Platero S.; Saini K. S.; Curigliano G.; Anderson S. Immuno-Oncology Trends: Preclinical Models, Biomarkers, and Clinical Development. J. Immunother. Cancer 2022, 10 (1), e003231. 10.1136/jitc-2021-003231. [DOI] [PMC free article] [PubMed] [Google Scholar]
- (2).Zhao Q. Bispecific Antibodies for Autoimmune and Inflammatory Diseases: Clinical Progress to Date. BioDrugs Clin. Immunother. Biopharm. Gene Ther. 2020, 34 (2), 111–119. 10.1007/s40259-019-00400-2. [DOI] [PubMed] [Google Scholar]
- (3).Drummond E.; Wisniewski T. Alzheimer’s Disease: Experimental Models and Reality. Acta Neuropathol. (Berl.) 2017, 133 (2), 155–175. 10.1007/s00401-016-1662-x. [DOI] [PMC free article] [PubMed] [Google Scholar]
- (4).Shamshad A.; Kang C.; Jenny L. A.; Persad-Paisley E. M.; Tsang S. H. Translatability Barriers between Preclinical and Clinical Trials of AAV Gene Therapy in Inherited Retinal Diseases. Vision Res. 2023, 210, 108258. 10.1016/j.visres.2023.108258. [DOI] [PMC free article] [PubMed] [Google Scholar]
- (5).Horvath P.; Aulner N.; Bickle M.; Davies A. M.; Nery E. D.; Ebner D.; Montoya M. C.; Östling P.; Pietiäinen V.; Price L. S.; Shorte S. L.; Turcatti G.; Von Schantz C.; Carragher N. O. Screening out Irrelevant Cell-Based Models of Disease. Nat. Rev. Drug Discov. 2016, 15 (11), 751–769. 10.1038/nrd.2016.175. [DOI] [PubMed] [Google Scholar]
- (6).Van Der Worp H. B.; Howells D. W.; Sena E. S.; Porritt M. J.; Rewell S.; O’Collins V.; Macleod M. R. Can Animal Models of Disease Reliably Inform Human Studies? PLoS Med. 2010, 7 (3), e1000245. 10.1371/journal.pmed.1000245. [DOI] [PMC free article] [PubMed] [Google Scholar]
- (7).Sun D.; Gao W.; Hu H.; Zhou S. Why 90% of Clinical Drug Development Fails and How to Improve It? Acta Pharm. Sin. B 2022, 12 (7), 3049–3062. 10.1016/j.apsb.2022.02.002. [DOI] [PMC free article] [PubMed] [Google Scholar]
- (8).Roman V.; Mihaila M.; Radu N.; Marineata S.; Diaconu C. C.; Bostan M. Cell Culture Model Evolution and Its Impact on Improving Therapy Efficiency in Lung Cancer. Cancers 2023, 15 (20), 4996. 10.3390/cancers15204996. [DOI] [PMC free article] [PubMed] [Google Scholar]
- (9).Barré-Sinoussi F.; Montagutelli X. Animal Models Are Essential to Biological Research: Issues and Perspectives. Future Sci. OA 2015, 1 (4), FSO63. 10.4155/fso.15.63. [DOI] [PMC free article] [PubMed] [Google Scholar]
- (10).Gangwal A.; Lavecchia A. Artificial Intelligence in Preclinical Research: Enhancing Digital Twins and Organ-on-Chip to Reduce Animal Testing. Drug Discov. Today 2025, 30 (5), 104360. 10.1016/j.drudis.2025.104360. [DOI] [PubMed] [Google Scholar]
- (11).Van Rijt A.; Stefanek E.; Valente K. Preclinical Testing Techniques: Paving the Way for New Oncology Screening Approaches. Cancers 2023, 15 (18), 4466. 10.3390/cancers15184466. [DOI] [PMC free article] [PubMed] [Google Scholar]
- (12).Wang Y. I.; Carmona C.; Hickman J. J.; Shuler M. L. Multiorgan Microphysiological Systems for Drug Development: Strategies, Advances, and Challenges. Adv. Healthc. Mater. 2018, 7 (2), 1701000. 10.1002/adhm.201701000. [DOI] [PMC free article] [PubMed] [Google Scholar]
- (13).Georgescu A.; Oved J. H.; Galarraga J. H.; Cantrell T.; Mehta S.; Dulmovits B. M.; Olson T. S.; Fattahi P.; Wang A.; Candarlioglu P. L.; Muvaffak A.; Kim M. M.; Aydin S. A.; Seo J.; Diffenderfer E. S.; Lynch A.; Worthen G. S.; Huh D. D. Self-Organization of the Hematopoietic Vascular Niche and Emergent Innate Immunity on a Chip. Cell Stem Cell 2024, 31 (12), 1847–1864.e6. 10.1016/j.stem.2024.11.003. [DOI] [PMC free article] [PubMed] [Google Scholar]
- (14).Lohasz C.; Bonanini F.; Hoelting L.; Renggli K.; Frey O.; Hierlemann A. Predicting Metabolism-Related Drug-Drug Interactions Using a Microphysiological Multitissue System. Adv. Biosyst. 2020, 4 (11), e2000079. 10.1002/adbi.202000079. [DOI] [PubMed] [Google Scholar]
- (15).Trapecar M. Multiorgan Microphysiological Systems as Tools to Interrogate Interorgan Crosstalk and Complex Diseases. FEBS Lett. 2022, 596 (5), 681–695. 10.1002/1873-3468.14260. [DOI] [PubMed] [Google Scholar]
- (16).Zhou R.; Brislinger D.; Fuchs J.; Lyons A.; Langthaler S.; Hauser C. A. E.; Baumgartner C. Vascularised Organoids: Recent Advances and Applications in Cancer Research. Clin. Transl. Med. 2025, 15 (3), e70258. 10.1002/ctm2.70258. [DOI] [PMC free article] [PubMed] [Google Scholar]
- (17).Borisch C.; Thum T.; Bär C.; Hoepfner J. Human in Vitro Models for Fabry Disease: New Paths for Unravelling Disease Mechanisms and Therapies. J. Transl. Med. 2024, 22 (1), 965. 10.1186/s12967-024-05756-w. [DOI] [PMC free article] [PubMed] [Google Scholar]
- (18).Tao T.; Deng P.; Wang Y.; Zhang X.; Guo Y.; Chen W.; Qin J. Microengineered Multi-Organoid System from hiPSCs to Recapitulate Human Liver-Islet Axis in Normal and Type 2 Diabetes. Adv. Sci. Weinh. Baden-Wurtt. Ger. 2022, 9 (5), e2103495. 10.1002/advs.202103495. [DOI] [PMC free article] [PubMed] [Google Scholar]
- (19).Ronaldson-Bouchard K.; Teles D.; Yeager K.; Tavakol D. N.; Zhao Y.; Chramiec A.; Tagore S.; Summers M.; Stylianos S.; Tamargo M.; Lee B. M.; Halligan S. P.; Abaci E. H.; Guo Z.; Jacków J.; Pappalardo A.; Shih J.; Soni R. K.; Sonar S.; German C.; Christiano A. M.; Califano A.; Hirschi K. K.; Chen C. S.; Przekwas A.; Vunjak-Novakovic G. A Multi-Organ Chip with Matured Tissue Niches Linked by Vascular Flow. Nat. Biomed. Eng. 2022, 6 (4), 351–371. 10.1038/s41551-022-00882-6. [DOI] [PMC free article] [PubMed] [Google Scholar]
- (20).Satoh T.; Sugiura S.; Shin K.; Onuki-Nagasaki R.; Ishida S.; Kikuchi K.; Kakiki M.; Kanamori T. A Multi-Throughput Multi-Organ-on-a-Chip System on a Plate Formatted Pneumatic Pressure-Driven Medium Circulation Platform. Lab. Chip 2017, 18 (1), 115–125. 10.1039/c7lc00952f. [DOI] [PubMed] [Google Scholar]
- (21).Juste-Lanas Y.; Hervas-Raluy S.; García-Aznar J. M.; González-Loyola A. Fluid Flow to Mimic Organ Function in 3D in Vitro Models. APL Bioeng. 2023, 7 (3), 031501. 10.1063/5.0146000. [DOI] [PMC free article] [PubMed] [Google Scholar]
- (22).Rogal J.; Probst C.; Loskill P. Integration Concepts for Multi-Organ Chips: How to Maintain Flexibility?! Future Sci. OA 2017, 3 (2), FSO180. 10.4155/fsoa-2016-0092. [DOI] [PMC free article] [PubMed] [Google Scholar]
- (23).Wysoczański B.; Świątek M.; Wójcik-Gładysz A. Organ-on-a-Chip Models—New Possibilities in Experimental Science and Disease Modeling. Biomolecules 2024, 14 (12), 1569. 10.3390/biom14121569. [DOI] [PMC free article] [PubMed] [Google Scholar]
- (24).Cheruku G. R.; Wilson C. V.; Raviendran S.; Xiao Q. Recent Advances and Future Perspectives in Vascular Organoids and Vessel-on-Chip. Organoids 2024, 3 (3), 203–246. 10.3390/organoids3030014. [DOI] [Google Scholar]
- (25).Ahmed T. Organ-on-a-Chip Microengineering for Bio-Mimicking Disease Models and Revolutionizing Drug Discovery. Biosens. Bioelectron. X 2022, 11, 100194. 10.1016/j.biosx.2022.100194. [DOI] [Google Scholar]
- (26).Picollet-D’hahan N.; Zuchowska A.; Lemeunier I.; Le Gac S. Multiorgan-on-a-Chip: A Systemic Approach To Model and Decipher Inter-Organ Communication. Trends Biotechnol. 2021, 39 (8), 788–810. 10.1016/j.tibtech.2020.11.014. [DOI] [PubMed] [Google Scholar]
- (27).Kimura H.; Nishikawa M.; Kutsuzawa N.; Tokito F.; Kobayashi T.; Kurniawan D. A.; Shioda H.; Cao W.; Shinha K.; Nakamura H.; Doi K.; Sakai Y. Advancements in Microphysiological Systems: Exploring Organoids and Organ-on-a-Chip Technologies in Drug Development -Focus on Pharmacokinetics Related Organs-. Drug Metab. Pharmacokinet. 2025, 60, 101046. 10.1016/j.dmpk.2024.101046. [DOI] [PubMed] [Google Scholar]
- (28).Sunildutt N.; Parihar P.; Chethikkattuveli Salih A. R.; Lee S. H.; Choi K. H. Revolutionizing Drug Development: Harnessing the Potential of Organ-on-Chip Technology for Disease Modeling and Drug Discovery. Front. Pharmacol. 2023, 14, 1139229. 10.3389/fphar.2023.1139229. [DOI] [PMC free article] [PubMed] [Google Scholar]
- (29).Juste-Lanas Y.; Hervas-Raluy S.; García-Aznar J. M.; González-Loyola A. Fluid Flow to Mimic Organ Function in 3D in Vitro Models. APL Bioeng. 2023, 7 (3), 031501. 10.1063/5.0146000. [DOI] [PMC free article] [PubMed] [Google Scholar]
- (30).Zhang H.; Barralet J. E. Mimicking Oxygen Delivery and Waste Removal Functions of Blood. Adv. Drug Deliv. Rev. 2017, 122, 84–104. 10.1016/j.addr.2017.02.001. [DOI] [PubMed] [Google Scholar]
- (31).Katoh K. Effects of Mechanical Stress on Endothelial Cells In Situ and In Vitro. Int. J. Mol. Sci. 2023, 24 (22), 16518. 10.3390/ijms242216518. [DOI] [PMC free article] [PubMed] [Google Scholar]
- (32).Thomas G.; Rahman R. Evolution of Preclinical Models for Glioblastoma Modelling and Drug Screening. Curr. Oncol. Rep. 2025, 27 (5), 601–624. 10.1007/s11912-025-01672-4. [DOI] [PMC free article] [PubMed] [Google Scholar]
- (33).Lohasz C.; Rousset N.; Renggli K.; Hierlemann A.; Frey O. Scalable Microfluidic Platform for Flexible Configuration of and Experiments with Microtissue Multiorgan Models. SLAS Technol. 2019, 24 (1), 79–95. 10.1177/2472630318802582. [DOI] [PubMed] [Google Scholar]
- (34).Liang W. S.; Beaulieu-Jones B.; Smalley S.; Snyder M.; Goetz L. H.; Schork N. J. Emerging Therapeutic Drug Monitoring Technologies: Considerations and Opportunities in Precision Medicine. Front. Pharmacol. 2024, 15, 1348112. 10.3389/fphar.2024.1348112. [DOI] [PMC free article] [PubMed] [Google Scholar]
- (35).Blumenrath S. H.; Lee B. Y.; Low L.; Prithviraj R.; Tagle D. Tackling Rare Diseases: Clinical Trials on Chips. Exp. Biol. Med. Maywood NJ 2020, 245 (13), 1155–1162. 10.1177/1535370220924743. [DOI] [PMC free article] [PubMed] [Google Scholar]
- (36).Shroff T.; Aina K.; Maass C.; Cipriano M.; Lambrecht J.; Tacke F.; Mosig A.; Loskill P. Studying Metabolism with Multi-Organ Chips: New Tools for Disease Modelling, Pharmacokinetics and Pharmacodynamics. Open Biol. 2022, 12 (3), 210333. 10.1098/rsob.210333. [DOI] [PMC free article] [PubMed] [Google Scholar]
- (37).Tokizane K.; Imai S. Inter-Organ Communication Is a Critical Machinery to Regulate Metabolism and Aging. Trends Endocrinol. Metab. 2024, S1043276024003205. 10.1016/j.tem.2024.11.013. [DOI] [PMC free article] [PubMed] [Google Scholar]
- (38).Saiding Q.; Ma J.; Ke C.; Cui W. From “Organs on a Chip” to “Patient on a Chip.” The Innovation 2022, 3 (5), 100282. 10.1016/j.xinn.2022.100282. [DOI] [PMC free article] [PubMed] [Google Scholar]
- (39).Delplace F. Laminar Flow of Newtonian Liquids in Ducts of Rectangular Cross-Section a Model for Both Physics and Mathematics. Open Access J. Math. Theor. Phys. 2018, 1 (5), 198–201. 10.15406/oajmtp.2018.01.00034. [DOI] [Google Scholar]
- (40).Pisapia F.; Balachandran W.; Rasekh M. Organ-on-a-Chip: Design and Simulation of Various Microfluidic Channel Geometries for the Influence of Fluid Dynamic Parameters. Appl. Sci. 2022, 12 (8), 3829. 10.3390/app12083829. [DOI] [Google Scholar]
- (41).Bhattacharya A.; Alam K.; Roy N. S.; Kaur K.; Kaity S.; Ravichandiran V.; Roy S. Exploring the Interaction between Extracellular Matrix Components in a 3D Organoid Disease Model to Replicate the Pathophysiology of Breast Cancer. J. Exp. Clin. Cancer Res. 2023, 42 (1), 343. 10.1186/s13046-023-02926-4. [DOI] [PMC free article] [PubMed] [Google Scholar]
- (42).Uzoechi S. C.; Collins B. E.; Badeaux C. J.; Li Y.; Kwak S. S.; Kim D. Y.; Laskowitz D. T.; Lee J.-M.; Yun Y. Effects of Amyloid Beta (Aβ) Oligomers on Blood–Brain Barrier Using a 3D Microfluidic Vasculature-on-a-Chip Model. Appl. Sci. 2024, 14 (9), 3917. 10.3390/app14093917. [DOI] [PMC free article] [PubMed] [Google Scholar]
- (43).Chen S. W.; Blazeski A.; Zhang S.; Shelton S. E.; Offeddu G. S.; Kamm R. D. Development of a Perfusable, Hierarchical Microvasculature-on-a-Chip Model. Lab. Chip 2023, 23 (20), 4552–4564. 10.1039/D3LC00512G. [DOI] [PMC free article] [PubMed] [Google Scholar]
- (44).Hachey S. J.; Hatch C. J.; Gaebler D.; Forsythe A. G.; Ewald M. L.; Chopra A. L.; Fang J. S.; Hughes C. C. W. Methods for Processing and Analyzing Images of Vascularized Micro-Organ and Tumor Systems. Bioengineering March 14, 2025. 10.1101/2025.03.12.642741. [DOI] [PMC free article] [PubMed] [Google Scholar]
- (45).Mathur T.; Tronolone J. J.; Jain A. Comparative Analysis of Blood-Derived Endothelial Cells for Designing Next-Generation Personalized Organ-on-Chips. J. Am. Heart Assoc. 2021, 10 (22), e022795. 10.1161/JAHA.121.022795. [DOI] [PMC free article] [PubMed] [Google Scholar]
- (46).Garcia M. A.; Nelson W. J.; Chavez N. Cell-Cell Junctions Organize Structural and Signaling Networks. Cold Spring Harb. Perspect. Biol. 2018, 10 (4), a029181. 10.1101/cshperspect.a029181. [DOI] [PMC free article] [PubMed] [Google Scholar]
- (47).Pavlou G.; Spitz S.; Pramotton F. M.; Tsai A.; Li B. M.; Wang X.; Barr O. M.; Ko E. C.; Zhang S.; Ashley S. J.; Maaser-Hecker A.; Choi S. H.; Jorfi M.; Tanzi R. E.; Kamm R. D. Engineered 3D Human Neurovascular Model of Alzheimer’s Disease to Study Vascular Dysfunction. Biomaterials 2025, 314, 122864. 10.1016/j.biomaterials.2024.122864. [DOI] [PMC free article] [PubMed] [Google Scholar]
- (48).Hajal C.; Offeddu G. S.; Shin Y.; Zhang S.; Morozova O.; Hickman D.; Knutson C. G.; Kamm R. D. Engineered Human Blood–Brain Barrier Microfluidic Model for Vascular Permeability Analyses. Nat. Protoc. 2022, 17 (1), 95–128. 10.1038/s41596-021-00635-w. [DOI] [PubMed] [Google Scholar]
- (49).Campisi M.; Shin Y.; Osaki T.; Hajal C.; Chiono V.; Kamm R. D. 3D Self-Organized Microvascular Model of the Human Blood-Brain Barrier with Endothelial Cells, Pericytes and Astrocytes. Biomaterials 2018, 180, 117–129. 10.1016/j.biomaterials.2018.07.014. [DOI] [PMC free article] [PubMed] [Google Scholar]
- (50).Krzystyniak A.; Wesierska M.; Petrazzo G.; Gadecka A.; Dudkowska M.; Bielak-Zmijewska A.; Mosieniak G.; Figiel I.; Wlodarczyk J.; Sikora E. Combination of Dasatinib and Quercetin Improves Cognitive Abilities in Aged Male Wistar Rats, Alleviates Inflammation and Changes Hippocampal Synaptic Plasticity and Histone H3 Methylation Profile. Aging 2022, 14 (2), 572–595. 10.18632/aging.203835. [DOI] [PMC free article] [PubMed] [Google Scholar]
- (51).Gonzales M. M.; Garbarino V. R.; Kautz T. F.; Palavicini J. P.; Lopez-Cruzan M.; Dehkordi S. K.; Mathews J. J.; Zare H.; Xu P.; Zhang B.; Franklin C.; Habes M.; Craft S.; Petersen R. C.; Tchkonia T.; Kirkland J. L.; Salardini A.; Seshadri S.; Musi N.; Orr M. E. Senolytic Therapy in Mild Alzheimer’s Disease: A Phase 1 Feasibility Trial. Nat. Med. 2023, 29 (10), 2481–2488. 10.1038/s41591-023-02543-w. [DOI] [PMC free article] [PubMed] [Google Scholar]
- (52).Bray M.-A.; Singh S.; Han H.; Davis C. T.; Borgeson B.; Hartland C.; Kost-Alimova M.; Gustafsdottir S. M.; Gibson C. C.; Carpenter A. E. Cell Painting, a High-Content Image-Based Assay for Morphological Profiling Using Multiplexed Fluorescent Dyes. Nat. Protoc. 2016, 11 (9), 1757–1774. 10.1038/nprot.2016.105. [DOI] [PMC free article] [PubMed] [Google Scholar]
- (53).Enninful A.; Baysoy A.; Fan R. Unmixing for Ultra-High-Plex Fluorescence Imaging. Nat. Commun. 2022, 13 (1), 3473. 10.1038/s41467-022-31110-z. [DOI] [PMC free article] [PubMed] [Google Scholar]
- (54).Gómez J.; Albaiceta G. M.; García-Clemente M.; López-Larrea C.; Amado-Rodríguez L.; Lopez-Alonso I.; Hermida T.; Enriquez A. I.; Herrero P.; Melón S.; Alvarez-Argüelles M. E.; Boga J. A.; Rojo-Alba S.; Cuesta-Llavona E.; Alvarez V.; Lorca R.; Coto E. Angiotensin-Converting Enzymes (ACE, ACE2) Gene Variants and COVID-19 Outcome. Gene 2020, 762, 145102. 10.1016/j.gene.2020.145102. [DOI] [PMC free article] [PubMed] [Google Scholar]
- (55).Khongrum J.; Mairuae N.; Thanchomnang T.; Zhang M.; Bai G.; Palachai N. Synergistic Neuroprotection Through Epigenetic Modulation by Combined Curcumin-Enriched Turmeric Extract and L-Ascorbic Acid in Oxidative Stress-Induced SH-SY5Y Cell Damage. Foods Basel Switz. 2025, 14 (5), 892. 10.3390/foods14050892. [DOI] [PMC free article] [PubMed] [Google Scholar]
- (56).Chen X.; Shi C.; He M.; Xiong S.; Xia X. Endoplasmic Reticulum Stress: Molecular Mechanism and Therapeutic Targets. Signal Transduct. Target. Ther. 2023, 8 (1), 352. 10.1038/s41392-023-01570-w. [DOI] [PMC free article] [PubMed] [Google Scholar]
- (57).Shin W. S.; Di J.; Cao Q.; Li B.; Seidler P. M.; Murray K. A.; Bitan G.; Jiang L. Amyloid β-Protein Oligomers Promote the Uptake of Tau Fibril Seeds Potentiating Intracellular Tau Aggregation. Alzheimers Res. Ther. 2019, 11 (1), 86. 10.1186/s13195-019-0541-9. [DOI] [PMC free article] [PubMed] [Google Scholar]
- (58).Fontana I. C.; Zimmer A. R.; Rocha A. S.; Gosmann G.; Souza D. O.; Lourenco M. V.; Ferreira S. T.; Zimmer E. R. Amyloid-β Oligomers in Cellular Models of Alzheimer’s Disease. J. Neurochem. 2020, 155 (4), 348–369. 10.1111/jnc.15030. [DOI] [PubMed] [Google Scholar]
- (59).Murphy M. P.; Bayir H.; Belousov V.; Chang C. J.; Davies K. J. A.; Davies M. J.; Dick T. P.; Finkel T.; Forman H. J.; Janssen-Heininger Y.; Gems D.; Kagan V. E.; Kalyanaraman B.; Larsson N.-G.; Milne G. L.; Nyström T.; Poulsen H. E.; Radi R.; Van Remmen H.; Schumacker P. T.; Thornalley P. J.; Toyokuni S.; Winterbourn C. C.; Yin H.; Halliwell B. Guidelines for Measuring Reactive Oxygen Species and Oxidative Damage in Cells and in Vivo. Nat. Metab. 2022, 4 (6), 651–662. 10.1038/s42255-022-00591-z. [DOI] [PMC free article] [PubMed] [Google Scholar]
- (60).Tokmakov A. A.; Sato K.-I. Modulation of Intracellular ROS and Senescence-Associated Phenotypes of Xenopus Oocytes and Eggs by Selective Antioxidants. Antioxid. Basel Switz. 2021, 10 (7), 1068. 10.3390/antiox10071068. [DOI] [PMC free article] [PubMed] [Google Scholar]
- (61).González-Gualda E.; Baker A. G.; Fruk L.; Muñoz-Espín D. A Guide to Assessing Cellular Senescence in Vitro and in Vivo. FEBS J. 2021, 288 (1), 56–80. 10.1111/febs.15570. [DOI] [PubMed] [Google Scholar]
- (62).Higuchi A.; Satoh M.; Kobayashi K.; Cho C. S.; Akaike T.; Tak T. M.; Egashira S.; Matsuoka Y.; Natori S. H. Albumin and Urea Production by Hepatocytes Cultured on Polyurethane Foaming Membranes Coated with Extracellular Matrix. J. Membr. Sci. 2006, 280 (1–2), 983–989. 10.1016/j.memsci.2006.03.018. [DOI] [Google Scholar]
- (63).Brown R. A. M.; Epis M. R.; Horsham J. L.; Kabir T. D.; Richardson K. L.; Leedman P. J. Total RNA Extraction from Tissues for microRNA and Target Gene Expression Analysis: Not All Kits Are Created Equal. BMC Biotechnol. 2018, 18 (1), 16. 10.1186/s12896-018-0421-6. [DOI] [PMC free article] [PubMed] [Google Scholar]
- (64).Guo J.; Julien P. Y. Shear Stress in Smooth Rectangular Open-Channel Flows. J. Hydraul. Eng. 2005, 131 (1), 30–37. 10.1061/(ASCE)0733-9429(2005)131:1(30). [DOI] [Google Scholar]
- (65).Walsh M.; McGloughlin T.; Liepsch D. W.; O’Brien T.; Morris L.; Ansari A. R. On Using Experimentally Estimated Wall Shear Stresses to Validate Numerically Predicted Results. Proc. Inst. Mech. Eng. [H] 2003, 217 (2), 77–90. 10.1243/09544110360579286. [DOI] [PubMed] [Google Scholar]
- (66).Wang Y. I.; Shuler M. L. UniChip Enables Long-Term Recirculating Unidirectional Perfusion with Gravity-Driven Flow for Microphysiological Systems. Lab. Chip 2018, 18 (17), 2563–2574. 10.1039/C8LC00394G. [DOI] [PMC free article] [PubMed] [Google Scholar]
- (67).Rodrigues S. G.; Van Der Merwe S.; Krag A.; Wiest R. Gut-Liver Axis: Pathophysiological Concepts and Medical Perspective in Chronic Liver Diseases. Semin. Immunol. 2024, 71, 101859. 10.1016/j.smim.2023.101859. [DOI] [PubMed] [Google Scholar]
- (68).Carabotti M.; Scirocco A.; Maselli M. A.; Severi C. The Gut-Brain Axis: Interactions between Enteric Microbiota, Central and Enteric Nervous Systems. Ann. Gastroenterol. 2015, 28 (2), 203–209. [PMC free article] [PubMed] [Google Scholar]
- (69).Theobald J.; Ghanem A.; Wallisch P.; Banaeiyan A. A.; Andrade-Navarro M. A.; Taškova K.; Haltmeier M.; Kurtz A.; Becker H.; Reuter S.; Mrowka R.; Cheng X.; Wölfl S. Liver-Kidney-on-Chip To Study Toxicity of Drug Metabolites. ACS Biomater. Sci. Eng. 2018, 4 (1), 78–89. 10.1021/acsbiomaterials.7b00417. [DOI] [PubMed] [Google Scholar]
- (70).Kim J. B. Dynamic Cross Talk between Metabolic Organs in Obesity and Metabolic Diseases. Exp. Mol. Med. 2016, 48 (3), e214. 10.1038/emm.2015.119. [DOI] [PMC free article] [PubMed] [Google Scholar]
- (71).Jang K.-J.; Suh K.-Y. A Multi-Layer Microfluidic Device for Efficient Culture and Analysis of Renal Tubular Cells. Lab Chip 2010, 10 (1), 36–42. 10.1039/B907515A. [DOI] [PubMed] [Google Scholar]
- (72).Du Y.; Li N.; Yang H.; Luo C.; Gong Y.; Tong C.; Gao Y.; Lü S.; Long M. Mimicking Liver Sinusoidal Structures and Functions Using a 3D-Configured Microfluidic Chip. Lab. Chip 2017, 17 (5), 782–794. 10.1039/C6LC01374K. [DOI] [PubMed] [Google Scholar]
- (73).Hatamizadeh P. Cardiorenal Syndrome. Cardiol. Clin. 2021, 39 (3), 455–469. 10.1016/j.ccl.2021.05.001. [DOI] [PubMed] [Google Scholar]
- (74).Duan J.; Duan J.; Zhang Z.; Tong T. Irreversible Cellular Senescence Induced by Prolonged Exposure to H2O2 Involves DNA-Damage-and-Repair Genes and Telomere Shortening. Int. J. Biochem. Cell Biol. 2005, 37 (7), 1407–1420. 10.1016/j.biocel.2005.01.010. [DOI] [PubMed] [Google Scholar]
- (75).Bientinesi E.; Lulli M.; Becatti M.; Ristori S.; Margheri F.; Monti D. Doxorubicin-Induced Senescence in Normal Fibroblasts Promotes in Vitro Tumour Cell Growth and Invasiveness: The Role of Quercetin in Modulating These Processes. Mech. Ageing Dev. 2022, 206, 111689. 10.1016/j.mad.2022.111689. [DOI] [PubMed] [Google Scholar]
- (76).Zhang P.; Kishimoto Y.; Grammatikakis I.; Gottimukkala K.; Cutler R. G.; Zhang S.; Abdelmohsen K.; Bohr V. A.; Misra Sen J.; Gorospe M.; Mattson M. P. Senolytic Therapy Alleviates Aβ-Associated Oligodendrocyte Progenitor Cell Senescence and Cognitive Deficits in an Alzheimer’s Disease Model. Nat. Neurosci. 2019, 22 (5), 719–728. 10.1038/s41593-019-0372-9. [DOI] [PMC free article] [PubMed] [Google Scholar]
- (77).Jellbauer S.; Perez Lopez A.; Behnsen J.; Gao N.; Nguyen T.; Murphy C.; Edwards R. A.; Raffatellu M. Beneficial Effects of Sodium Phenylbutyrate Administration during Infection with Salmonella Enterica Serovar Typhimurium. Infect. Immun. 2016, 84 (9), 2639–2652. 10.1128/IAI.00132-16. [DOI] [PMC free article] [PubMed] [Google Scholar]
- (78).Grabowska W.; Mosieniak G.; Achtabowska N.; Czochara R.; Litwinienko G.; Bojko A.; Sikora E.; Bielak-Zmijewska A. Curcumin Induces Multiple Signaling Pathways Leading to Vascular Smooth Muscle Cell Senescence. Biogerontology 2019, 20 (6), 783–798. 10.1007/s10522-019-09825-2. [DOI] [PMC free article] [PubMed] [Google Scholar]
- (79).Chu S.; Joma N.; Yong H. W.; Maysinger D.; Kakkar A.; Stochaj U. Curcumin and Butyrate Induce Fibroblast Senescence without the Emergence of Fibrosis Biomarkers. Asp. Mol. Med. 2023, 2, 100021. 10.1016/j.amolm.2023.100021. [DOI] [Google Scholar]
- (80).Iannitti T.; Palmieri B. Clinical and Experimental Applications of Sodium Phenylbutyrate. Drugs RD 2011, 11 (3), 227–249. 10.2165/11591280-000000000-00000. [DOI] [PMC free article] [PubMed] [Google Scholar]
- (81).Tanis R. M.; Piroli G. G.; Day S. D.; Frizzell N. The Effect of Glucose Concentration and Sodium Phenylbutyrate Treatment on Mitochondrial Bioenergetics and ER Stress in 3T3-L1 Adipocytes. Biochim. Biophys. Acta 2015, 1853 (1), 213–221. 10.1016/j.bbamcr.2014.10.012. [DOI] [PMC free article] [PubMed] [Google Scholar]
- (82).Wu X.; Zhou X.; Lai S.; Liu J.; Qi J. Curcumin Activates Nrf2/ HO −1 Signaling to Relieve Diabetic Cardiomyopathy Injury by Reducing ROS in Vitro and in Vivo. FASEB J. 2022, 36 (9), e22505. 10.1096/fj.202200543RRR. [DOI] [PubMed] [Google Scholar]
- (83).Cerullo M.; Armeli F.; Mengoni B.; Menin M.; Crudeli M. L.; Businaro R. Curcumin Modulation of the Gut-Brain Axis for Neuroinflammation and Metabolic Disorders Prevention and Treatment. Nutrients 2025, 17 (9), 1430. 10.3390/nu17091430. [DOI] [PMC free article] [PubMed] [Google Scholar]
- (84).Jangra A.; Sriram C. S.; Dwivedi S.; Gurjar S. S.; Hussain M. I.; Borah P.; Lahkar M. Sodium Phenylbutyrate and Edaravone Abrogate Chronic Restraint Stress-Induced Behavioral Deficits: Implication of Oxido-Nitrosative, Endoplasmic Reticulum Stress Cascade, and Neuroinflammation. Cell. Mol. Neurobiol. 2017, 37 (1), 65–81. 10.1007/s10571-016-0344-5. [DOI] [PMC free article] [PubMed] [Google Scholar]
- (85).Carloni S.; Rescigno M. The Gut-Brain Vascular Axis in Neuroinflammation. Semin. Immunol. 2023, 69, 101802. 10.1016/j.smim.2023.101802. [DOI] [PubMed] [Google Scholar]
- (86).Kurhaluk N.; Kamiński P.; Bilski R.; Kołodziejska R.; Woźniak A.; Tkaczenko H. Role of Antioxidants in Modulating the Microbiota–Gut–Brain Axis and Their Impact on Neurodegenerative Diseases. Int. J. Mol. Sci. 2025, 26 (8), 3658. 10.3390/ijms26083658. [DOI] [PMC free article] [PubMed] [Google Scholar]
- (87).Kurniawan D. A.; Leo S.; Inamatsu M.; Funaoka S.; Aihara T.; Aiko M.; Rei I.; Sakura T.; Arakawa H.; Kato Y.; Matsugi T.; Esashika K.; Shiraki N.; Kume S.; Shinha K.; Kimura H.; Nishikawa M.; Sakai Y. Gut-Liver Microphysiological Systems Revealed Potential Crosstalk Mechanism Modulating Drug Metabolism. PNAS Nexus 2024, 3 (2), pgae070. 10.1093/pnasnexus/pgae070. [DOI] [PMC free article] [PubMed] [Google Scholar]
- (88).Kim J. J.; Bae M.; Cho D. Multi-Organ Microphysiological Systems Targeting Specific Organs for Recapitulating Disease Phenotypes via Organ Crosstalk. Small Sci. 2024, 4 (11), 2400314. 10.1002/smsc.202400314. [DOI] [PMC free article] [PubMed] [Google Scholar]
- (89).Amartumur S.; Nguyen H.; Huynh T.; Kim T. S.; Woo R.-S.; Oh E.; Kim K. K.; Lee L. P.; Heo C. Neuropathogenesis-on-Chips for Neurodegenerative Diseases. Nat. Commun. 2024, 15 (1), 2219. 10.1038/s41467-024-46554-8. [DOI] [PMC free article] [PubMed] [Google Scholar]
- (90).Azizgolshani H.; Coppeta J. R.; Vedula E. M.; Marr E. E.; Cain B. P.; Luu R. J.; Lech M. P.; Kann S. H.; Mulhern T. J.; Tandon V.; Tan K.; Haroutunian N. J.; Keegan P.; Rogers M.; Gard A. L.; Baldwin K. B.; De Souza J. C.; Hoefler B. C.; Bale S. S.; Kratchman L. B.; Zorn A.; Patterson A.; Kim E. S.; Petrie T. A.; Wiellette E. L.; Williams C.; Isenberg B. C.; Charest J. L. High-Throughput Organ-on-Chip Platform with Integrated Programmable Fluid Flow and Real-Time Sensing for Complex Tissue Models in Drug Development Workflows. Lab. Chip 2021, 21 (8), 1454–1474. 10.1039/D1LC00067E. [DOI] [PubMed] [Google Scholar]
- (91).Ma C.; Peng Y.; Li H.; Chen W. Organ-on-a-Chip: A New Paradigm for Drug Development. Trends Pharmacol. Sci. 2021, 42 (2), 119–133. 10.1016/j.tips.2020.11.009. [DOI] [PMC free article] [PubMed] [Google Scholar]
Associated Data
This section collects any data citations, data availability statements, or supplementary materials included in this article.
Supplementary Materials
Data Availability Statement
Z-stack images of selected organ models will be posted in the Supplemental Information Section. RTPCR Data will be made available. The protocol for multiorgan culture using 3D gel is available in mathematical formula-enabled forms on the Biopico Systems Inc. website: https://biopico.com/organ-culture-estimate/