

Abstract
Neurofilament light (NfL) is a neuron-specific protein integral to neuronal cytoskeletons. Upon damage to the central or peripheral nervous system (NS), NfL is released into cerebrospinal fluid and blood. Elevated serum or plasma NfL levels have been reported in a variety of diseases and NS injury states. However, although intraindividual longitudinal NfL changes may be more meaningful than NfL measurements at a single timepoint, data on the longitudinal variation of NfL in normal healthy volunteers (NHV) are scarce. We investigated normal variation in NHV serum NfL and estimate an upper limit of normal (ULN) of NfL variation in longitudinal samples. An initial cross-sectional screening in sera from 270 NHV using a 4-plex assay detected NfL in 99.6% and glial fibrillary acidic protein (GFAP) in 100%, while Tau (67.4%), and Ubiquitin Carboxyl-Terminal Hydrolase L1 (UCH-L1, 4.1%) were less frequently detectable. An age-dependent increase was found in NfL (2.36% per year) and GFAP (1.18% per year). Longitudinal evaluation of NfL was then conducted in a separate cohort of 80 NHV at baseline, day 14 (range 11–17), and day 28 (range 26–56). A 1.64-fold increase from baseline in serum NfL was calculated as the ULN. Putting this threshold into context with published reports on NfL across a large variety of injury and disease settings, the 1.64-fold threshold is well positioned to discriminate between healthy and NS injury. Altogether, these findings provide a framework for longitudinal monitoring of serum NfL as a biomarker for neuronal damage in multiple contexts of use, including drug-induced injury.
Supplementary Information
The online version contains supplementary material available at 10.1007/s00415-025-13246-2.
Keywords: Neurofilament light chain, NfL, GFAP, Tau, UCH-L1, Biomarker
Introduction
Neurofilament light (NfL) is a member of a family of neuron-specific proteins critical to the neuronal cytoskeleton [30]. Upon damage to neurons in either the central nervous system (CNS) or peripheral nervous system (PNS), NfL is released into the cerebrospinal fluid (CSF) and blood. Elevations in serum or plasma NfL have been found in a wide variety of diseases or injury states affecting the CNS, from chronic neurodegenerative diseases like Alzheimer’s disease (AD) [7, 33] and amyotrophic lateral sclerosis (ALS) [3, 19], neuroinflammatory disorders such as multiple sclerosis (MS) [29, 59] and anti-NMDA receptor encephalitis [31] to acute injury such as traumatic brain injury (TBI) [27, 43] or stroke [20]. Likewise, elevations in serum or plasma NfL have been found in relation to PNS injury from various causes, such as chemotherapy-induced peripheral neuropathy [24] or Guillain-Barré syndrome [32].
The half-life of soluble NfL in serum has been estimated to be 43 days [34], which positions NfL as a durable, non-invasive biomarker of neuronal damage days or even weeks following acute injury, or in response to chronic degenerative conditions. Conversely, longitudinal monitoring of changes in NfL in neurological diseases offers a potential biomarker of disease activity or severity. In this context, NfL has been adopted as a therapy response biomarker in several clinical trials, including tofersen, which was recently accepted by the FDA for treatment of amyotrophic lateral sclerosis (ALS) [35, 55].
Notably, serum/plasma NfL is a sensitive biomarker of neuronal damage, often appearing ahead of overt damage and functional changes measured by other methods. A large UK Biobank cohort study found that plasma NfL levels were elevated in ALS patients 2 years prior to diagnosis [46]. A Danish cohort found evidence of a subset of MS patients with elevated plasma NfL up to 9 years prior to first clinical symptom onset [8]. Certain genetic neurologic disorders have offered the opportunity to characterize potential biomarkers in a pre-symptomatic phase of disease. In spinocerebellar ataxia type 1 (SCA1) and type 3 (SCA3), for example, NfL increases have been detected in patients prior to clinical onset of ataxia in multiple cohorts [48, 57, 58].
The sensitivity and stability of serum or plasma NfL could also prove useful as a biomarker in a safety context to facilitate monitoring of potential CNS or PNS toxicities in clinical trials. Adverse neurological conditions are an undesirable side effect of many drugs [17]. Tragic unexpected fatal neurotoxicity can occur in Phase I clinical trials, as exemplified by the 2016 Bial incident [22, 52]. Phase I studies are typically small studies in normal healthy volunteers (NHV) aimed at characterizing a new drug’s pharmacokinetic properties and evaluating safety and tolerability. As this is the setting for first-in-human testing of a new drug, preclinical studies are typically relied upon to identify potential dose-limiting toxicities. Serum or plasma NfL has been demonstrated to be a sensitive biomarker of drug-induced damage in rats in response to a variety of pharmacologic nervous system (NS) toxicants [51]. NfL elevations have also been correlated to, and often precede, functional and morphological endpoints of dorsal root ganglia toxicities in rat and non-human primates treated with recombinant adeno-associated viral therapeutics [18, 25, 49]. Thus, NfL may have translational value as a biomarker for drug-induced nervous system injury (DINI).
Both in the context of DINI, and when using NfL as a biomarker for activity or severity of neurological diseases, longitudinal changes of NfL may be more meaningful than measurements of NfL at single timepoints. Nevertheless, data on the longitudinal variation of NfL in NHV are scarce, making it difficult to define thresholds above which longitudinal increases of NfL may be considered pathological. A workgroup dedicated to regulatory qualification of novel DINI biomarkers was formed as a part of the Translational Safety Biomarker (TransBioLine) project, a public–private consortium funded by the European Union’s Innovative Medicines Initiative. TransBioLine aimed to develop biomarkers for various organ-specific drug-induced injuries and advance regulatory qualification through the FDA Biomarker Qualification Program and the EMA Qualification of novel methodologies for medicine development. As a part of the DINI biomarker qualification effort, we aimed to better understand variation of serum NfL in NHV, as well as other potential biomarkers of neurodegenerative disease/injury, including glial fibrillary acidic protein (GFAP), Tau, and Ubiquitin Carboxyl-Terminal Hydrolase L1 (UCH-L1) [2, 42, 47].
The present study describes serum biomarker data collected from NHV meeting typical Phase 1 inclusion criteria. A cross-sectional screening was first performed in serum using a 4-plex assay measuring NfL, GFAP, Tau, and UCH-L1 (cohort 1, n = 270 NHV). A longitudinal evaluation of NfL was then conducted in a separate cohort (cohort 2) of NHV (n = 80) at 3 different time points to estimate an upper-limit of normal (ULN) for a fold change from baseline, to derive a threshold of concern that could be applied to a Context of Use as a safety biomarker in Phase I clinical trials. Finally, we summarize published reports of NfL fold changes for a large variety of injury and disease states to provide a context to the ULN calculated based on NHV data.
Methods
Clinical participants
Normal healthy volunteers (NHV) were recruited at the Pfizer Clinical Research Unit in Brussels, Belgium. Detailed inclusion/exclusion criteria are listed in the Supplement. Briefly, the eligible age range for cohort 1 and 2 was defined as 18–65 and 18–80 years, respectively, at the time of screening. Classification as overtly healthy was determined by medical examination including detailed medical history, full physical examination, clinical laboratory tests, and cardiovascular tests. All participants have signed informed consent documents and are able to comply with scheduled visits, treatment plans, laboratory tests, lifestyle considerations, and other study procedures. All the studies were conducted based on country-specific regulatory guidelines relating to safety reporting to the regulatory authority, institutional review boards (IRBs)/ethics committees (ECs), and investigators. The studies were conducted in accordance with the protocol, legal and regulatory requirements, the general principles outlined in the International Ethical Guidelines for Biomedical Research Involving Human Participants, the ICH Guideline for Good Clinical Practice, and the Declaration of Helsinki.
Sample collection
This study involves analysis of two separate NHV cohorts. Cohort 1 was a cross-sectional design intended as a screening for potential biomarkers of neurotoxicity and to establish reference ranges in Phase 1 clinical trial populations at a single time point. This involved collection of a single blood sample from a total of 270 NHVs, which were enrolled as participants in Phase I clinical trials. Cohort 2 was intended to derive longitudinal NfL data from 80 NHV, with samples collected at baseline and at two follow-up visits a median (range) of 14 (11–17) and 28 (26–56) days after the baseline visit, for a total of three visits.
Whole blood was drawn into 10 mL Vacutainer plastic serum tubes with red BD Hemogard closure from Becton Dickinson (Franklin Lakes, NJ, USA) following standard phlebotomy practices and procedures. Immediately after collection, the collection tube was inverted four to six times and stored upright at room temperature until clotted (approximately 30–45 min). After blood clotted, the samples were centrifuged at 1500–2000g for 10 min in a refrigerated centrifuge (2–8⁰C). Within 30 min of centrifugation, serum was transferred to a freezer vial, immediately frozen at ≤ − 70⁰C, and stored at Pfizer’s Clinical Biobank. Serum was shipped to NMI/SIGNATOPE GmbH (Reutlingen, Germany) for biomarker analysis.
Biomarker analysis
In Cohort 1, NfL, GFAP, UCH-L1, and Tau (total Tau protein) were measured using the ultra-sensitive single molecule array (SIMOA) technology with the Simoa N4PA Advantage Kit (for Tau, NfL, GFAP, UCH-L1) from Quanterix (Billerica, MA, USA) following fit-for-purpose assay validation. As part of the validation, sample stability was confirmed out to 2 years (all samples were assayed within 2 years of collection). For Cohort 2, the Simoa Nf-light Advantage 2 Kit from Quanterix was used to measure NfL. A bridging study was performed to ensure that the results were consistent across the two kits.
As the manufacturer did not provide any acceptance criteria for sample analysis or assay performance, generally accepted criteria were applied for the included QC samples and for the analysis of study samples. These criteria were based on commonly used standards, such as those outlined in the FDA Bioanalytical Method Validation for Biomarkers—Guidance for Industry (https://www.fda.gov/regulatory-information/search-fda-guidance-documents/bioanalytical-method-validation-guidance-industry). Quality control (QC) samples were included into each conducted assay to ensure data reliability. For the 4-plex assay, encompassing NfL, GFAP, Tau, and UCH-L1, a total of seven QC samples were included to effectively encompass the assay ranges for the different analytes. The QC samples were prepared as individual aliquots for single use, and were consistently included in all assay runs. Predefined criteria were met (accuracy within ± 25% of the nominal concentration and precision ≤ 20% coefficient of variation (CV) for at least two-thirds of QC samples within the assay range between the ULOQ and LLOQ)) and confirmed performance of each analyte measurement within every run. In each run, freshly thawed single-use calibrators were included and acceptance criteria were applied (precision of duplicates should be ≤ 20% and ≤ 25% at the LLOQ and ULOQ; accuracy ± 20%; ± 25% at LLOQ and ULOQ). For all samples, a CV criterion of duplicate measurement of ≤ 20% was applied. If this criterion was not met, sample analysis was repeated if possible, and if this was not possible or another invalid result was obtained, no valid result (NVR) was reported. Biomarker data from all participants can be found in the Supplement.
Statistical analysis
For Cohort 1, an independent t-test was used to compare values of each biomarker between participants with white ethnic background and all other participants, and between male and female. A simple linear regression between each biomarker value and age was fitted to evaluate the effect of age on biomarker values. The biomarker values were first log transformed for a linear regression analysis. The percent change per year was calculated using the estimated linear regression for each biomarker. Normal reference ranges across age were obtained from the regression analysis that considers age as a covariate. Model-based predicted average values of a biomarker across age, and 90% lower and upper limits of normal intervals were determined.
For Cohort 2, to evaluate the significance of the fixed effect of the different covariates, an Analysis of Variance (ANOVA) test was performed on the mixed effects model to account for the repeated measures of the same participant for each covariate separately. Each covariate was then added to the model which was then tested simultaneously. The covariates examined were time of day, body mass index (BMI), sex, age, and assay batch. The null hypothesis posits that the covariate has no impact on the baseline-adjusted log-transformed concentration. The test compares the model with the fixed effect (covariate) to a null model without the fixed effect. The test statistic follows an F-distribution, and the p-value indicates the probability of observing the data if the null hypothesis were true. As the only significant covariate, the batch effect variable was regressed out from the log base 2 transformed NfL concentration (pg/ml) laboratory results, as samples belonging to the same participants were not consistently measured in the same assay run. The fold difference from baseline (first visit) was calculated for each participant by subtracting the batch-corrected log-transformed laboratory results from the batch-corrected log-transformed laboratory values at subsequent visits. The upper limit of normal was based on the 95% confidence interval. Nonparametric resampling with 5000 bootstrap replicates was used to estimate the confidence intervals using adjusted percentile on the lower and upper limits, which was implemented using the boot R package [13, 16].
Literature review
PubMed articles were searched from July 2013 to Sept 2024 for articles referencing NfL or known synonyms associated with the gene symbol NEFL using I2E (Linguamatics, Cambridge, UK). Only papers with disease/damage state versus a control condition or baseline that calculated a fold-change or provided absolute values that enabled calculation of a fold difference, were retained. Fold difference values were graphed using GraphPad Prism 10.
Results
Cohort 1: Cross-sectional analysis for screening of biomarkers for neurotoxicity in serum and to define reference ranges in a phase 1 clinical trial population
Cohort 1 consisted of 270 participants total, including 228 male and 42 female participants. The mean (range) age of these participants was 37 (18–65) years. Of the 270 participants, 217 participants were White, 26 participants were Asian, 20 participants were Black, and 7 participants were of other origin (Table 1).
Table 1.
Demographic summary for each NHV cohort
| N | Mean Age | Age Range | M/F | Race | |
|---|---|---|---|---|---|
| Cohort 1 | 270 | 37 | 18–65 | 228/42 | 217 W, 26 A, 20 B, 7 O |
| Cohort 2 | 80 | 42.3 | 19–80 | 43/37 | 77 W, 2 B, 1 A |
M/F # of males/# of females; W white, A Asian, B black, O other origin
The descriptive summaries of biomarker values for NfL, GFAP, Tau, and UCH-L1 are presented in Table 2. In terms of absolute values, the mean (range) serum levels of GFAP were highest (101.4, 40.1–299 pg/mL), followed by UCH-L1 (76, 57–149 pg/mL), NfL (8.1, 2.9–37.2 pg/mL), and Tau (1, 0.5–3.2 pg/mL). GFAP was detectable in all 270 (100%) participants, NfL was detectable in 269 (99.6%) participants, while Tau was detectable in 182 participants (67.4%). Of note, UCH-L1 was detectable in only 11 (4.1%) participants and was thus not included for further analysis.
Table 2.
Summary of biomarker data for NHV in Cohort 1
| Biomarker | N | Min (pg/mL) | Max (pg/mL) | IQR (pg/mL) | Average (pg/mL) | SD (pg/mL) | SE (pg/mL) |
|---|---|---|---|---|---|---|---|
| NfL | 269 | 2.91 | 37.20 | 4.36 | 8.06 | 4.22 | 0.26 |
| GFAP | 270 | 40.10 | 299.00 | 44.97 | 101.40 | 39.49 | 2.40 |
| UCH-L1 | 11 | 57.00 | 149.00 | 12.05 | 75.96 | 31.25 | 9.42 |
| Tau | 182 | 0.49 | 3.23 | 0.36 | 0.96 | 0.38 | 0.03 |
N reported are only for samples above the LLOQ. IQR inter-quartile range, SD standard deviation, SE standard error
No significant effect of race or sex was observed on NfL, GFAP or Tau. A significant effect of age was detected for NfL and GFAP, where biomarker levels positively associated with age in healthy volunteers. Normal reference ranges were obtained from a regression analysis that considered age as a covariate. Model-based predicted average values of a biomarker across age, and 90% lower and upper limits of normal intervals determined are shown in Fig. 1. NfL was estimated to increase at a rate of 2.36% per year, and GFAP was estimated to increase at a rate of 1.18% per year. Inclusion of sex or both sex and race in the model alongside age did not appreciably alter these estimates.
Fig. 1.

Normal intervals for serum NfL (A) and GFAP (B) exhibiting an age-dependent increase in NHV, while serum Tau (C) is relatively constant with age. The red line represents the model-based predicted average values; dashed blue lines represent the 90% normal intervals
Cohort 2: Longitudinal analysis to characterize intra-participant variability
Based on the data obtained in Cohort 1 and abundant literature evidence, NfL appeared to be the most promising biomarker for detection of DINI in serum. We therefore went on to evaluate longitudinal variation of serum NfL in a separate cohort of NHV. Cohort 2 consisted of 80 participants total, including 43 male and 37 female participants. The median (range) age of these participants was 42.5 (19–80) years. Of the 80 participants, 77 participants were White, 2 participants were Black, and 1 participant was Asian (Table 1).
To understand the upper limit of normal (ULN) variation in NfL with repeated sampling from the same participant, a series of 3 blood samples were collected from each participant, where consecutive visits were ~ 2 weeks apart; NfL was measurable from all samples. Within-individual variance (7.9%) was over 10 times lower than between-individual variation (92.1%) (Fig. 2). NfL biomarker values (pg/mL) were log2-transformed, and values for visit 2 and visit 3 were normalized to visit 1 (baseline). Time of day for blood collection, BMI, sex, age and assay batch (run) were evaluated as potential covariates by ANOVA (Suppl Table 1). Assay batch was the only significant covariate, so this variable was regressed out from the log2-transformed NfL concentrations (samples from the same patient should ideally be batched together for future studies using this particular assay if longitudinal measurement is the primary goal). Age was not statistically significant covariate; a plot of baseline-normalized NfL over age is shown in covariate Fig. 3.
Fig. 2.

Intra-participant variation across 3 visits is lower than inter-participant variation. Each point represents a single participant. Lines connect values for subsequent visits for each participant. The LLOQ of NfL was 2.22 pg/mL
Fig. 3.

Baseline-normalized NfL does not exhibit a significant impact of age. Fold change NfL values in NHV were plotted against age at visit 2 and visit 3 normalized to visit 1 (baseline)
After batch correction, log2-transformed, baseline-adjusted NfL values were plotted, and the 95% confidence intervals (CI) calculated (Fig. 4). Mean baseline-adjusted fold change for visit 2 was 0.98, and for visit 3 was 1.00. The upper limit fold change from baseline at visit 2 and 3 was 1.43 and 1.64, respectively (Suppl Table 2). For the purpose of setting an upper limit of normal (ULN), the larger of the intervals, i.e., 1.64, was selected as a threshold to signify potential nervous system injury. To extrapolate from this cohort to a larger population, CI around the limits were estimated using bootstrapping. The 95% CI limits around the ULN of 1.64 ranged from 1.43 to 2.10.
Fig. 4.

Batch-adjusted, baseline-normalized NfL values showing 95% confidence intervals for visits 2 and 3 were used to calculate ULN fold change. Boxes indicate the interquartile range, line within the box indicates the mean, whiskers indicate the range, and dots indicate individual participant data (grey dots are values falling within the interquartile range, while black dots are values falling outside the interquartile range)
Comparison of proposed threshold against published literature
NfL has been studied extensively in CSF and serum or plasma in a variety of NS injury or disease settings over the past decade. A review of manuscripts published between July 2013 to Sept 2024 that reported a significant fold difference in serum or plasma NfL relative to a control cohort (or provided data enabling this calculation) for neurologic and psychiatric disorders as well as other forms of NS injury was performed. For 9% of the data points, the contrast was not between-group, but rather within-group (fold change relative to baseline). While some of the manuscripts reported NfL values using ELISA kits, 84% of the published studies measured NfL using the Quanterix SIMOA platform. A summary of 80 publications that reported significant changes in serum or plasma NfL in CNS injury or disease is presented in Suppl Table 3. This list includes drug-induced injuries, such as ketamine dependence [23] and immune-effector cell-associated neurotoxicity syndrome (ICANS) [11]. Associations between elevated serum or plasma NfL and neurologic injury or disease have been observed in patients ranging from young children with genetic disorders such as neuronal ceroid lipofuscinosis [41], to young adults with eclampsia [6], traumatic brain injury [44] or anti-NMDA receptor encephalitis [31], to older adults suffering from a variety of neurodegenerative diseases with clear genetic causes (e.g., spinocerebellar ataxia) to disorders with less well understood etiology like Alzheimer’s disease and MS. The median fold difference compared to healthy controls for elevated serum or plasma NfL associated with CNS damage based on 110 datasets was 2.83 (Fig. 5), with significant fold differences ranging from 1.1 (pre-symptomatic MS [26]) to 92.3 (GM-1 gangliosidosis [56]).
Fig. 5.
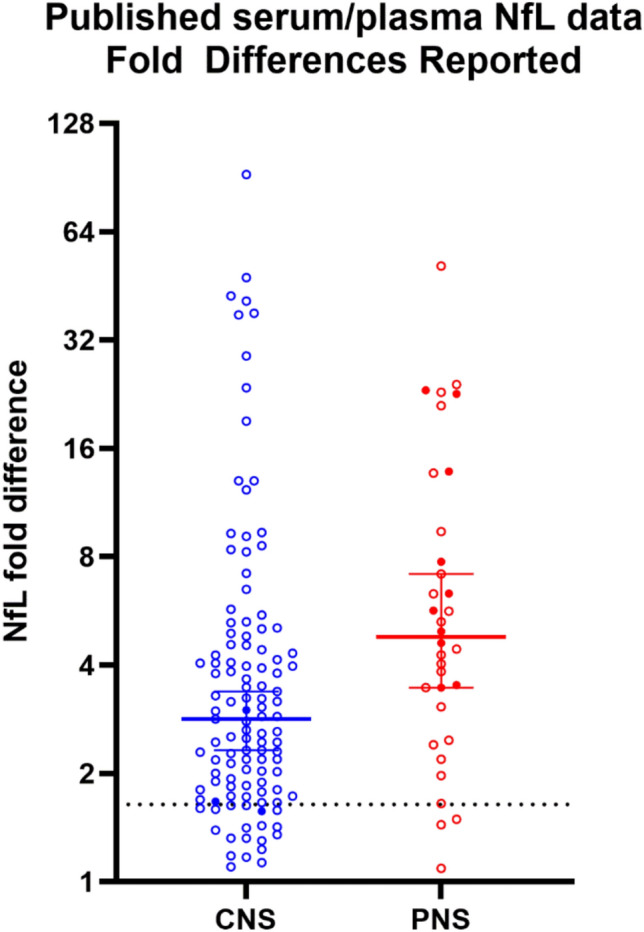
Plotting fold differences reported from published studies between 2013–2024 shows that most studies found fold differences in excess of the ULN calculated from NHV. Each point represents a fold change versus a control group (open circles) or baseline (filled circles); lines with brackets denote median and 95% CI. The hashed line represents 1.64-fold (the ULN derived from NHV longitudinal data)
Like the CNS, serum NfL has been associated with a variety of disease and injuries impacting the PNS. A summary of 27 publications reporting PNS damage associated with significant NfL elevation is provided in Suppl Table 4. As with NfL associations with CNS injury and disease, the causes vary from genetic conditions such as hereditary transthyretin amyloidosis neuropathy to inflammatory diseases to chemotherapy-induced peripheral neuropathy [10, 24].
The median fold difference for 34 datasets from these PNS damage publications was 4.79-fold, with significant fold differences ranging from 1.1 (pre-sarcopenia [38]) to 51.3 (Guillain–Barre syndrome [28]). Of the combined PNS and CNS injury datasets, 127/149 (85%) of the reported fold differences fell above the estimated ULN threshold of 1.64. Thus, the ULN threshold derived from NHV serum in the present study appears to be well-positioned to capture meaningful changes across a variety of both CNS and PNS insults.
Discussion
NfL is gaining attention as a sensitive biomarker in various contexts of NS damage and disease. The present study aimed to enhance our understanding of serum NfL levels in NHVs, as measured using Quanterix SIMOA assays. A screening for four potential biomarkers of neurotoxicity in serum was performed and reference ranges in serum for a Phase 1 clinical trial population were established with a cross-sectional cohort of 270 Phase 1 clinical trial participants, demonstrating age-dependence of NfL and GFAP, but not Tau (though ~ 1/3 of samples were < LLOQ for Tau). Most of the NHV serum samples were < LLOQ for UCH-L1. NfL was further studied with longitudinal sampling from 80 participants to estimate variance from baseline over a 2–4-week period. The calculated ULN (based on 95% CI) was 1.64-fold change from baseline. To put this value into context, published reports of fold changes in serum or plasma NfL were compiled for a variety of CNS and PNS disorders. These predominantly case–control studies highlighted the Quanterix SIMOA as the currently most widely used platform for measuring NfL in humans, and 85% of reported significant fold disease or damage-related changes exceeded the proposed threshold of 1.64.
The NfL reference range values in the Phase 1 clinical trial population analyzed in the present study are in line with similar evaluations of serum or plasma NfL from NHVs. In three different large (> 1,500 participants) cohorts of NHVs, measured by SIMOA (Quanterix) or Atellica (Siemens Healthineers) platforms, the association between age and NfL was observed, and handled by binning participants with different age ranges [4, 45, 50]. In a recent study with over 5,000 healthy controls, a model was created using both age and BMI to enable conversion of raw NfL values to a z-score for ages 20–75 years [5]. This study found that the rate of increase in serum NfL was not linear, but increased faster over age 50. A recent analysis of 116 healthy control participants demonstrated a similar range of values in serum for both NfL and GFAP, and both were shown to increase with age, though only NfL was impacted by BMI [40]. The limited assay sensitivity for detection of Tau, and even more so UCHL1, in NHVs restricts the utility of these biomarkers when measured in serum for contexts involving NHV assessments.
Of the four biomarkers measured in the cross-sectional cohort, NfL is the most extensively studied blood-based biomarker across a range of nervous system diseases, and was the most sensitive biomarker identified in rats across a panel of neurotoxic compounds [51]. As a non-invasive biomarker of NS damage, the ability to make longitudinal measurements of serum NfL allows for normalization of factors such as age which might otherwise need to be accounted for. The present study sought to understand variation in a timeframe relevant to a Phase I clinical trial, and estimated that 1.64-fold change from baseline represents the ULN (95% CI). A prior study evaluated 20 participants aged 40–60 years with longitudinal weekly serum sampling and SIMOA-assessed NfL for 10 weeks determined that between-participant variance was 3-times higher than within-participant variance [9]. Similar results were obtained on the Siemens platform in a study measuring plasma NfL from 24 NHV participants for 10 consecutive weeks [14]. Additional longitudinal analyses of neurodegenerative diseaseas like Huntington’s disease have included control subjects in longer term (5–15 years), and have demonstrated a different rate of age-dependent NfL increase in disease versus control, evaluating plasma or serum NfL by MSD or Quanterix [12, 37, 53]. While these studies characterized variance, novelty in the present study includes estimating a ULN fold-change from baseline NHV. A cross-platform comparison of plasma NfL values from ALS and MS participants on Quanterix SIMOA, Roche Elecsys, Siemens Atellica and Fujirebio Lumipulse all showed a strong correlation between platforms [1]. Thus, while absolute values may not align 100% between platforms, monitoring changes from baseline is expected to have broader utility in using NfL as a biomarker in the clinic.
The specific ULN threshold determined by the present study will need to be validated in a larger cohort or confirmed in a clinical study, despite a cohort size in excess of a typical Phase I study and use of bootstrapping to extrapolate from the n = 80 cohort evaluated here. The evaluation of published studies reported here relied predominantly on between-group comparisons (e.g., diseased vs healthy), though only 15% of these studies fell below the 1.64-fold threshold. While these kinds of comparisons help to put the ULN threshold into some perspective, the increased inter- vs intra-individual variation in serum NfL levels demonstrates that comparing a patient’s NfL level to their own baseline will give greater power to see a change. NfL is predominantly, if not exclusively, expressed in neurons, making it a highly specific biomarker for neuroaxonal injury. While serum NfL cannot pinpoint the mechanism of the insult, or even discriminate CNS from PNS injury, it appears to be a sensitive indicator of neuroaxonal injury from a wide variety of sources. Some of the diseases in which serum or plasma NfL increases can develop over the course of several years, while drug-induced changes happen on a timescale of days to weeks, and acute trauma may be measured on a scale of hours. This variety in underlying causes of neuronal damage leading to NfL elevations in blood supports the notion that NfL could be a useful biomarker of NS injury from a variety of mechanisms associated with novel therapies. There is already precedent for serum NfL as a biomarker of neurotoxicity caused by chemotherapy or chimeric antigen receptor T-cell (CAR-T) therapy [11, 21, 24].
The aim of the TransBioLine team that conducted the present study was to qualify a biomarker for use in Phase I trials in NHVs when there is an a priori concern that a drug may cause acute NS injury in humans. The a priori evidence could originate from traditional preclinical toxicology studies but may also derive from anticipated class safety risk based on mechanism of action. Upwards of 14% of new drug candidates were discontinued in preclinical development due to neurotoxicity in a representative pharmaceutical company survey [15, 39]. A similar proportion (16%) of post-marketing withdrawals have been associated with neurotoxicity [36], suggesting that current preclinical bioassays do not detect a significant proportion of neurotoxic drugs during development [54]. Although imaging (MRI, CT), neuropsychological testing and clinical examinations may be used to detect nervous system (NS) injury, these tools are not particularly sensitive, nor are they practical or cost-effective in Phase 1 clinical trial settings. Therefore, there is a pressing unmet medical need for sensitive, blood-based monitorable safety biomarkers to prevent healthy volunteers (HVs) and patients from serious, irreversible NS injury and to guide decision-making in early clinical trials. Moreover, the availability of such biomarkers would facilitate advancing potential breakthrough therapies safely into the clinic.
While the reference ranges obtained in Cohort 1 may be representative for a typical Phase 1 clinical trial population, their generalizability to other and especially older populations may be limited. Indeed, age-matched controls for neurodegenerative disease cohorts will likely exceed the upper age range tested here. Another limitation of Cohort 1 is that it did not evaluate BMI in the reference range dataset. However, this covariate was secondary to age in the one published reference range dataset that examined both covariates [5], and was not significant in cohort 2 when evaluating baseline-normalized values. Another limitation of Cohort 1 is the lack of diversity; the cohort was 84% male and 80% white. While prior studies have not found sex to be a significant covariate for NfL, lack of racial/ethnic diversity have generally precluded thorough examination of this variable as a covariate. Of note, as the longitudinal study was deemed to be more critical to establishing an ULN, the gender distribution was balanced in this study. It also needs to be considered that the results obtained in this work pertain to the specific NfL assay used in our study. Finally, our studies were not designed to enable establishing a diagnostic threshold for a specific disease state, rather, they were designed to provide a guide for decision-making in the context of acute NS injury.
In conclusion, the present study provides reference ranges of the age-dependent biomarkers NfL and GFAP, and the age-independent biomarker Tau in a Phase 1 clinical trial population. NfL was measured across three consecutive clinical visits in a large longitudinal cohort of NHV, which enabled estimation of a 1.64-fold change from baseline as an ULN. This value is supported by a wide range of published neuronal injury and disease datasets, and thus may provide a useful threshold for monitoring for NS injury in NHV, such as a Phase1 clinical trial.
Supplementary Information
Below is the link to the electronic supplementary material.
Below is the link to the electronic supplementary material.
Acknowledgements
The authors would like to acknowledge Cheyenne Bolanos, Jennifer Stambaugh, and Nicole Williams for sample logistics, Tanja Zabka, Cathy Ruff and Seid Hamzic for input on experimental design and analysis, and the TransBioLine DINI team for critical review of the manuscript. NMI received financial support from the State Ministry of Baden-Wuerttemberg for Economic Affairs, Labour and Tourism.
Funding
Innovative Medicines Initiative,821283
Declarations
Conflicts of interest
TAL, CJS, KAF, SAP, and SKR were employees of Pfizer Inc., KV was an employee of Merck Sharp & Dohme LLC, a subsidiary of Merck & Co., Inc., FT was an employee of Johnson & Johnson, and TK-T was an employee of Roche Pharma at the time this work was performed. KR received research support from Novartis, Merck Serono, German Ministry of Education and Research, European Union (821283–2), Stiftung Charité, Guthy-Jackson Charitable Foundation and Arthur Arnstein Foundation; received travel grants from Guthy-Jackson Charitable Foundation; received speaker’s honoraria from Virion Serion and Novartis; was a participant in the BIH Clinical Fellow Program funded by Stiftung Charité. This project has received funding from the Innovative Medicines Initiative 2 Joint Undertaking under grant agreement No 821283. This Joint Undertaking receives support from the European Union’s Horizon 2020 research and innovation program and EFPIA companies.
References
- 1.Ashrafzadeh-Kian S, Figdore D, Larson B, Deters R, Abou-Diwan C, Bornhorst J, Algeciras-Schimnich A (2024) Head-to-head comparison of four plasma neurofilament light chain (NfL) immunoassays. Clin Chim Acta 561:119817 [DOI] [PubMed] [Google Scholar]
- 2.Bazarian JJ, Biberthaler P, Welch RD, Lewis LM, Barzo P, Bogner-Flatz V, Gunnar Brolinson P, Buki A, Chen JY, Christenson RH, Hack D, Huff JS, Johar S, Jordan JD, Leidel BA, Lindner T, Ludington E, Okonkwo DO, Ornato J, Peacock WF, Schmidt K, Tyndall JA, Vossough A, Jagoda AS (2018) Serum GFAP and UCH-L1 for prediction of absence of intracranial injuries on head CT (ALERT-TBI): a multicentre observational study. Lancet Neurol 17:782–789 [DOI] [PubMed] [Google Scholar]
- 3.Behzadi A, Pujol-Calderon F, Tjust AE, Wuolikainen A, Hoglund K, Forsberg K, Portelius E, Blennow K, Zetterberg H, Andersen PM (2021) Neurofilaments can differentiate ALS subgroups and ALS from common diagnostic mimics. Sci Rep 11:22128 [DOI] [PMC free article] [PubMed] [Google Scholar]
- 4.Beltran TA (2024) Normative values for serum neurofilament light chain in US adults. J Clin Neurol 20:46–49 [DOI] [PMC free article] [PubMed] [Google Scholar]
- 5.Benkert P, Meier S, Schaedelin S, Manouchehrinia A, Yaldizli O, Maceski A, Oechtering J, Achtnichts L, Conen D, Derfuss T, Lalive PH, Mueller C, Muller S, Naegelin Y, Oksenberg JR, Pot C, Salmen A, Willemse E, Kockum I, Blennow K, Zetterberg H, Gobbi C, Kappos L, Wiendl H, Berger K, Sormani MP, Granziera C, Piehl F, Leppert D, Kuhle J (2022) Serum neurofilament light chain for individual prognostication of disease activity in people with multiple sclerosis: a retrospective modelling and validation study. Lancet Neurol 21(1):246–257 [DOI] [PubMed] [Google Scholar]
- 6.Bokstrom-Rees E, Zetterberg H, Blennow K, Hastie R, Schell S, Cluver C, Bergman L (2023) Correlation between cognitive assessment scores and circulating cerebral biomarkers in women with pre-eclampsia and eclampsia. Pregn Hyper 31:38–45 [DOI] [PubMed] [Google Scholar]
- 7.Bolsewig K, van Unnik A, Blujdea ER, Gonzalez MC, Ashton NJ, Aarsland D, Zetterberg H, Padovani A, Bonanni L, Mollenhauer B, Schade S, Vandenberghe R, Poesen K, Kramberger MG, Paquet C, Bousiges O, Cretin B, Willemse EAJ, Teunissen CE, Lemstra AW (2024) Association of plasma amyloid, P-Tau, GFAP, and NfL with csf, clinical, and cognitive features in patients with dementia with lewy bodies. Neurology 102:e209418 [DOI] [PMC free article] [PubMed] [Google Scholar]
- 8.Britze J, Larsen MH, Pedersen AG, Rosthoj S, Bach Sondergaard H, Magyari M, Pedersen OB, Jensen BA, Ostrowski SR, Erikstrup C, Ullum H, Battistini JLF, Sellebjerg F, Modvig S (2025) Temporal dynamics of plasma neurofilament light in blood donors with preclinical multiple sclerosis. Neurol Neuroimmunol Neuroinflamm 12:e200335 [DOI] [PMC free article] [PubMed] [Google Scholar]
- 9.Brum WS, Ashton NJ, Simren J, di Molfetta G, Karikari TK, Benedet AL, Zimmer ER, Lantero-Rodriguez J, Montoliu-Gaya L, Jeromin A, Aarsand AK, Bartlett WA, Calle PF, Coskun A, Diaz-Garzon J, Jonker N, Zetterberg H, Sandberg S, Carobene A, Blennow K (2024) Biological variation estimates of Alzheimer’s disease plasma biomarkers in healthy individuals. Alzheimers Dement 20:1284–1297 [DOI] [PMC free article] [PubMed] [Google Scholar]
- 10.Burgess BL, Cho E, Honigberg L (2022) Neurofilament light as a predictive biomarker of unresolved chemotherapy-induced peripheral neuropathy in subjects receiving paclitaxel and carboplatin. Sci Rep 12:15593 [DOI] [PMC free article] [PubMed] [Google Scholar]
- 11.Butt OH, Zhou AY, Caimi PF, Luckett PH, Wisch JK, Derenoncourt PR, Lee K, Wu GF, de Lima MJG, Campian JL, Frank MJ, DiPersio JF, Ghobadi A, Ances BM (2022) Assessment of pretreatment and posttreatment evolution of neurofilament light chain levels in patients who develop immune effector cell-associated neurotoxicity syndrome. JAMA Oncol 8:1652–1657 [DOI] [PMC free article] [PubMed] [Google Scholar]
- 12.Byrne LM, Rodrigues FB, Blennow K, Durr A, Leavitt BR, Roos RAC, Scahill RI, Tabrizi SJ, Zetterberg H, Langbehn D, Wild EJ (2017) Neurofilament light protein in blood as a potential biomarker of neurodegeneration in Huntington’s disease: a retrospective cohort analysis. Lancet Neurol 16:601–609 [DOI] [PMC free article] [PubMed] [Google Scholar]
- 13.Canty AR, B.D. (2024) boot: Bootstrap R (S-Plus) Functions. R package 1.3–31
- 14.Carobene A, Maiese K, Abou-Diwan C, Locatelli M, Serteser M, Coskun A, Unsal I (2023) Biological variation estimates for serum neurofilament light chain in healthy subjects. Clin Chim Acta 551:117608 [DOI] [PubMed] [Google Scholar]
- 15.Cook D, Brown D, Alexander R, March R, Morgan P, Satterthwaite G, Pangalos MN (2014) Lessons learned from the fate of AstraZeneca’s drug pipeline: a five-dimensional framework. Nat Rev Drug Discov 13:419–431 [DOI] [PubMed] [Google Scholar]
- 16.Davison ACH (1997) Bootstrap methods and their applications. Cambridge University Press, Cambridge [Google Scholar]
- 17.Demler TL (2014) Drug-induced neurological conditions. Pharmacist 39:47–51 [Google Scholar]
- 18.Fader KA, Pardo ID, Kovi RC, Somps CJ, Wang HH, Vaidya VS, Ramaiah SK, Sirivelu MP (2022) Circulating neurofilament light chain as a promising biomarker of AAV-induced dorsal root ganglia toxicity in nonclinical toxicology species. Mol Ther Methods Clin Dev 25:264–277 [DOI] [PMC free article] [PubMed] [Google Scholar]
- 19.Gaiottino J, Norgren N, Dobson R, Topping J, Nissim A, Malaspina A, Bestwick JP, Monsch AU, Regeniter A, Lindberg RL, Kappos L, Leppert D, Petzold A, Giovannoni G, Kuhle J (2013) Increased neurofilament light chain blood levels in neurodegenerative neurological diseases. PLoS ONE 8:e75091 [DOI] [PMC free article] [PubMed] [Google Scholar]
- 20.Gendron TF, Badi MK, Heckman MG, Jansen-West KR, Vilanilam GK, Johnson PW, Burch AR, Walton RL, Ross OA, Brott TG, Miller TM, Berry JD, Nicholson KA, Wszolek ZK, Oskarsson BE, Sheth KN, Sansing LH, Falcone GJ, Cucchiara BL, Meschia JF, Petrucelli L (2020) Plasma neurofilament light predicts mortality in patients with stroke. Sci Transl Med. 10.1126/scitranslmed.abi7643 [DOI] [PMC free article] [PubMed] [Google Scholar]
- 21.Gust J, Rawlings-Rhea SD, Wilson AL, Tulberg NM, Sherman AL, Seidel KD, Wu QV, Park JR, Gardner RA, Annesley CE (2023) GFAP and NfL increase during neurotoxicity from high baseline levels in pediatric CD19-CAR T-cell patients. Blood Adv 7:1001–1010 [DOI] [PMC free article] [PubMed] [Google Scholar]
- 22.Hayes AW, Weber K, Moser P, Soares-da-Silva P (2021) Non-clinical toxicology evaluation of BIA 10–2474. Crit Rev Toxicol 51:65–75 [DOI] [PubMed] [Google Scholar]
- 23.Huang MC, Chen CH, Liu TH, Chung AN, Liu YL, Quednow BB, Bavato F (2023) Comorbidity of ketamine dependence with major depressive disorder increases the vulnerability to neuroaxonal pathology. J Psychiatr Res 158:360–364 [DOI] [PubMed] [Google Scholar]
- 24.Huehnchen P, Schinke C, Bangemann N, Dordevic AD, Kern J, Maierhof SK, Hew L, Nolte L, Kortvelyessy P, Gopfert JC, Ruprecht K, Somps CJ, Blohmer JU, Sehouli J, Endres M, Boehmerle W (2022) Neurofilament proteins as a potential biomarker in chemotherapy-induced polyneuropathy. JCI Insight. 10.1172/jci.insight.154395 [DOI] [PMC free article] [PubMed] [Google Scholar]
- 25.Johnson EW, Sutherland JJ, Meseck E, McElroy C, Chand DH, Tukov FF, Hudry E, Penraat K (2023) Neurofilament light chain and dorsal root ganglia injury after adeno-associated virus 9 gene therapy in nonhuman primates. Mol Ther Methods Clin Dev 28:208–219 [DOI] [PMC free article] [PubMed] [Google Scholar]
- 26.Jons D, Zetterberg H, Bistrom M, Alonso-Magdalena L, Gunnarsson M, Vrethem M, Blennow K, Nilsson S, Sundstrom P, Andersen O (2022) Axonal injury in asymptomatic individuals preceding onset of multiple sclerosis. Ann Clin Transl Neurol 9:882–887 [DOI] [PMC free article] [PubMed] [Google Scholar]
- 27.Kaaber IA, Lesbo M, Wichmann TO, Olsen DA, Rasmussen MM, Brink O, Borris LC, Hviid CVB (2024) Admission levels of serum biomarkers have additive and cumulative prognostic value in traumatic brain injury. Sci Rep 14:14139 [DOI] [PMC free article] [PubMed] [Google Scholar]
- 28.Kortvelyessy P, Kuhle J, Duzel E, Vielhaber S, Schmidt C, Heinius A, Leypoldt F, Schraven B, Reinhold D, Leppert D, Goihl A (2020) Ratio and index of Neurofilament light chain indicate its origin in Guillain-Barre Syndrome. Ann Clin Transl Neurol 7:2213–2220 [DOI] [PMC free article] [PubMed] [Google Scholar]
- 29.Kuhle J, Kropshofer H, Haering DA, Kundu U, Meinert R, Barro C, Dahlke F, Tomic D, Leppert D, Kappos L (2019) Blood neurofilament light chain as a biomarker of MS disease activity and treatment response. Neurology 92:e1007–e1015 [DOI] [PMC free article] [PubMed] [Google Scholar]
- 30.Liu Q, Xie F, Siedlak SL, Nunomura A, Honda K, Moreira PI, Zhua X, Smith MA, Perry G (2004) Neurofilament proteins in neurodegenerative diseases. Cell Mol Life Sci 61:3057–3075 [DOI] [PMC free article] [PubMed] [Google Scholar]
- 31.Ma X, Lu Y, Peng F, Wang Y, Sun X, Luo W, Shen S, Liu Z, Kermode AG, Qiu W, Shu Y (2022) Serum NfL associated with anti-NMDA receptor encephalitis. Neurol Sci 43:3893–3899 [DOI] [PubMed] [Google Scholar]
- 32.Martin-Aguilar L, Camps-Renom P, Lleixa C, Pascual-Goni E, Diaz-Manera J, Rojas-Garcia R, De Luna N, Gallardo E, Cortes-Vicente E, Munoz L, Alcolea D, Lleo A, Casasnovas C, Homedes C, Gutierrez-Gutierrez G, Jimeno-Montero MC, Berciano J, Sedano-Tous MJ, Garcia-Sobrino T, Pardo-Fernandez J, Marquez-Infante C, Rojas-Marcos I, Jerico-Pascual I, Martinez-Hernandez E, Moris de la Tassa G, Dominguez-Gonzalez C, Illa I, Querol L (2020) Serum neurofilament light chain predicts long-term prognosis in Guillain-Barre syndrome patients. J Neurol Neurosurg Psychiatr. 10.1136/jnnp-2020-323899 [DOI] [PubMed] [Google Scholar]
- 33.Mattsson N, Cullen NC, Andreasson U, Zetterberg H, Blennow K (2019) Association between longitudinal plasma neurofilament light and neurodegeneration in patients with alzheimer disease. JAMA Neurol 76:791–799 [DOI] [PMC free article] [PubMed] [Google Scholar]
- 34.Mortensen C, Steffensen KD, Simonsen E, Herskind K, Madsen JS, Olsen DA, Iversen DB, Bergmann TK, Pottegard A, Stage TB (2023) Neurofilament light chain as a biomarker of axonal damage in sensory neurons and paclitaxel-induced peripheral neuropathy in patients with ovarian cancer. Pain 164:1502–1511 [DOI] [PubMed] [Google Scholar]
- 35.Mullard A (2023) NfL makes regulatory debut as neurodegenerative disease biomarker. Nat Rev Drug Discov 22:431–434 [DOI] [PubMed] [Google Scholar]
- 36.Onakpoya IJ, Heneghan CJ, Aronson JK (2016) Post-marketing withdrawal of 462 medicinal products because of adverse drug reactions: a systematic review of the world literature. BMC Med 14:10 [DOI] [PMC free article] [PubMed] [Google Scholar]
- 37.Parkin GM, Thomas EA, Corey-Bloom J (2024) Mapping neurodegeneration across the Huntington’s disease spectrum: a five-year longitudinal analysis of plasma neurofilament light. EBioMedicine 104:105173 [DOI] [PMC free article] [PubMed] [Google Scholar]
- 38.Pratt J, De Vito G, Segurado R, Pessanha L, Dolan J, Narici M, Boreham C (2022) Plasma neurofilament light levels associate with muscle mass and strength in middle-aged and older adults: findings from GenoFit. J Cachexia Sarcopenia Muscle 13:1811–1820 [DOI] [PMC free article] [PubMed] [Google Scholar]
- 39.Redfern WS, Ewart L, Hammond TG, Bialecki R, Kinter L, Lindgren S, Pollard CE, Roberts R, Rolf MG, Valentin JP (2010) Impact and frequency of different toxicities throughout the pharmaceutical life cycle. In: 49th Annual Meeting of the Society of Toxicology. The Toxicologist -Supplement to Toxicological Sciences, Salt Lake City, UT, p 231
- 40.Rodero-Romero A, Monreal E, Sainz-Amo R, Garcia Dominguez JM, Villarrubia N, Veiga-Gonzalez JL, Fernandez-Velasco JI, Goicochea-Briceno H, Rodriguez-Jorge F, Sainz de la Maza S, Chico-Garcia JL, Muriel A, Masjuan J, Costa-Frossard L, Villar LM (2024) Establishing normal serum values of neurofilament light chains and glial fibrillary acidic protein considering the effects of age and other demographic factors in healthy adults. Int J Mol Sci. 10.3390/ijms25147808 [DOI] [PMC free article] [PubMed] [Google Scholar]
- 41.Ru Y, Corado C, Soon RK Jr, Melton AC, Harris A, Yu GK, Pryer N, Sinclair JR, Katz ML, Ajayi T, Jacoby D, Russell CB, Chandriani S (2019) Neurofilament light is a treatment-responsive biomarker in CLN2 disease. Ann Clin Transl Neurol 6:2437–2447 [DOI] [PMC free article] [PubMed] [Google Scholar]
- 42.Schraen-Maschke S, Sergeant N, Dhaenens CM, Bombois S, Deramecourt V, Caillet-Boudin ML, Pasquier F, Maurage CA, Sablonniere B, Vanmechelen E, Buee L (2008) Tau as a biomarker of neurodegenerative diseases. Biomark Med 2:363–384 [DOI] [PMC free article] [PubMed] [Google Scholar]
- 43.Shahim P, Politis A, van der Merwe A, Moore B, Chou YY, Pham DL, Butman JA, Diaz-Arrastia R, Gill JM, Brody DL, Zetterberg H, Blennow K, Chan L (2020) Neurofilament light as a biomarker in traumatic brain injury. Neurology 95:e610–e622 [DOI] [PMC free article] [PubMed] [Google Scholar]
- 44.Shahim P, Zetterberg H, Tegner Y, Blennow K (2017) Serum neurofilament light as a biomarker for mild traumatic brain injury in contact sports. Neurology 88:1788–1794 [DOI] [PMC free article] [PubMed] [Google Scholar]
- 45.Simren J, Andreasson U, Gobom J, Suarez Calvet M, Borroni B, Gillberg C, Nyberg L, Ghidoni R, Fernell E, Johnson M, Depypere H, Hansson C, Jonsdottir IH, Zetterberg H, Blennow K (2022) Establishment of reference values for plasma neurofilament light based on healthy individuals aged 5–90 years. Brain Commun. 10.1093/braincomms/fcac174 [DOI] [PMC free article] [PubMed] [Google Scholar]
- 46.Smith EN, Lee J, Prilutsky D, Zicha S, Wang Z, Han S, Zach N (2024) Plasma neurofilament light levels show elevation two years prior to diagnosis of amyotrophic lateral sclerosis in the UK Biobank. Amyotroph Lateral Scler Frontotemporal Degener 25:170–176 [DOI] [PubMed] [Google Scholar]
- 47.Takala RS, Posti JP, Runtti H, Newcombe VF, Outtrim J, Katila AJ, Frantzen J, Ala-Seppala H, Kyllonen A, Maanpaa HR, Tallus J, Hossain MI, Coles JP, Hutchinson P, van Gils M, Menon DK, Tenovuo O (2016) Glial fibrillary acidic protein and ubiquitin C-terminal hydrolase-L1 as outcome predictors in traumatic brain injury. World Neurosurg 87:8–20 [DOI] [PubMed] [Google Scholar]
- 48.Tezenas du Montcel S, Petit E, Olubajo T, Faber J, Lallemant-Dudek P, Bushara K, Perlman S, Subramony SH, Morgan D, Jackman B, Paulson HL, Oz G, Klockgether T, Durr A, Ashizawa T, Collaborators RC (2023) Baseline clinical and blood biomarkers in patients with preataxic and early-stage disease spinocerebellar ataxia 1 and 3. Neurology 100:e1836–e1848 [DOI] [PMC free article] [PubMed] [Google Scholar]
- 49.Tyszkiewicz C, Hwang SK, DaSilva JK, Kovi RC, Fader KA, Sirivelu MP, Liu J, Somps C, Cook J, Liu CN, Wang H (2024) Absence of functional deficits in rats following systemic administration of an AAV9 vector despite moderate peripheral nerve and dorsal root ganglia findings: A clinically silent peripheral neuropathy. Neurotoxicology 101:46–53 [DOI] [PubMed] [Google Scholar]
- 50.Vermunt L, Otte M, Verberk IMW, Killestein J, Lemstra AW, van der Flier WM, Pijnenburg YAL, Vijverberg EGB, Bouwman FH, Gravesteijn G, van de Berg WDJ, Scheltens P, van Harten AC, Willemse EAJ, Teunissen CE (2022) Age- and disease-specific reference values for neurofilament light presented in an online interactive support interface. Ann Clin Transl Neurol 9:1832–1837 [DOI] [PMC free article] [PubMed] [Google Scholar]
- 51.Vlasakova K, Tsuchiya T, Garfinkel IN, Ruth MP, Tyskiewicz C, Detwiler TJ, Somps CJ, Mannelli LD, Glaab WE (2024) Performance of biomarkers NF-L NSE Tau and GFAP in blood and cerebrospinal fluid in rat for the detection of nervous system injury. Front Neurosci. 10.3389/fnins.2023.1285359 [DOI] [PMC free article] [PubMed] [Google Scholar]
- 52.von Schaper E (2016) Bial incident raises FAAH suspicions. Nat Biotechnol 34:223 [DOI] [PubMed] [Google Scholar]
- 53.Voysey ZJ, Owen NE, Holbrook JA, Malpetti M, Le Draoulec C, Spindler LRB, Goodman AOG, Lazar AS, Barker RA (2024) A 14-year longitudinal study of neurofilament light chain dynamics in premanifest and transitional Huntington’s disease. J Neurol 271:7572–7582 [DOI] [PMC free article] [PubMed] [Google Scholar]
- 54.Walker AL, Imam SZ, Roberts RA (2018) Drug discovery and development: Biomarkers of neurotoxicity and neurodegeneration. Exp Biol Med (Maywood) 243:1037–1045 [DOI] [PMC free article] [PubMed] [Google Scholar]
- 55.Weishaupt JH, Kortvelyessy P, Schumann P, Valkadinov I, Weyen U, Hesebeck-Brinckmann J, Weishaupt K, Endres M, Andersen PM, Regensburger M, Dreger M, Koch JC, Conrad J, Meyer T (2024) Tofersen decreases neurofilament levels supporting the pathogenesis of the SOD1 p.D91A variant in amyotrophic lateral sclerosis patients. Commun Med. 10.1038/s43856-024-00573-0 [DOI] [PMC free article] [PubMed] [Google Scholar]
- 56.Welford RWD, Farine H, Steiner M, Garzotti M, Dobrenis K, Sievers C, Strasser DS, Amraoui Y, Groenen PMA, Giugliani R, Mengel E (2022) Plasma neurofilament light, glial fibrillary acidic protein and lysosphingolipid biomarkers for pharmacodynamics and disease monitoring of GM2 and GM1 gangliosidoses patients. Mol Genet Metab Rep 30:100843 [DOI] [PMC free article] [PubMed] [Google Scholar]
- 57.Wilke C, Haas E, Reetz K, Faber J, Garcia-Moreno H, Santana MM, van de Warrenburg B, Hengel H, Lima M, Filla A, Durr A, Melegh B, Masciullo M, Infante J, Giunti P, Neumann M, de Vries J, Pereira de Almeida L, Rakowicz M, Jacobi H, Schule R, Kaeser SA, Kuhle J, Klockgether T, Schols L, Barro C, Hubener-Schmid J, Synofzik M (2020) Neurofilaments in spinocerebellar ataxia type 3: blood biomarkers at the preataxic and ataxic stage in humans and mice. EMBO Mol Med. 10.15252/emmm.201911803 [DOI] [PMC free article] [PubMed] [Google Scholar]
- 58.Wilke C, Mengel D, Schols L, Hengel H, Rakowicz M, Klockgether T, Durr A, Filla A, Melegh B, Schule R, Reetz K, Jacobi H, Synofzik M (2022) Levels of neurofilament light at the preataxic and ataxic stages of spinocerebellar ataxia type 1. Neurology 98:e1985–e1996 [DOI] [PMC free article] [PubMed] [Google Scholar]
- 59.Ziaei A, Nasr Z, Hart J, Francisco C, Rutatangwa A, Leppert D, Kuhle J, Flanagan E, Waubant E (2023) High serum neurofilament levels are observed close to disease activity events in pediatric-onset MS and MOG antibody-associated diseases. Mult Scler Relat Disord 74:104704 [DOI] [PubMed] [Google Scholar]
Associated Data
This section collects any data citations, data availability statements, or supplementary materials included in this article.