Abstract
Electrotonic coupling synchronizes the spontaneous firing of locus ceruleus (LC) neurons in the neonatal rat brain, whereas in adults, synchronous activity is rare. This report examines the role of action potential frequency on synchronous activity in the adult LC. Decreasing the firing frequency in slices from adult animals facilitated the appearance of subthreshold oscillations and increased the correlation of the membrane potential between pairs of neurons. Conversely, increasing the firing frequency decreased the amplitude and synchrony of the oscillations among pairs. The frequency-dependent synchrony was not observed in slices from neonatal rats, where synchrony was observed at all frequencies, suggesting a developmental change in the properties of the LC network. A mathematical model confirmed that a reduction of the coupling strength among a pair of coupled neurons could generate frequency-dependent synchrony. In slices from adult animals, the combination of electrotonic coupling and firing frequency are the key elements that regulate synchronous firing in this nucleus.
Keywords: mathematical model
Gap junctions between neurons are thought to facilitate organized local network activity in many areas of the central nervous system (1–6). In the locus ceruleus (LC) of neonatal animals the coupling between individual neurons is weak but any individual neuron is coupled with many others. A network with these characteristics can theoretically display a wide range of phase-locked activity, including synchronous firing. Indeed, neonatal LC neurons display synchronous firing and rhythmic subthreshold oscillations of membrane potential (7–10).
Electrotonic coupling has traditionally been thought to synchronize spontaneously active neurons. However, computational modeling indicates that in weakly coupled networks, electrotonic coupling can be synchronizing or desynchronizing depending on the frequency of the network in comparison to the amplitude and shape of the action potentials (11, 12). For a fixed action potential shape, coupled neurons will transition between a variety of different phase-locked states as the frequency of firing is changed. Synchrony is generally lost if the frequency becomes too high. Thus the strength of the coupling as well as the frequency of firing can modulate synchrony.
The present investigation examined the degree of synchronized activity between pairs of LC neurons subjected to alterations in firing rate in adult and neonatal brain slices. It was found that the firing frequency controlled the synchrony of the network in adult animals. A simple mathematical model of two coupled spontaneously spiking neurons predicted that when coupling is weak, both synchronous and asynchronous states exist, depending on the frequency of the network. These data and model suggest that partial inhibition of the firing of LC neurons would foster synchronous activity in the nucleus and lead to coordinated activation of widespread areas in the central nervous system.
Materials and Methods
Electrophysiology.
Horizontal slices (225–250 μm) containing the LC were prepared from neonatal (4–10 days) or adult (6–8 weeks) male Sprague–Dawley rats (Charles River) as previously described (13). Whole-cell recordings were made with Nomarski optics and infrared illumination. Simultaneous recordings were made from LC cells separated by 50–300 μm. Extracellular solution contained (in mM): 126 NaCl, 2.5 KCl, 2.4 CaCl2, 1.2 MgCl2, 1.2 NaH2PO4, 21.4 NaHCO3, and 11.1 glucose, equilibrated with 95% O2/5% CO2 at 35°C. Pipettes (2–3 MΩ) were filled with internal solution containing (in mM): 115 Mes [2-(morpholino)ethanesulfonic acid] potassium salt, 20 KCl, 1.5 MgCl2, 1 BAPTA [1,2-bis(2-aminophenoxy)ethane-N,N,N′,N′-tetraacetic acid], 5 Hepes, 4 MgATP, and 0.4 NaGTP, pH = 7.3. Paired recordings of membrane potential were acquired and analyzed with Axograph (Axon Instruments). Statistical difference was determined by unpaired t test unless otherwise specified, and the two-tailed P values are presented in the text or figure legends. Statistical analysis and curve fits were performed with prism (GraphPad Software, San Diego).
Mathematical Model.
For numerical simulations, a pair of coupled two-compartment neurons were constructed (a soma compartment and a dendritic compartment). The gap junctions were placed between the dendrites because previous work suggests dendritic localization (10, 13). The membrane kinetics were adapted from a standard cortical neuron model (14). The reversal potential for potassium in these cells was obtained from experimental data (15). Spontaneous firing was generated by the addition of a persistent sodium current, experimentally described to exist in LC neurons (15). Sodium currents were adjusted so that the action potential shape would match these experimental data.
The membrane potential for the soma and dendrite obeyed the current balance equations:
 |
1 |
 |
 |
2 |
 |
where i is the neuron index (1 or 2), g is the gap junction conductance between dendrites, gd is the effective conductance between dendrite and soma, I is an applied current, INa = gNam3h(V − VNa), and IK = gKn4 (V − VK) are the spike-generating currents, IL = gL (V − VL) is the leak current, IP = gPp2(V − VNa) is a slow persistent sodium current, IAHP = gAHP([Ca]/([Ca] + 1))(V − VK) is an afterhyperpolarization current, ICa = gCam (V)2y (V − VCa) is a calcium current, and η(t) is a zero mean white noise with amplitude of 0.015 to emulate stochastic influences.
The model used the following parameters: C = 1, gNa = 50, gK = 5, gL = 0.1, gLd = 0.01, gP = 0.06, gAHP = 0.2, gCa = 0.25, gd = 0.3, VNa = 40, VK = −110, VL = −65, VLD = −67, and VCa = 120. Potential is in mV, current is in μA/cm2, time is in ms, capacitance is in μF/cm2, and conductance is in mS/cm2. The activation variable m was assumed fast and replaced by its asymptotic value m = m∞(V) = αm(V)/(αm(V) + βm(V)), where αm(V) = 0.1(V + 25)/(1 − exp(−0.1(V + 25))) and βm(V) = 4.0 exp(−(V + 50)/18). The gating variables h, n, p, and y obey kinetics of the form:
 |
3 |
 |
4 |
 |
5 |
with αn(V) = 0.01(V + 34)/(1 − exp(−0.2 (V + 34))), βn(V) = 0.125 exp(−(V + 40)/80), αh(V) = 0.07 exp(−(V + 40)/20), βh(V) = 1/(1 + exp(−0.1(V + 14))), αp(V) = 0.0001(V + 30)/(1 − exp(−0.05(V + 40))), and βp(V) = 0.004 exp(−(V + 60)/18).
Additionally, m = 1/(1 + exp(−(V + 55)/9)),
 |
6 |
 |
 |
7 |
where kCa = 2, y∞(V) = 1/(1 + exp(V + 77)/5), and τy(V) = 20 + 100/(1 + exp((V + 76)/3)).
The frequency was modified by changing the applied current I. From high to low frequency cases we used I = 0.18, 0.05, −0.5. A small amount of heterogeneity was included by adding 0.002 to the applied current of one of the neurons. In the case of strong gap junctional coupling g = 0.08 and in the weak case g = 0.025. Based on a single gap junction channel conductance of 150 pS and average dendritic surface of ≈2,000 μm2, the modeled cells have 3 and 10 gap junctions at the dendrites in the case of weak and strong coupling, respectively. Thus, the conductance values used in the model are within the range estimated by dye and current transfer experiments in the LC (9, 10). The ordinary differential equations were integrated by using a stochastic Euler method with the program xppaut written by G. B. Ermentrout and obtainable from http://www.pitt.edu/∼phase/.
Results and Discussion
Oscillations in Neurons from Adults.
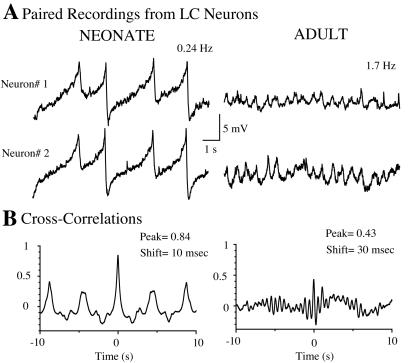
Paired recordings of LC neurons were performed in slices from adult and neonatal rats. A constant negative current was injected to prevent spontaneous firing and enable the detection of oscillations in membrane potential. Thus, action potentials were inhibited only in the recorded neurons and activity in the rest of LC was presumed to be normal. Spontaneous oscillations were observed in 55% of the pairs of neurons (17 of 31 pairs) from adults and in 10 of 11 pairs in slices from neonatal animals (Fig. 1A). Oscillations varied from 5 to 12 mV in neonates and were 3 to 6 mV in adults. The average frequency of oscillations calculated by power spectrum analysis was 0.35 ± 0.08 Hz (n = 20) in neonates and 1.48 ± 0.14 Hz (n = 34) in adults.
Figure 1.
Subthreshold oscillations are present in LC neurons from neonatal and adult rat brain slices. (A) Representative paired recordings of membrane potential from LC neurons in slices from a neonate (left) and an adult (right) rat brain. The frequency of the oscillations in this example was 0.24 Hz in the neonate and 1.7 Hz in the adult. (B) Cross-correlogram plots of the membrane potential recordings in neurons 1 and 2 for each pair of traces.
Cross-correlation analysis was used to compare the degree of synchrony between cells from neonatal and adult animals (Fig. 1B). With a maximum theoretical value of 1, the peak of the cross-correlogram quantifies how accurately a change in membrane potential recorded in one cell is followed by the other. The time to peak determines the phase shift of the correlation. The average peak value for correlograms in neonates was 0.7 ± 0.04 and the average phase shift was 18.8 ± 6.7 ms (n = 10). In adults, no peaks were detected in the correlograms from pairs of neurons without subthreshold oscillations (n = 14). In paired neurons that displayed oscillations, the average peak of the correlograms was 0.54 ± 0.05 and the phase shift 11 ± 3 ms (n = 17). The phase shift values in the tens of milliseconds represent robust synchrony for neurons that fire at slow frequencies (0.3–1.5 Hz). However, the reduced amplitude of the correlogram peaks observed in pairs from adult slices revealed a reduced degree of synchronized activity under normal conditions.
Despite the differences, oscillations in neurons from adults and neonates shared several characteristics. First, the oscillations in adult slices were not induced synaptically (7, 13). A mixture of receptor antagonists [2,3-dioxo-6-nitro-1,2,3,4-tetrahydrobenzo[f]quinoxaline-7-sulfonamide (NBQX), 5 μM; MK801, 10 μM; picrotoxin, 100 μM, n = 3] did not affect the frequency or amplitude of the oscillations. Second, the oscillations in adults were blocked by [Met5]enkephalin (10 μM), which abolished spontaneous firing, implying that the oscillatory behavior depends on the spontaneous activity of the whole network (n = 5, not shown). Third, the gap junction blocker carbenoxolone disrupted oscillations in adult preparations, suggesting the involvement of electrotonic coupling (100 μM, n = 3, not shown).
Oscillations as Predictors of Synchronized Action Potentials.
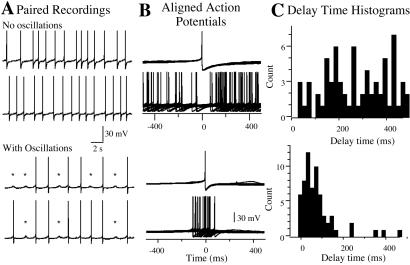
The role of subthreshold oscillations on the synchrony of action potentials was examined next. Spontaneous firing was recorded in 13 pairs of neurons from adult slices (no hyperpolarizing current was injected in these experiments). Action potentials in one neuron were aligned with traces from the second and the time between action potential peaks (Δt) was measured.
Delay histograms were constructed to determine the distribution and mean time difference in action potentials among paired recordings. A Gaussian distribution with a mean Δt = 61 ± 20 ms was observed in all of the pairs of neurons that displayed subthreshold oscillations in membrane potential (8 of 13 pairs, Fig. 2). Conversely, in recordings from neurons without oscillations, a non-Gaussian distribution and a significantly increased Δt (506 ± 74 ms, n = 5, P = 0.0045) were found (Fig. 2). These data show a correlation between the presence of oscillations and synchronous action potentials.
Figure 2.
Synchronous action potentials are found in pairs of neurons having oscillations. (A) Paired recordings from neurons without (upper two traces) and with (lower two traces) subthreshold oscillations. Note subthreshold oscillation marked by *. (B) The action potentials in one neuron were aligned to the trace from the other cell. Action potentials in neuron 1 were set to time 0 and the time to the peak of action potential in neuron 2 (Δt) was determined. (C) Frequency histogram of Δt for each pair. The mean Δt for each histogram was calculated from the cumulative frequency plot obtained by integrating the frequency histogram. Note the different distribution.
It is proposed that the combination of spontaneous activity of LC neurons and electrotonic coupling creates the underlying oscillations in membrane potential. The depolarizing component of the oscillation is generated when several action potentials happen simultaneously in coupled cells of the network. The greater the number of cells that fire, the greater the amplitude of the oscillation. Thus, the rising phase of the oscillation is related to the probability distribution of action potentials in time.
Firing Frequency Regulates Synchrony in the Adult Network.
Electrotonic coupling might underlie synchronous firing and oscillatory behavior in adult rats, similar to what has been shown in neonatal rats. However, the degree of synchronous activity differs with age. The role of the firing frequency in synchronous activity was examined by experimentally changing the firing frequency of neurons in the entire nucleus by applying receptor agonists, ion channel blockers, and modulators to the bath solution. Tetrodotoxin (TTX, 1 μM), [Met5]enkephalin (30–100 nM), and cocaine (1 μM) reduced, whereas muscarine (10 μM), aspartate (100 μM), 4-aminopyridine (500 μM), and phenylephrine (10 μM) increased excitability.
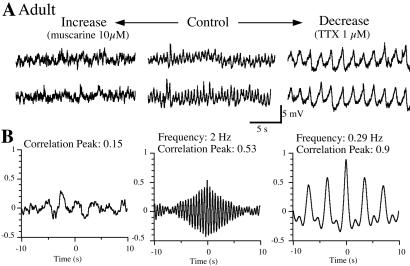
In TTX, spontaneous calcium spikes persisted (15). In 11 of 21 pairs that displayed oscillations, application of TTX (1 μM) reduced the firing frequency by 58% ± 4.5%, augmented the amplitude of the oscillations, and increased the amplitude of the cross-correlogram peak from 0.54 ± 0.05 to 0.86 ± 0.02 (P < 0.001, Fig. 3). No change was observed in the time to peak (phase shift = 25 ± 9 ms). In pairs of neurons that did not initially display spontaneous oscillations, TTX induced oscillatory behavior in 6 of 10 experiments, and the correlation coefficient was higher than 0.5 in each pair after TTX.
Figure 3.
Frequency controls oscillatory behavior in LC from adult animals. (A) Recordings from a pair of neurons in a slice from an adult in control (spontaneous frequency, middle traces) and when the excitability was increased (traces on left, muscarine at 10 μM) or decreased (traces on right, TTX at 1 μM). (B) Cross-correlogram of the recordings under these experimental conditions. Note the dramatic changes in rhythm and synchrony.
Application of low concentrations of cocaine (1 μM), a catecholamine reuptake inhibitor, or [Met5]enkephalin (30–100 nM), a μ-opioid receptor agonist, reduced the oscillation frequency by 47% ± 7% and increased the correlogram peaks from 0.53 ± 0.08 to 0.76 ± 0.05 (P = 0.022, n = 9 pairs). At higher concentrations these drugs hyperpolarized LC neurons and blocked spontaneous firing, thus abolishing the oscillations in membrane potential. Agents that increased the firing rate (muscarine, aspartate, 4-aminopyridine, or phenylephrine) increased oscillation frequency by 141% ± 48%, decreased the amplitude, and decreased the cross-correlation from 0.73 ± 0.06 to 0.41 ± 0.07 (P = 0.003, n = 9 pairs, Fig. 3). In slices where neurons did not have oscillations so that the correlation between paired recordings was already low, the application of these drugs did not improve the correlation.
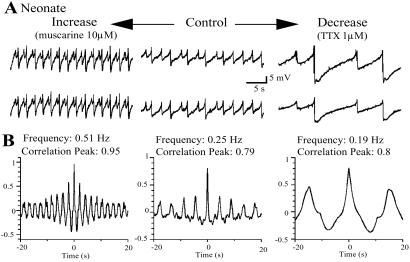
When the same experiment was done in paired recordings from slices taken from neonatal rats, the modulators were equally effective in changing the firing frequency but did not affect the synchrony (n = 10 pairs, Fig. 4). Muscarine (10 μM), aspartate (100 μM), 4-aminopyridine (500 μM), or phenylephrine (10 μM) increased the oscillation frequency by 350% ± 77% but did not significantly change the correlograms (mean peak amplitude in control: 0.69 ± 0.06, mean amplitude after drug application: 0.81 ± 0.07, P = 0.2, n = 8 pairs).
Figure 4.
Oscillations are independent of the firing frequency in neonatal animals. (A) Paired recordings from LC neurons in a brain slice from a neonatal rat in control spontaneous frequency (middle traces) and when the excitability was increased by muscarine application (10 μM, traces on left) and decreased by TTX (traces on right, 1 μM). (B) Cross-correlogram of the recordings under these experimental conditions showed no changes in rhythm and synchrony.
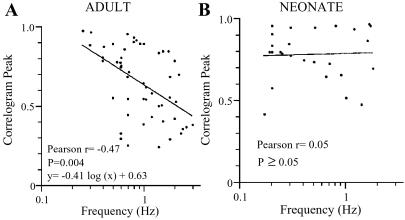
A significant correlation was found between the oscillation frequency and the correlogram peaks for paired recordings in slices from adult animals (Pearson r = −0.47, n = 52, Fig. 5A). However, no such correlation was observed in paired recordings from neonatal brain slices (n = 26, Fig. 5B). Thus, even though the increase or decrease in frequency of spontaneous spikes in single LC neurons was similar in neonates and adults, the network behavior was very different. The different behavior suggests that the excitability of LC neurons has a strong influence on the presence or absence of oscillatory behavior and synchrony in adults and suggests that the network has changed during development.
Figure 5.
Correlation between frequency and synchrony in adult LC. (A) In slices from adults, the frequency of the subthreshold oscillations correlates with the degree of synchrony (Pearson r = −0.47, P = 0.004). Pooled data from 31 pairs (n = 52) are plotted and the logarithmic equation y = −0.41⋅log(x) + 0.63 fits the data. (B) In neonatal slices, data from 13 pairs (n = 6) were pooled and no correlation was found (Pearson r = 0.05, P ≥ 0.05). The logarithmic equation y = 0.02⋅log(x) + 0.79 fits the data.
A change in electrotonic coupling caused by the pharmacological agents could be an alternative mechanism by which the network activity is affected. Given the number and variety of compounds used to change the firing rate, it seems unlikely that all of them would have secondary effects on coupling strength. Furthermore, while these compounds changed firing frequency in slices from both neonates and adults, synchrony was altered only in slices from adults. This observation implies that any effect on the strength of coupling would be age specific. One agent thought to increase electrotonic coupling in the LC is forskolin, an activator of adenylyl cyclase (16). Opioids, such as [Met5]enkephalin, are known to inhibit adenylyl cyclase. Therefore [Met5]enkephalin would be expected to have the opposite effect on electrotonic coupling and reduce synchrony rather than increase it. Taken together, these results suggest that it is improbable that changes in coupling strength generated by the drug applications used in the present study could account for the phenomena described in this study.
Modeling the Effects of Coupling in the Adult LC.
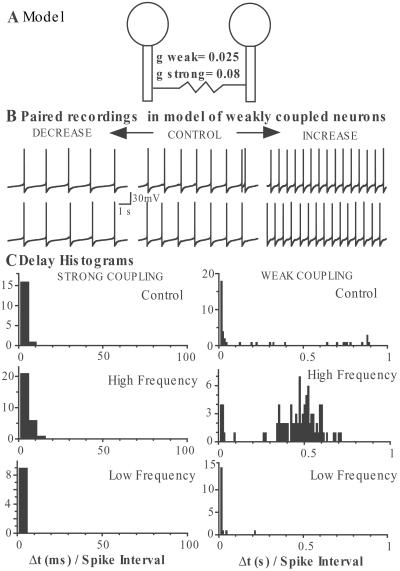
A simple mathematical model of a pair of neurons demonstrated that the amount of synchrony between coupled neurons can depend on firing frequency. Fig. 6 shows the results of two spontaneously firing neurons that were coupled with a gap junction conductance of g located in the dendritic compartment. When the coupling was strong, the two neurons synchronized at all frequencies tested but when the coupling was weak, synchrony was frequency dependent. Because this network consists of only two neurons, the neurons tend to go into anti-synchrony when synchrony is lost and the transition region occurs over a narrow range of coupling strengths (11). In a larger network, we expect that asynchronous firing will occur when synchrony is lost and that richer dynamic behavior will emerge.
Figure 6.
Frequency-dependent synchrony in a model of weakly coupled neurons. (A) Schematic diagram of the mathematical model using two two-compartment neurons electrically coupled by gap junctions between dendrites (see Materials and Methods). In the case of strong coupling, g (coupling conductance) was 0.08, and in the weak coupling model it was 0.025. (B) Paired recordings from the model with weak coupling when firing frequency is 0.9 Hz (control), 1.5 Hz (increase), and 0.6 Hz (decrease). (C) Delay histograms of spontaneous action potentials between the modeled neurons when firing frequency was 0.9 Hz (Top), 1.5 Hz (Middle), and 0.6 Hz (Bottom) and coupling conductance was strong (0.08, Left) or weak (0.025, Right). Δt values from the modeled data were obtained in the same way as the experimental Δt and expressed relative to the interspike interval (1/frequency).
For this model to qualitatively reproduce the experimental behavior of the LC neurons, it was necessary for the gap junctions to be located in the dendrites. The somatic action potentials were then significantly filtered and broadened when they reached the site of electrotonic coupling. The observation that synchrony is lost for increased frequency when action potentials are broad is in agreement with conclusions from previous work by Chow and Kopell (11).
The model predicts three ways in which synchrony could become frequency dependent during development: (i) if gap junction strength decreases, (ii) if the gap junction migrates to a more distal portion of the dendrite, and (iii) if the electrotonic length of the dendritic membrane decreases. The intrinsic membrane properties of the neurons may also have important effects on the behavior of the coupled network. Developmental changes in the membrane properties of LC neurons have been observed. These include a decrease in the action potential duration (from 1.90 ± 0.04 ms in neonates to 1.40 ± 0.06 ms in adults) and an increase in the amplitude (from 71.7 ± 1.1 mV in neonates to 81.5 ± 2.5 mV in adults; refs. 7 and 15). Both TTX and 4-aminopyridine changed the shape of the action potential, whereas the rest of the pharmacological substances tested in this study did not change the action potential. TTX reduced the amplitude and slowed the rising phase of action potentials, and 4-aminopyridine increased both the amplitude and duration. These factors could play an additional role in the generation of synchrony in adults. Thus in addition to changes in coupling strength, maturation of the membrane properties of individual neurons may have a strong impact on the global behavior of the network.
In vivo recordings from awake behaving monkeys have demonstrated that synchronized firing in the LC is correlated with good performance in a visual discrimination task (17). During these periods, the spontaneous firing was decreased and the cross correlation between neurons was greater. Usher et al. (17) attributed the observed reduction in tonic firing rate to increased coupling during the time of improved performance. The results of the present study suggest that the reduction in tonic firing frequency could be another mechanism that would promote synchrony of the LC impulse activity. However, the present study does not address the mechanisms by which LC neurons exhibit increased evoked responses to excitatory input during epochs of decreased tonic impulse activity. This study does reveal that the excitability of LC neurons is an important factor that controls synchrony in the nucleus.
Acknowledgments
We thank Drs. Nancy Kopell, Hitoshi Morikawa, Maria Torrecilla, and Mark Connor for helpful comments on the manuscript. This work was supported by National Science Foundation Grant 9810524.
Abbreviations
- LC
locus ceruleus
- TTX
tetrodotoxin
References
- 1.Llinás R, Sasaki K. Eur J Neurosci. 1989;1:587–602. doi: 10.1111/j.1460-9568.1989.tb00365.x. [DOI] [PubMed] [Google Scholar]
- 2.Beierlein M, Gibson J R, Connors B W. Nat Neurosci. 2000;3:904–910. doi: 10.1038/78809. [DOI] [PubMed] [Google Scholar]
- 3.Galarreta M, Hestrin S. Nat Rev Neurosci. 2001;2:425–433. doi: 10.1038/35077566. [DOI] [PubMed] [Google Scholar]
- 4.Perez Velazquez J L, Carlen P L. Trends Neurosci. 2000;23:68–74. doi: 10.1016/s0166-2236(99)01497-6. [DOI] [PubMed] [Google Scholar]
- 5.Lang E J. J Neurosci. 2001;21:1663–1675. doi: 10.1523/JNEUROSCI.21-05-01663.2001. [DOI] [PMC free article] [PubMed] [Google Scholar]
- 6.Deans M R, Gibson J R, Sellitto C, Connors B W, Paul D L. Neuron. 2001;31:477–485. doi: 10.1016/s0896-6273(01)00373-7. [DOI] [PubMed] [Google Scholar]
- 7.Williams J T, Marshall K C. J Neurosci. 1987;7:3687–3694. doi: 10.1523/JNEUROSCI.07-11-03687.1987. [DOI] [PMC free article] [PubMed] [Google Scholar]
- 8.Christie M J, Williams J T, North R A. J Neurosci. 1989;9:3584–3589. doi: 10.1523/JNEUROSCI.09-10-03584.1989. [DOI] [PMC free article] [PubMed] [Google Scholar]
- 9.Christie M J, Jelinek H F. Neurosci. 1993;56:129–137. doi: 10.1016/0306-4522(93)90568-z. [DOI] [PubMed] [Google Scholar]
- 10.Alvarez-Maubecin V, Garcia-Hernandez F, Williams J T, Van Bockstaele E J. J Neurosci. 2000;20:4091–4098. doi: 10.1523/JNEUROSCI.20-11-04091.2000. [DOI] [PMC free article] [PubMed] [Google Scholar]
- 11.Chow C C, Kopell N. Neural Comput. 2000;12:1643–1678. doi: 10.1162/089976600300015295. [DOI] [PubMed] [Google Scholar]
- 12.Sherman A, Rinzel J. Proc Natl Acad Sci USA. 1992;89:2471–2474. doi: 10.1073/pnas.89.6.2471. [DOI] [PMC free article] [PubMed] [Google Scholar]
- 13.Ishimatsu M, Williams J T. J Neurosci. 1996;16:5196–5204. doi: 10.1523/JNEUROSCI.16-16-05196.1996. [DOI] [PMC free article] [PubMed] [Google Scholar]
- 14.Gutkin B S, Laing C R, Colby C L, Chow C C, Ermentrout G B. J Comput Neurosci. 2001;11:121–134. doi: 10.1023/a:1012837415096. [DOI] [PubMed] [Google Scholar]
- 15.Williams T T, North R A, Shefner S A, Nishi S, Egan T M. Neuroscience. 1984;13:137–156. doi: 10.1016/0306-4522(84)90265-3. [DOI] [PubMed] [Google Scholar]
- 16.Osborne P B, Williams J T. J Neurophysiol. 1996;76:1559–1565. doi: 10.1152/jn.1996.76.3.1559. [DOI] [PubMed] [Google Scholar]
- 17.Usher M, Cohen J D, Servan-Schreiber D, Rajkowski J, Aston-Jones G. Science. 1999;283:549–554. doi: 10.1126/science.283.5401.549. [DOI] [PubMed] [Google Scholar]


