

Abstract
Environmental stimuli such as UV, pathogen attack, and gravity can induce rapid changes in hydrogen peroxide (H2O2) levels, leading to a variety of physiological responses in plants. Catalase, which is involved in the degradation of H2O2 into water and oxygen, is the major H2O2-scavenging enzyme in all aerobic organisms. A close interaction exists between intracellular H2O2 and cytosolic calcium in response to biotic and abiotic stresses. Studies indicate that an increase in cytosolic calcium boosts the generation of H2O2. Here we report that calmodulin (CaM), a ubiquitous calcium-binding protein, binds to and activates some plant catalases in the presence of calcium, but calcium/CaM does not have any effect on bacterial, fungal, bovine, or human catalase. These results document that calcium/CaM can down-regulate H2O2 levels in plants by stimulating the catalytic activity of plant catalase. Furthermore, these results provide evidence indicating that calcium has dual functions in regulating H2O2 homeostasis, which in turn influences redox signaling in response to environmental signals in plants.
The absence of motility in higher plants has resulted in the acquisition of elaborate survival mechanisms to respond and adjust to a changing environment. The molecular and biochemical aspects of how plants perceive and respond to environmental signals are not clearly understood. Recent investigations have revealed that reactive oxygen species (ROS), such as hydrogen peroxide (H2O2) and superoxide (O2−) are central components of the signal transduction cascade involved in plant adaptation to the changing environment. ROS plays two divergent roles: exacerbating damage or signaling the activation of defense responses under biotic and abiotic stresses (1–5). H2O2 is beginning to be accepted as a second messenger for signals generated by means of ROS because of its relatively long life and high permeability across membranes (1–5). To allow for these different roles, cellular levels of ROS must be stringently controlled. Catalase, which degrades H2O2 into water and oxygen, is one of the major antioxidant enzymes (6). It is one of the first enzymes to be purified and crystallized and has gained a lot of attention in recent years because of its link to cancer, diabetes, and aging in humans and animals (7, 8). In plants, catalase scavenges H2O2 generated during mitochondrial electron transport, β-oxidation of the fatty acids, and most importantly photorespiratory oxidation (6). Accumulating evidence indicates that catalase plays an important role in plant defense, aging, and senescence. Catalase activity is influenced by other factors such as salicylic acid and nitric oxide. Salicylic acid nonselectively inhibits the activity of all catalases or protects them from inactivation, possibly depending on the redox status of the cell (9, 10). It was recently reported that nitric oxide inhibits the activity of tobacco catalase (11). However, the process by which catalase becomes activated/inactivated is not well understood.
Environmental signals trigger rapid and transient increases in cytosolic Ca2+. The cytosolic Ca2+ concentration can reach up to 100 μM from the resting level of 100–200 nM after stimulation in animal cells (12). Calcium signals modulate cellular processes by means of high-affinity, calcium-binding proteins such as calmodulin (CaM), which in turn regulates the activity of downstream target proteins (13–16). Recent studies suggest that changes in intracellular redox and calcium homeostasis are unifying consequences of biotic and abiotic stresses. Treatment with H2O2 can stimulate increases in cytosolic Ca2+ (17) by activating the calcium channel (18). Nonetheless, H2O2 production in the oxidative burst requires a continuous Ca2+ influx, which activates the plasma membrane-localized NADPH oxidase (19–21). Ca2+-binding EF hands are present in the gp91phox subunit of NADPH oxidase (22). Ca2+/CaM have been proposed to increase H2O2 generation through Ca2+/CaM-dependent NAD kinase that affects the concentration of available NADPH during assembly and activation of NADPH oxidase (23). The cloning and characterization of plant NAD kinase would further substantiate this process. We report herein that Ca2+/CaM binds to plant catalase and enhances its activity. However, Ca2+/CaM had no effect on bacterial, fungal, bovine, or human catalase. This finding suggests that calcium/CaM can down-regulate H2O2 levels in plants. Based on these results, it is proposed that calcium/CaM plays a critical role in controlling H2O2 homeostasis in plants.
Materials and Methods
Screening the cDNA Library.
The Arabidopsis flower cDNA expression library (Uni-Zap) from the Arabidopsis Biological Resources Center (Columbus, OH) was screened by using 35S-labeled potato CaM (PCM6) as described (24). The positive cDNA clones were sequenced on both strands. DNA sequences were analyzed by using GCG version 10.0 software.
Construction of DNA Templates Coding Arabidopsis Catalase 3 (AtCat3) Proteins.
The templates coding for wild type and mutants were produced by PCR amplification from the original cDNA with AtCat3-specific oligonucleotides containing appropriate restriction sites (NdeI at the 5′ end and BamHI at the 3′ end) for cloning into the downstream of [His]6 tag into the pET-14b expression vector (Novagen). AtCat3 was expressed in Escherichia coli strain BL21(DE3) pLysS according to Studier et al. (25). The nucleotide sequence of the cloned fragments derived by PCR amplification was determined after cloning into the pET-14b vector with oligonucleotides designed for sequencing from both sides of the pET-14b cloning sites as primers.
CaM Binding Assay.
The recombinant AtCat3 proteins were extracted and purified essentially as described (24). The amount of protein was estimated by the Bradford's method with a protein assay kit (Bio-Rad). Proteins were separated by SDS/PAGE, electrotransferred onto poly(vinylidene difluoride) membranes (Millipore), and incubated with 35S-labeled recombinant CaM (PCM6) plus 0.2 mM CaCl2, 0.4 mM EGTA, 0,2 mM MgCl2, and 0.2 mM MnCl2, respectively, in 25 mM Tris⋅HCl (pH 7.5), 200 mM NaCl. The membranes were washed with the same buffer without 35S-labeled CaM and exposed to x-ray film overnight.
Gel Mobility-Shift Assay.
The synthetic peptide was prepared by using an Applied Biosystems peptide synthesizer 431A in the Laboratory of Bioanalysis and Biotechnology, Washington State University. Recombinant CaM (PCaM6) was purified as described (24) and dialyzed thoroughly in 25 mM Tris⋅HCl (pH 7.0). Samples containing 240 pmol (4 μg) of PCaM6 and different amounts of purified synthetic peptides in 100 mM Tris⋅HCl, pH7.2, and either 0.2 mM CaCl2 or 0.4 mM EGTA in a total volume of 30 μl were incubated for 1 h at room temperature. The samples were analyzed by nondenaturing PAGE as described (24).
Purification of Tobacco Catalase.
The catalase was purified from the leaves of tobacco plants (Nicotiana tabacum cv. Xanthi) following Durner and Klessig (10). Briefly, 1 kg tobacco leaves was homogenized in 2 liters of extraction buffer containing 50 mM Tris⋅HCl (pH 7.0), 100 mM NaCl, 10% glycerol, 10 mM DTT, 1 μM leupeptin, 10 μM antipain, and 1 mM PMSF. The homogenate was centrifuged at 9,000 g for 15 min. Ammonium sulfate was added to the supernatant by 22% saturation and centrifuged at 14,000 g for 25 min. Then the ammonium sulfate concentration of the supernatant was brought to 65% saturation. After centrifugation at 14,000 g for another 25 min, the pellet was resuspended in the extraction buffer and fractionated with 0.8 vol of 0°C ethanol/chloroform (3:1, vol/vol) containing 1 mM PMSF. The upper aqueous layer was centrifuged at 47,000 g for 25 min. The supernatant was diluted 4-fold with 20 mM Tris⋅HCl (pH 7.0) and applied to a phenyl-Sepharose column (Amersham Pharmacia). After washing with the same buffer, the catalase was eluted with 50% (vol/vol) ethylene glycol in 20 mM Tris⋅HCl, pH 7.0. The catalase was precipitated by the addition of 3 vol of 50 mM Tris⋅HCl (pH 7.0), containing 90% (wt/vol) ammonium sulfate, and centrifuged at 47,000 g for 25 min. After resuspension and buffer exchange (PD-10, Amersham Pharmacia) against 10 mM Tris⋅HCl (pH 7.0), the sample was applied to a hydroxyapatite column (Bio-Rad) equilibrated with the same buffer. The column was washed with 40 mM Tris⋅HCl (pH 7.0), and the catalase was eluted with 200 mM Tris⋅HCl (pH 7.0), 200 mM NaCl. After buffer exchange (PD-10) against 25 mM Tris⋅HCl (pH 7.0), 150 mM NaCl, and 1 mM CaCl2 was added. The samples were applied to a CaM-Sepharose column (Amersham Pharmacia). By washing with the same buffer, the catalase was eluted from the column with the buffer containing 25 mM Tris⋅HCl (pH 7.0) and 2 mM EGTA. Fractions containing the catalase were pooled and thoroughly dialyzed against buffer containing 25 mM Tris⋅HCl (pH 7.0) and 10% glycerol.
Electrophoretic Techniques.
SDS/PAGE was performed by using 10% gel for catalase and 15% gel for CaM. Gels were stained with Coomassie blue R-250 or with silver nitrate by using the Bio-Rad silver stain kit. Western blotting was performed by transferring proteins to the nitrocellulose membranes. Catalase was detected with a mAb against tobacco catalase, CaM was detected with a monoclonal anti-bovine CaM antibody (Santa Cruz Biotechnology) and an ECL detection kit from Pierce.
Catalase Activity Assay.
Catalases from Aspergillus niger, bovine liver, and human erythrocytes were purchased from Sigma and treated as described (10). The catalytic activities of the catalases were measured spectrophotometrically by monitoring the changes of H2O2 at OD240 at room temperature as described (10). The reaction mixtures for each catalase (0.1 μM) included calcium alone (0.2 mM CaCl2), CaM alone (0.25 μM), both calcium and CaM (0.2 mM CaCl2 + 0.25 μM CaM), and control (without CaCl2 and CaM) in 50 mM Tris⋅HCl, pH 7.0. The reactions were started by adding 10 mM H2O2 from a 30% stock (Sigma). Catalase activity is expressed in units of mmol of H2O2 decomposed/mg per min.
Results and Discussion
The Arabidopsis cDNA library was screened by using the 35S-labeled CaM-binding screening approach as described (24). One of the positive clones showed an identical nucleotide sequence to AtCat3 in the database (GenBank accession no. U43147). To prove that AtCat3 encoded a CaM-binding protein, the full coding region of AtCat3 was subcloned into the pET14b expression vector. The recombinant AtCat3 was induced by isopropyl β-d-thiogalactoside (IPTG) (Fig. 1A) and was purified by CaM affinity chromatography to near homogeneity. Total bacterial extract was used for CaM-binding assay, and it was shown that 35S-labeled CaM binds to the AtCat3 protein in the presence of Ca2+ (Fig. 1A). After adding EGTA, no CaM binding was observed. Furthermore, 35S-labeled CaM did not bind to AtCat3 when CaCl2 was replaced by other divalent cations such as MgCl2 or MnCl2 (Fig. 1A), suggesting that CaM binding to AtCat3 is Ca2+-dependent.
Figure 1.

CaM binding to AtCat3. (A) Total bacterial proteins from wild-type AtCat3 were subjected to SDS/PAGE and Coomassie staining or transferred onto a nitrocellulose membrane. The membrane was incubated with 35S-labeled 50 nM CaM in a buffer containing 0.4 mM EGTA, 0.2 mM CaCl2, 0.2 mM MgCl2, or 0.2 mM MnCl2. (Left) Coomassie staining gel showing the induction of the AtCat3 by IPTG. (Right) CaM-binding assay showing that CaM specifically binds to AtCat3 in the presence of calcium. (B) Mapping of CaM binding region in AtCat3. (Left) Coomassie staining gel showing the total proteins from wild type or deletion mutants of AtCat3 after IPTG induction. (Right) CaM-binding assay showing that calcium/CaM binds to wild type and mutant 1–451, but not to mutant 1–414. (C) Gel mobility-shift assay showing CaM binding to the synthetic peptide (amino acids 415–451 in AtCat3) (Left) in the presence of 0.2 mM CaCl2 and (Right) in the presence of 0.4 mM EGTA.
To identify the CaM-binding area in AtCat3, two C-terminal deletion mutants were used for 35S-CaM-binding assays. In the presence of 0.2 mM Ca2+, CaM binds to the wild type and mutant 1–451, whereas CaM did not bind to mutant 1–414 (Fig. 1B), suggesting that the CaM-binding region for AtCat3 is restricted to amino acids 415–451. To further confirm CaM binding to AtCat3, a synthetic peptide corresponding to amino acids 415–451 of AtCat3 was incubated with CaM. The formation of the peptide-CaM complex was assessed by nondenaturing PAGE. The 36-mer peptide is capable of forming a stable complex with CaM in the presence of Ca2+ (Fig. 1C). In the absence of peptide, a single CaM band was observed. As the peptide concentration increased, another band with low mobility appeared, representing the peptide-CaM complex. When the molar ratio between the peptide and CaM was 1:1, only the peptide-CaM complex band was detected, indicating that there is only one CaM-binding site in the peptide. No peptide-CaM complex was formed in the presence of EGTA (Fig. 1C). These results indicate that CaM specifically binds to the AtCat3 in a calcium-dependent manner.
Catalase exists in almost all aerobic organisms. In animals, there is only one catalase isoform encoded by a single gene. In contrast, catalase in plants is present as multiple isoforms encoded by a small gene family (6, 26). At least this is true in monocots such as maize and dicots such as tobacco, Arabidopsis, and pumpkin, in which catalase is well characterized. Interestingly, each of them has three isoforms encoded by three genes. To determine whether all catalases have the CaM-binding regions, the amino acid sequences of 37 catalases from bacteria, animals, and plants were compared by using the pileup program in the GCG10 package. The amino acid sequence comparison revealed very high homology in the N-terminal 384 aa (about 60% similarity and 50% identity). However, in the C-terminal 108 aa, where the CaM-binding region is located, there was very little similarity between AtCat3 and other nonplant catalases (about 21% homology and 14% identity). Nevertheless, all plant catalases showed high homology in this portion (about 78% homology and 70% identity), particularly in the region corresponding to the CaM-binding area in AtCat3. Fig. 2 shows the C-terminal 108-aa sequence comparison of 13 representative catalases. Although the amino acid sequences in the characterized CaM-binding proteins are not conserved in the CaM-binding region, most of them have a secondary structural feature, the basic amphiphilic α-helix (27), such as the auxin-regulated protein ZmSAUR1 (24) and the plant chimeric Ca2+/CaM protein kinase (28). Note that there are often negatively charged amino acids in CaM-binding regions, but the net charge is positive (16). Based on the helical wheel projection using the GCG program, it was determined that the amino acids 438–451 in AtCat3 are capable of forming a basic amphiphilic α-helix. It is clear that one side of the helical wheel is hydrophobic and the other side is hydrophilic with net positive charges. Analysis of the amino acid sequences corresponding to the CaM-binding region of AtCat3 predicted the existence of a basic amphiphilic α-helix in some of other plant catalases. Interestingly, among three catalase isoforms in maize, tobacco, Arabidopsis, and pumpkin, there is at least one isoform with the amphiphilic α-helical structure in each species, e.g., tobacco1 (amino acids 431–444), maize3 (amino acids 442–455), and pumpkin1 (amino acids 438–451), as well as Arabidopsis AtCat1 (amino acids 438–451). Whether it is true for all plant species is not clear because of the limited catalase sequences for other plant species in GenBank. Based on the crystal structure data of bacterial and mammalian catalases, α-helices are the typical structures in the C-terminal portion of these catalases (29), but no basic amphiphilic α-helical structure exists in this portion according to helical wheel projection.
Figure 2.

Comparison of the C-terminal portion of AtCat3 (amino acids 385–492) with other catalases from plants, animals, fungi, and bacteria. The CaM-binding region of AtCat3 is marked with a line above the sequences. The GenBank accession numbers are: AtCat1, U43340; AtCat2, X64271; AtCat3, U43147; Tobacco1, Z36975; Tobacco2, Z36978; Tobacco3, Z36977; Pumpkin1, D55645; Pumpkin2, D55646; Pumpkin3, D55647; Maize1, X60135; Maize2, Z54358; Maize3, L05934; human, X04076; bovine, P00432; Drosophila, X52286; A. niger, Z23138; Bacillus, M80796.
To test whether CaM binds to purified catalase from planta, tobacco catalase was purified from the leaves based on Durner and Klessig (10). A CaM-Sepharose column was used as the last step in the purification process. The summary of the purification steps of catalase using 1,000 g of tobacco leaves is presented in Table 1. Tobacco catalase was purified to near homogeneity as judged by SDS/PAGE and silver staining (Fig. 3, lane 1). Catalase identity was confirmed by Western blotting with a mAb against the tobacco catalase (Fig. 3, lane 3). CaM binding to purified tobacco catalase was demonstrated by the following approaches. (i) A CaM-Sepharose column was used for purification of tobacco catalase. The recovery rate for this step was 81% (Table 1), suggesting most of the catalase from tobacco leaves is a CaM-binding protein. (ii) 35S-labeled CaM was used to test the binding to the purified catalase in the presence of 0.2 mM CaCl2 (Fig. 3, lane 5). Recombinant AtCat3 was used as a control (Fig. 3, lanes 2, 4, and 6). Addition of 0.4 mM EGTA abolished CaM binding, suggesting that CaM binds to the plant catalase in a Ca2+-dependent manner. CaM-binding assays were also carried out to determine whether it binds to fungal, bovine, or human catalase. The results revealed that none of these nonplant catalases showed any CaM binding (data not shown), which is in agreement with the amino acid sequence comparisons (Fig. 2).
Table 1.
Purification of catalase from tobacco leaves
| Purification steps | Total protein, mg | Total activity, unit* | Recovery rate, %* | Specific activity, unit/mg
|
Purification factor* | ||
|---|---|---|---|---|---|---|---|
| A* | B† | B/A | |||||
| Crude extract | 3,640 | 362 | 0.099 | 0.22 | 2.22 | ||
| Ethanol/chloroform | 91.4 | 144 | 39.8 | 1.58 | 3.51 | 2.22 | 15.8 |
| Phenyl-Sepharose | 8.2 | 132 | 91.7 | 16.1 | 34.7 | 2.16 | 160 |
| Hydroxyapatite | 1.35 | 82.6 | 62.6 | 61.2 | 134.2 | 2.19 | 616.2 |
| CaM-Sepharose | 1.06 | 66.9 | 81.0 | 63.1 | 157.9 | 2.50 | 637.4 |
Catalase activity in the absence of Ca2+/CaM.
Catalase activity in the presence of Ca2+/CaM.
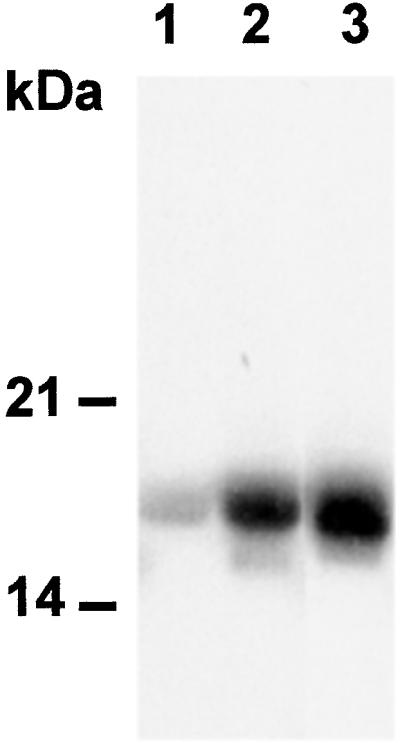
Figure 3.

CaM binds to plant catalase. Lane 1, silver staining showing the purity of the catalase from tobacco leaves. Lane 3, Western blot showing that monoclonal tobacco catalase antibody can detect purified catalase. Lane 5, CaM-binding assay showing that 35S-CaM binds to purified catalase. Two-microgram recombinant AtCat3 was loaded as a control in each experiment (lanes 2, 4, and 6).
The CaM-binding site or closely juxtaposed regions in other characterized CaM-binding proteins often function as the autoinhibitory or pseudosubstrate domains. This region maintains the target proteins in an inactive state in the absence of Ca2+ signal, such as in plant chimeric Ca2+/CaM-dependent protein kinase (30) and glutamate decarboxylase (31). To study the significance of CaM binding to plant catalases, catalytic activities of the recombinant AtCat3 and purified tobacco catalase were measured in the presence and absence of CaCl2 and CaM. Similar experiments also were carried out by using other nonplant catalases. The E. coli-expressed recombinant AtCat3 showed no activity. Similar results were obtained in another laboratory (Zhixiang Chen, personal communication). This may have resulted from the failure to form the correct structure for recombinant catalase, because the active catalase is a tetramer made up of four identical or similar subunits (6, 10, 26). In contrast, the purified tobacco catalase showed a significant Ca2+/CaM-dependent change in activity during the purification steps (Table 1). The stimulatory effects of Ca2+/CaM are about 2.2-fold in each step, except the sample that was obtained after the CaM-Sepharose chromatography. It showed a higher stimulation of the catalase activity (2.5-fold) possibly because of the removal of non-Ca2+/CaM-binding catalase fraction (Table 1). The non-Ca2+/CaM-binding catalase fraction had a specific activity of 59.6 units (basal activity). However, Ca2+/CaM did not stimulate the activity of this fraction of catalase (data not shown). These results indicate that Ca2+/CaM is able to activate the tobacco catalase in the fraction that was obtained after CaM-Sepharose chromatography, which corresponds to the CaM-binding results. To compare the effects of Ca2+/CaM on the activity of catalases from different sources, the relative activity was used, because there is significant difference in the specific activity of catalases from different species. For example, A. niger catalase has the specific activity of 5.7 units; bovine liver catalase, 51.9 units; human erythrocytes, 39.5 units; tobacco catalase, 63.1 units (in the absence of Ca2+/CaM). Fig. 4A shows that CaCl2 alone or CaM alone had no stimulatory effect on the tobacco catalase activity (about 40% of maximal activity). No difference in catalytic activity was observed in fungal, bovine, or human catalases in the presence or absence of Ca2+, CaM, and Ca2+/CaM (Fig. 4A). By replacing CaCl2 with MgCl2, there was no significant change in tobacco catalase activity in the presence or absence of CaM (data not shown). To further document the effect of Ca2+/CaM on plant catalase activity, 10 μM of the peptide corresponding to AtCat3 CaM-binding region (415–451) was added to each reaction mixture. Nonplant catalases were unaffected by the addition of the peptide. However, the stimulatory effect of Ca2+/CaM on tobacco catalase activity was abolished by the addition of the peptide (Fig. 4A). In addition, the inhibitory effect of the peptide on tobacco catalase activity depended on the concentration of the peptide (Fig. 4B). The catalase activity was inhibited by about 58%, which is close to the basal activity of catalase. However, the peptide had no effect on the bovine catalase activity at all concentrations tested (Fig. 4A). These results suggest that Ca2+/CaM has a stimulatory effect on the purified plant catalase, but has no effect on the nonplant catalases.
Figure 4.

Calcium/CaM regulates the catalytic activity of plant catalase. The activity of catalase was measured by monitoring H2O2 decay at 240 nm before and after adding catalase in the presence and absence of Ca2+ and/or CaM. The activity was expressed as a percentage of the maximal activity for each catalase. Data are the mean ± SE from four separate experiments. (A) CaM activates tobacco catalase in the presence of calcium. The peptide corresponding to the CaM-binding region in AtCat3 (amino acids 415–451) inhibits the tobacco catalase activity. (B) Kinetics of the inhibition of tobacco catalase activity by peptide (amino acids 415–451). ●, bovine liver catalase; ○, tobacco catalase.
It is known that catalase is a predominant peroxisomal enzyme, but it also exists in the mitochondria and cytoplasm (32). For example, maize Cat3, which might be a CaM-binding catalase based on amino acid sequence comparison, is a mitochondrial protein (33). Our results (Figs. 1–4) demonstrate that CaM binds to plant catalase and regulates its activity. To demonstrate the presence of this regulatory activity in vivo, we studied whether CaM coexists with catalase in the peroxisomes of plants. Organelles from etiolated pumpkin cotyledon extracts were separated by sucrose density centrifugation. To remove the contamination of cytosolic proteins that might be present in the solution or merely associated with the peroxisomal membrane, the isolated peroxisomes were treated with proteinase K. In this way, the peroxisomal proteins shielded from protease by the peroxisomal membrane were not digested (34, 35). The identity of the peroxisomal fractions was proved by measuring the catalase activity (35). CaM is very conserved across kingdoms (13–16), hence we did Western analysis with an anti-human CaM antibody. As a control, the recombinant potato CaM PCM6 was used (Fig. 5, lane 3). Interestingly, a band in a size similar to PCM6 was present in the peroxisomal fractions, but the intensity was considerably lower compared to cytosolic CaM (Fig. 5). These results indicate that CaM and catalase are colocalized in the peroxisomes. CaM is a small acidic protein that is primarily expressed in the cytoplasm. However, in plants, CaM has been shown to be present in several organelles such as the nucleus and chloroplasts (36, 37) and extracellular matrix (38). Also, CaM-regulated proteins exist in extracellular matrix, nucleus, and chloroplasts (38–40). How CaM crosses the membrane is not clear. Recent studies indicate that posttranslational modifications play a role in the translocation of some CaM isoforms. For example, a petunia CaM-like protein, CaM53, is associated with plasma membrane when the protein is prenylated. If prenylation is inhibited, CaM53 is found predominantly in the nucleus (41).
Figure 5.
The existence of CaM in peroxisomes. Twenty micrograms of total proteins from the peroxisome and cytosol was separated in 15% SDS/PAGE and subjected to Western analysis. CaM was detected by an anti-bovine CaM antibody. Two micrograms recombinant potato CaM PCM6 was used as a control. Lane 1, peroxisome fraction; lane 2, cytosol fraction; lane 3, PCM6.
To our knowledge, there is no report that discusses calcium concentration in the peroxisomes. Based on a recent modified model of the peroxisome biogenesis, the peroxisome originates from the endoplasmic reticulum (ER) by means of preperoxisomal vesicles (42). It is known that the ER is one of the intracellular calcium pools. Thus, the calcium concentration in peroxisomes could be as high as in the ER. Measuring the peroxisomal calcium concentration and monitoring any link between the change of calcium concentration in cytoplasm and peroxisome should help in our understanding of how peroxisomal catalase is regulated by Ca2+/CaM. For example, the free calcium concentration could be measured in the transgenic plants with the reconstituted aequorin with a peroxisome-targeting signal. Aequorin is a calcium-sensitive luminescent protein, the luminescence of which directly reports the calcium change (43). Because peroxisome is a major organelle that removes the toxic ROS, mainly H2O2, it is reasonable to speculate that peroxisomal catalase activity remains high all of the time to degrade H2O2 in situ at a rapid rate. However, fluctuations in the cytosolic calcium could have a major effect on cytosolic catalase activity. It is important to stress that not all catalases are CaM-binding proteins. Hence, further investigations are needed to address the significance of Ca2+/CaM in controlling catalase activity in different organelles.
Biotic and abiotic stresses trigger a Ca2+ influx, and the increased cytosolic Ca2+ stimulates the production of H2O2, which diffuses into surrounding cells as a messenger and induces the physiological response (19, 20). Our results suggest that increased cytosolic Ca2+ can reduce H2O2 levels by means of Ca2+/CaM-mediated stimulation of catalase activity (Fig. 4). We propose that increased cytosolic Ca2+ has dual roles in regulating H2O2 homeostasis (Fig. 6): (i) positive regulation generates H2O2 by directly activating NADPH oxidase, which has affinity to Ca2+ (22) and indirectly producing more NADPH by means of Ca2+/CaM-regulated NAD kinase (23); and (ii) negative regulation reduces H2O2 by stimulating catalase activity through Ca2+/CaM modulation (Fig. 4). Signal-induced changes in Ca2+ transients may differ in the frequency, duration, amplitude, and spatial localization of oscillations, and mode of spatial propagation, which leads to differential effects on the calcium target proteins (12, 44).
Figure 6.

Model showing Ca2+-triggered changes leading to the positive and negative regulation of H2O2 level in plants. For positive regulation, extracellular signals trigger an influx of Ca2+, which increases the generation of H2O2. This may occur by activating NADPH oxidase, which has affinity to Ca2+, and increasing the production of NADPH by means of CaM-regulated NAD kinase. For negative regulation, Ca2+ binds to CaM, and the Ca2+/CaM complex stimulates the catalytic activity of catalase, leading to the rapid degradation of H2O2. The increase in H2O2 can boost the Ca2+ influx by activating the calcium channel.
Acknowledgments
We thank Dr. Laura J. Olsen, University of Michigan, Ann Arbor, for kindly providing us with pumpkin peroxisome and cytosol samples, and Dr. Zhixiang Chen, University of Idaho, Moscow, for providing us with a sample of the monoclonal anti-tobacco catalase antibody. We also thank them for helpful discussions. This work was supported by National Aeronautics and Space Administration Grant NAG5-11364 and National Science Foundation Grant MCB 0082256.
Abbreviations
- ROS
reactive oxygen species
- CaM
calmodulin
- AtCat3
Arabidopsis catalase 3
- IPTG
isopropyl β-d-thiogalactoside
Footnotes
This paper was submitted directly (Track II) to the PNAS office.
References
- 1.Levine A, Tenhaken R, Dixon R, Lamb C. Cell. 1994;79:583–593. doi: 10.1016/0092-8674(94)90544-4. [DOI] [PubMed] [Google Scholar]
- 2.Prasad T K, Anderson M D, Martin B A, Stewart C R. Plant Cell. 1994;6:65–74. doi: 10.1105/tpc.6.1.65. [DOI] [PMC free article] [PubMed] [Google Scholar]
- 3.Alvarez M E, Pennell R I, Meijer P J, Ishikawa A, Dixon R A, Lamb C. Cell. 1998;92:773–784. doi: 10.1016/s0092-8674(00)81405-1. [DOI] [PubMed] [Google Scholar]
- 4.Allan A C, Fluhr R. Plant Cell. 1997;9:1559–1572. doi: 10.1105/tpc.9.9.1559. [DOI] [PMC free article] [PubMed] [Google Scholar]
- 5.Orozco-Cardenas M, Narvaez-Vasquez J, Ryan C. Plant Cell. 2001;13:179–191. [PMC free article] [PubMed] [Google Scholar]
- 6.Scandalios J G, Guan L M, Polidoros A. In: Oxidative Stress and the Molecular Biology of Antioxidant Defenses. Scandalios J G, editor. Plainview, NY: Cold Spring Harbor Lab. Press; 1997. pp. 343–406. [Google Scholar]
- 7.Melov S, Ravenscroft J, Malik S, Gill M S, Walker D W, Clayton P E, Wallace D C, Malfroy B, Doctrow S R, Lithgow G J. Science. 2000;289:1567–1569. doi: 10.1126/science.289.5484.1567. [DOI] [PubMed] [Google Scholar]
- 8.Preston T J, Muller W J, Singh G. J Biol Chem. 2001;276:9558–9564. doi: 10.1074/jbc.M004617200. [DOI] [PubMed] [Google Scholar]
- 9.Chen Z, Silva H, Klessig D F. Science. 1993;262:1883–1886. doi: 10.1126/science.8266079. [DOI] [PubMed] [Google Scholar]
- 10.Durner J, Klessig D F. J Biol Chem. 1996;271:28492–28501. doi: 10.1074/jbc.271.45.28492. [DOI] [PubMed] [Google Scholar]
- 11.Clark D, Durner J, Navarre D A, Klessig D F. Mol Plant-Microbe Interact. 2000;13:1380–1384. doi: 10.1094/MPMI.2000.13.12.1380. [DOI] [PubMed] [Google Scholar]
- 12.Trewavas A J. In: Biochemistry and Molecular Biology of Plants. Buchanan B B, Gruissem W, Jones R L, editors. Rockville, MD: Am. Soc. Plant Physiologists; 2000. pp. 930–987. [Google Scholar]
- 13.Roberts D M, Harmon A C. Annu Rev Plant Physiol Plant Mol Biol. 1992;43:375–414. [Google Scholar]
- 14.Poovaiah B W, Reddy A S N. CRC Crit Rev Plant Sci. 1993;12:185–211. doi: 10.1080/07352689309701901. [DOI] [PubMed] [Google Scholar]
- 15.Zielinski R. Annu Rev Plant Physiol Plant Mol Biol. 1998;49:697–725. doi: 10.1146/annurev.arplant.49.1.697. [DOI] [PubMed] [Google Scholar]
- 16.Snedden W A, Fromm H. New Phytol. 2001;151:35–66. doi: 10.1046/j.1469-8137.2001.00154.x. [DOI] [PubMed] [Google Scholar]
- 17.Price A H, Taylor A, Ripley S J, Griffiths A, Trewavas A J, Knight M R. Plant Cell. 1994;6:1301–1310. doi: 10.1105/tpc.6.9.1301. [DOI] [PMC free article] [PubMed] [Google Scholar]
- 18.Pei Z M, Murata Y, Benning G, Thomine S, Klusener B, Allen G J, Grill E, Schroeder J I. Nature (London) 2000;406:731–734. doi: 10.1038/35021067. [DOI] [PubMed] [Google Scholar]
- 19.Lamb C, Dixon R A. Annu Rev Plant Physiol Plant Mol Biol. 1997;48:251–275. doi: 10.1146/annurev.arplant.48.1.251. [DOI] [PubMed] [Google Scholar]
- 20.Grant M, Brown I, Adams S, Knight M, Ainslie A, Mansfield J. Plant J. 2000;23:441–450. doi: 10.1046/j.1365-313x.2000.00804.x. [DOI] [PubMed] [Google Scholar]
- 21.Xing T, Higgins V J, Blumwald E. Plant Cell. 1997;9:249–259. doi: 10.1105/tpc.9.2.249. [DOI] [PMC free article] [PubMed] [Google Scholar]
- 22.Keller T, Damude H G, Werner D, Doerner P, Dixon R A, Lamb C. Plant Cell. 1998;10:255–266. doi: 10.1105/tpc.10.2.255. [DOI] [PMC free article] [PubMed] [Google Scholar]
- 23.Harding S A, Oh S H, Roberts D M. EMBO J. 1997;16:1137–1144. doi: 10.1093/emboj/16.6.1137. [DOI] [PMC free article] [PubMed] [Google Scholar]
- 24.Yang T, Poovaiah B W. J Biol Chem. 2000;275:3137–3143. doi: 10.1074/jbc.275.5.3137. [DOI] [PubMed] [Google Scholar]
- 25.Studier F W, Rosenberg A H, Dunn J J, Dubendorf J W. Methods Enzymol. 1990;185:60–89. doi: 10.1016/0076-6879(90)85008-c. [DOI] [PubMed] [Google Scholar]
- 26.McClung C R. Free Radical Biol Med. 1997;23:489–496. doi: 10.1016/s0891-5849(97)00109-3. [DOI] [PubMed] [Google Scholar]
- 27.O'Neil K T, DeGrado W E. Trends Biochem Sci. 1990;15:59–64. doi: 10.1016/0968-0004(90)90177-d. [DOI] [PubMed] [Google Scholar]
- 28.Patil S, Takezawa D, Poovaiah B W. Proc Natl Acad Sci USA. 1995;92:4897–4901. doi: 10.1073/pnas.92.11.4897. [DOI] [PMC free article] [PubMed] [Google Scholar]
- 29.Fita I, Murthy R N, Rossmann M G. J Mol Biol. 1986;188:63–72. doi: 10.1016/0022-2836(86)90480-8. [DOI] [PubMed] [Google Scholar]
- 30.Sathyanarayanan P V, Cremo C R, Poovaiah B W. J Biol Chem. 2000;275:30417–30422. doi: 10.1074/jbc.M000771200. [DOI] [PubMed] [Google Scholar]
- 31.Snedden W A, Koutsia N, Baum G, Fromm H. J Biol Chem. 1996;271:4148–4153. doi: 10.1074/jbc.271.8.4148. [DOI] [PubMed] [Google Scholar]
- 32.Bray E A, Bailey-Serres J, Weretilnyk E. In: Biochemistry and Molecular Biology of Plants. Buchanan B B, Gruissem W, Jones R L, editors. Rockville, MD: Am. Soc. Plant Physiologists; 2000. pp. 1158–1203. [Google Scholar]
- 33.Scandalios J G. Adv Genet. 1990;28:1–41. doi: 10.1016/s0065-2660(08)60522-2. [DOI] [PubMed] [Google Scholar]
- 34.Brickner D G, Harada J J, Olsen L J. Plant Physiol. 1997;113:1213–1221. doi: 10.1104/pp.113.4.1213. [DOI] [PMC free article] [PubMed] [Google Scholar]
- 35.Liepman A H, Olsen L J. Plant J. 2001;25:487–498. doi: 10.1046/j.1365-313x.2001.00961.x. [DOI] [PubMed] [Google Scholar]
- 36.van Der Luit A H, Olivari C, Haley A, Knight M R, Trewavas A J. Plant Physiol. 1999;121:705–714. doi: 10.1104/pp.121.3.705. [DOI] [PMC free article] [PubMed] [Google Scholar]
- 37.Jarrett H W, Brown C J, Black C C, Cormier M J. J Biol Chem. 1982;257:13795–13804. [PubMed] [Google Scholar]
- 38.Ma L, Xu X, Cui S, Sun D. Plant Cell. 1999;11:1351–1364. doi: 10.1105/tpc.11.7.1351. [DOI] [PMC free article] [PubMed] [Google Scholar]
- 39.Szymanski D B, Liao B, Zielinski R E. Plant Cell. 1996;8:1069–1077. doi: 10.1105/tpc.8.6.1069. [DOI] [PMC free article] [PubMed] [Google Scholar]
- 40.Yang T, Poovaiah B W. Biochem Biophys Res Commun. 2000;275:601–607. doi: 10.1006/bbrc.2000.3335. [DOI] [PubMed] [Google Scholar]
- 41.Rodriguez-Concepcion M, Yalovsky S, Zik M, Fromm H, Gruissem W. EMBO J. 1999;18:1996–2007. doi: 10.1093/emboj/18.7.1996. [DOI] [PMC free article] [PubMed] [Google Scholar]
- 42.Mullen R T, Flynn C R, Trelease R N. Trends Plant Sci. 2001;6:256–261. doi: 10.1016/s1360-1385(01)01951-3. [DOI] [PubMed] [Google Scholar]
- 43.Knight M R, Campbell A K, Smith S M, Trewavas A J. Nature (London) 1991;352:524–526. doi: 10.1038/352524a0. [DOI] [PubMed] [Google Scholar]
- 44.Allen G J, Chu S P, Schumacher K, Shimazaki C T, Vafeados D, Kemper A, Hawke S D, Tallman G, Tsien R Y, Harper J F, et al. Science. 2000;289:2338–2342. doi: 10.1126/science.289.5488.2338. [DOI] [PubMed] [Google Scholar]