Abstract
The salt tolerance of a freshwater cyanobacterium, Synechococcus sp. PCC 7942, transformed with genes involved in the synthesis of a Na+/H+ antiporter, betaine, catalase, and a chaperone was examined. Compared with the expression of betaine, catalase, and the chaperone, the expression of the Na+/H+ antiporter gene from a halotolerant cyanobacterium (ApNhaP) drastically improved the salt tolerance of the freshwater cyanobacterium. The Synechococcus cells expressing ApNhaP could grow in BG11 medium containing 0.5 M NaCl as well as in sea water, whereas those expressing betaine, catalase, and the chaperone could not grow under those conditions. The coexpression of ApNhaP with catalase or ApNhaP with catalase and betaine did not further enhance the salt tolerance of Synechococcus cells expressing ApNhaP alone when grown in BG11 medium containing 0.5 M NaCl. Interestingly, the coexpression of ApNhaP with catalase resulted in enhanced salt tolerance of cells grown in sea water. These results demonstrate a key role of sodium ion exclusion by the Na+/H+ antiporter for the salt tolerance of photosynhetic organisms.
Keywords: Aphanothece halophytica‖genetic engineering
Accumulation of salts in irrigated soil is a primary factor depressing yield in crop production (1). High salinity causes ion imbalance and hyperosmotic stress in plants. Organisms that thrive in hypersaline environments possess specific mechanisms to adjust their internal osmotic status. One such mechanism is the ability to accumulate low molecular weight organic compatible solutes such as sugars, some amino acids, and quaternary ammonium compounds (2). Another mechanism for adaptation to high salinity is the exclusion of Na+ ion from cells, which has been proposed as a function of a Na+/H+ antiporter and Na+-ATPase (3). In addition to these toxic effects, salt stress induces oxidative stress (4). Considerable efforts to improve the salt tolerance of plants by genetic engineering techniques have been made (5–11). But, those achievements are not satisfactory (12). To gain insight into the complex network of genes responsible for salt tolerance, it is important to have information concerning the master genes for salt tolerance. Compared with plants, unicellular cyanobacteria are simple and hence more suitable for evaluating the effectiveness of each gene for salt tolerance in photosynthetic organisms.
Previously, it was shown that the expression of genes for synthesis of betaine and catalase could confer salt tolerance on the freshwater cyanobacterium Synechococcus sp. PCC 7942 (13–15). However, the expression of a Na+/H+ antiporter from Vibrio alginolytica NhaAv resulted in a Na+-sensitive transformant (16). Recently, we isolated a eukaryotic Na+/H+ antiporter gene (apnhaP) from a halotolerant cyanobacterium Aphanothece halophytica and showed that ApNhaP exhibits high Na+/H+ exchange activity over a wide range of pH with novel ion specificity (17). Therefore, it was interesting to examine the effects of expression of ApNhaP and genes for the synthesis of betaine, catalase, and a chaperone (DnaK) and their combinations. We attempted the expression of eight kinds of plasmids in the freshwater cyanobacterium Synechococcus sp. PCC 7942 and tested for salt tolerance. It was found that compared with the overproduction of betaine, catalase, and DnaK the expression of ApNhaP drastically improved the salt tolerance of the freshwater cyanobacterium and suggested that among the several functions the exclusion of NaCl by the plasma membrane Na+/H+ antiporter is a key factor for salt tolerance. Very recently, interesting papers appeared showing that the expression of a vacuole-type Na+/H+ antiporter in the vacuole conferred salt tolerance on Brassica (18) and tomato (19).
Materials and Methods
Construction of Expression Vectors.
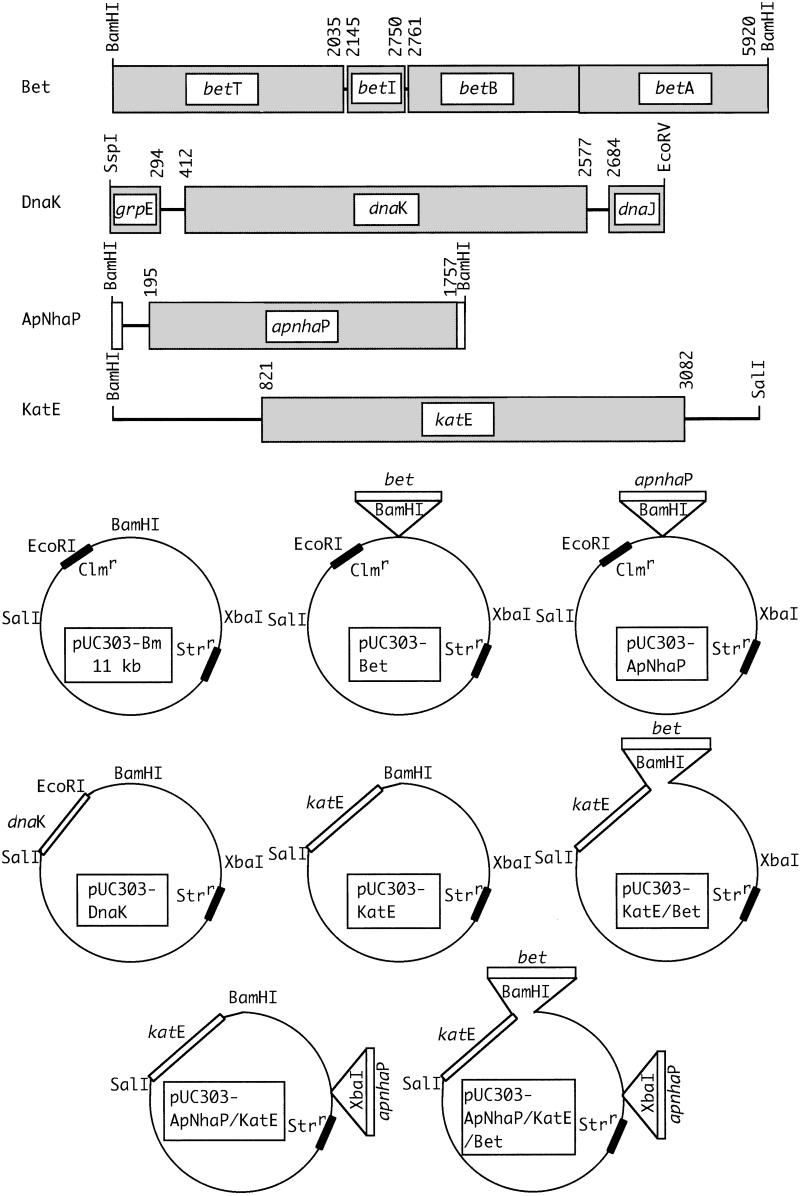
The plasmids pUC303-KatE (15), pUC303-Bet (13), and pUC303-KatE/Bet (15) were used for the expression of mono-functional catalase, betaine, and both catalase and betaine, respectively. The plasmid pUC303-Bm was used in the control cells (13). For the construction of expression plasmid pUC303-DnaK, the 3-kbp fragment that contains the dnaK gene from A. halophytica (20) was digested with SspI and EcoRV and blunt-ended, and then ligated into the EcoRI- and SalI-double-digested and blunt-ended site of pUC303-Bm. An expression plasmid for ApNhaP that contains its own promoter was constructed as follows. The Na+/H+ antiporter fragment, spanning from the EcoRI site at 539 in the apnhaP gene to the stop codon just after the His tag sequence in pTrcHis2C, was amplified by the PCR technique with pANhaP as template (17). The forward primer ApNhEcF1 (5′-TGGGAATTCCCCTCGGAA-3′) contains an EcoRI site, and the reverse primer ApNhBmR1 (5′-GTGGATCCTCAATGATGATGATGATG-3′) contains a BamHI site after the stop codon. The amplified fragment was ligated into the EcoRV site of pBluescript II SK+. Another Na+/H+ antiporter fragment, spanning from −194 to the EcoRI site at 539, was amplified by PCR using the genomic DNA of A. halophytica as a template. The forward primer ApNhEcF2 (5′-CTGAATTCGATCGCGGCTCATATT-3′) contains the EcoRI site and the reverse primer ApNhEcR2 (5′-GGGAATTCCCACTAATAGA-3′) also contains the EcoRI site at 539. The amplified fragment was ligated into the EcoRI-digested site of pBluescript II SK+ to which the C-terminal part of the amnhaP gene was already ligated. After checking the orientation, the correctly ligated plasmid, pBApNhaP, was digested with BamHI and ligated into the BamHI-digested site of the Escherichia coli/Synechococcus shuttle vector, pUC303-Bm (13). The resulting plasmid was designated pUC303-ApNhaP. For the coexpression of the apnhaP and katE genes, the plasmid pUC303-KatE was used in which the katE gene from E. coli was ligated to the SalI/BamHI-digested site. The katE gene was a kind gift from P. C. Loewen, University of Manitoba, Manitoba, Canada (21). The plasmid pUC303-KatE was digested with XbaI and blunt-ended. The apnhaP gene was prepared by digesting the pUC303-ApNhaP with BamHI and blunt-ending. The resulting apnhaP gene was ligated into the XbaI-digested pUC303-KatE, generating the plasmid pUC303-ApNhaP/KatE. For the coexpression of apnhaP, katE, and bet genes, the plasmid pUC303-KatE/Bet was used. The pUC303-KatE/Bet was digested with XbaI and blunt-ended, to which the BamHI cut and blunt-ended apnhaP gene was ligated. The resulting plasmid was designated pUC303-ApNhaP/KatE/Bet. These plasmids were used to transform Synechococcus cells (13).
Growth of Cyanobactera Under Salt Stress.
Synechococcus cells were subcultured at 30°C under continuous fluorescent white light (30 μE m−2⋅s−1) in BG11 liquid medium supplemented with 10 μg⋅ml−1 streptomycin and bubbled with air (15, 16). When the bet genes were expressed, 100 μM choline was added. For the salt stress experiments, cells at the late logarithmic phase were transferred into fresh medium containing various concentrations of NaCl (0–0.5 M). The cultures were incubated for several days. During these periods, the growth of cells was monitored by measuring the absorbance at 730 nm with a Shimadzu UV-160A. SDS/PAGE and immunoblotting were carried out as described (20). An antibody raised against 6-histidine (6×-His tag) was obtained from R & D Systems (22). DnaK protein was detected by immunoblotting (20). Glycine betaine was measured with time of flight–MS (model KOMPACT MALDI IV tDE, Shimadzu/Kratos), and catalase activity was measured by activity staining (15).
Measurements of Photosynthetic Activities.
The apparent quantum yield in photosystem II was measured with a PAM fluorometer (Walz, Effeltrich, Germany) (8, 15). Before the measurements, cells were dark-adapted for 10 min, and then the quantum yield in photosystem II under continuous light (200 μE m−2⋅s−1) was calculated by the equation (Fm′ − F)/Fm′, where F and Fm′ represent the fluorescence levels under irradiation before and after a saturating flash, respectively.
Measurements of Na+/H+ Antiporter Activities.
Na+/H+ activity was measured essentially according to Nakamura et al. (23). Briefly, Synechococcus sp. PCC 7942 cells were suspended in 0.15 M NaCl containing 50 mM diethanolamine-HCl (pH 9.3). In this treatment, cellular K+ was replaced with diethanolamine by the function of the K+/H+ antiporter. The amine-loaded cells were washed with 0.15 M NaCl containing 20 mM Hepes-NaOH buffer (pH 8.5). At this step, the cell interior was acidified because of the release of diethanolamine and then Na+ was loaded in exchange for H+ by means of Na+/H+ antiporters. Before measurements of Na+/H+ antiporter activity, cells were energized by addition of 0.2% glucose, and then 50 mM diethanolamine-HCl (pH 8.5) was added. At the appropriate time, cells were collected by filtration and Na+ ions on the filters were determined with a Shimadzu Personal Ion Analyzer PIA-1000 (8, 15).
Results
Expression Plasmids and Growth in BG11 Medium.
We constructed eight kinds of expression plasmids as shown in Fig. 1. They were the expression plasmids for the Na+/H+ antiporter ApNhaP from A. halophytica, pUC303-ApNhaP (17); the molecular chaperone DnaK from A. halophytica, pUC303-DnaK (20); catalase from E. coli, pUC303-KatE (15, 21); betaine synthesis genes from E. coli, pUC303-Bet (13, 24); and their combinations. They are believed to function for ion homeostasis, protein folding, active oxygen quenching, and as an osmoprotectant, respectively. All of these genes use their own promoter sequences.
Figure 1.
Schematic structure of expression vectors.
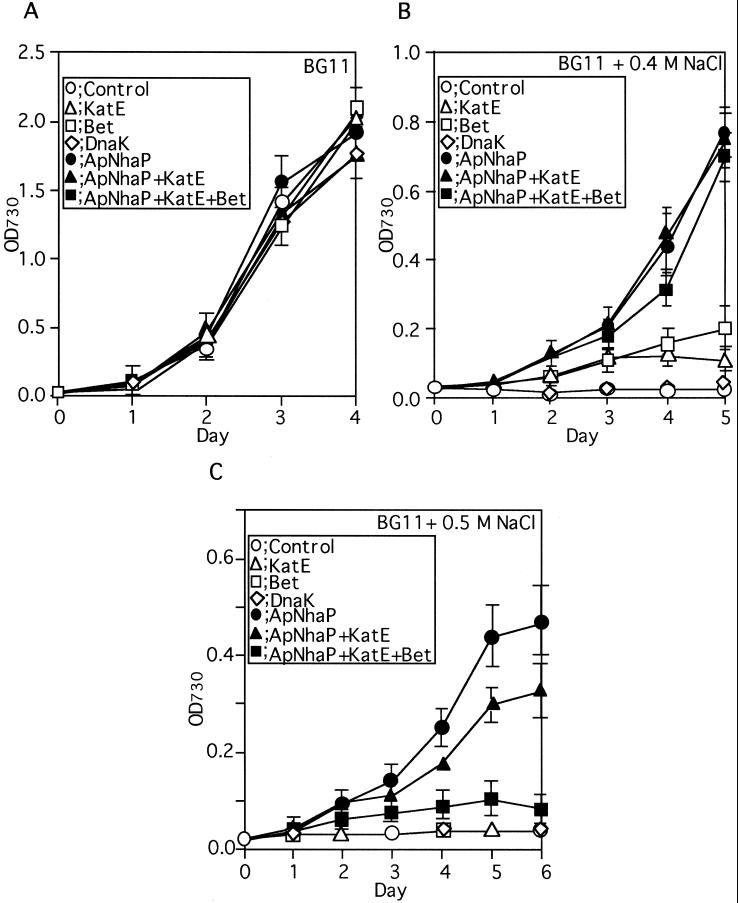
Fig. 2A shows that all of the transformants could grow almost at the same rates in BG11 medium, indicating that the transformation did not impair growth under low salinity. At high salinity, the growth rate control cells decreased and apparently no growth occurred at concentrations higher than 0.375 M NaCl.
Figure 2.
Effects of salt stress on the growth rates of the control and transformed Synechococcus cells. The control and transformed cells at logarithmic phase in BG11 medium were subjected to salt stress by inoculation into fresh medium containing the indicated concentrations of NaCl.
At 0.4 M NaCl, control cells and those expressing dnaK could not grow whereas the cells expressing bet or katE could (Fig. 2B). Interestingly, the apnhaP cells could grow at a significantly higher rate than those expressing bet or katE (Fig. 2B). The cells coexpressing apnhaP, katE, and bet showed a slightly decreased growth rate compared to those expressing apnhaP alone. The expressions of apnhaP (17), katE (15), bet (13), and dnaK (20) were confirmed as described in Materials and Methods (data not shown). If nonionic osmolyte (0.8 M sucrose) or another salt (0.4 M KCl) was used instead of NaCl in the control cells, the growth rate was similar or slightly lower than that in BG11 medium, respectively (data not shown), indicating that the effects of NaCl on growth rates are indeed caused by sodium, but not by osmolarity.
When the concentration of NaCl was raised to 0.5 M, the control cells and the cells expressing dnaK, katE, and bet could not grow (Fig. 2C). Only the cells expressing apnhaP could grow. The cells expressing apnhaP alone showed a better growth rate than those coexpressing apnhaP and katE or coexpressing apnhaP, katE, and bet. These data clearly indicate that the expression of ApNhaP significantly improved salt tolerance of Synechococcus cells and coexpression of ApNhaP with other relevant proteins did not improve the salt tolerance of ApNhaP-expressing cells.
Na+/H+ Exchange Activity in ApNhaP-Expressing Cells.
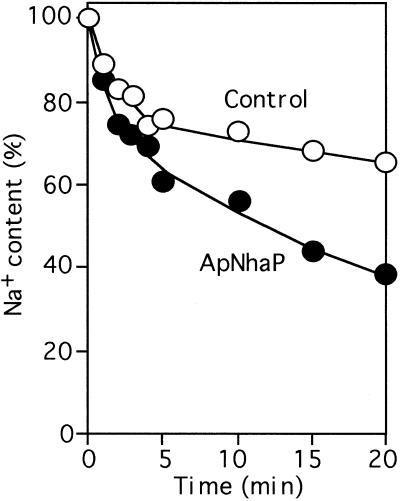
Next, we examined the expression level of ApNhaP and its Na+/H+ exchange activity. To test this, the control and ApNhaP-expressing cells were grown in BG11 medium until the optical density at 730 nm reached 0.5, and then transferred to the BG11 medium containing 0.5 M NaCl. After incubation for 1 day, the Na+ exclusion activity of Na+-loaded cells was measured upon the addition of diethanolamine (23). Neutral diethanolamine could penetrate the cells and become protonated. The required protons must be taken up from outside the cells through the mediation of Na+/H+ antiporters with the exchange of Na+. Thus, Na+ exclusion activity reflects the Na+/H+ antiporter activity. As shown in Fig. 3, a larger decrease of intracellular Na+ was observed in the ApNhaP-expressing cells than the control cells. Similar phenomena were observed for cells incubated with 0.3 M NaCl. But, the difference of Na+ exclusion activity between the control and ApNhaP-expressing cells decreased upon the decrease of salinity (data not shown). These results indicate that the ApNhaP-expressing cells have higher antiporter activity than the control cells.
Figure 3.
Exclusion of Na+ from Na+ loaded cells. The control and ApNhaP-expressing cells were grown in BG11 medium until the optical density at 730 nm reached 0.5 and then they were transferred to medium containing 0.5 M NaCl. After incubation for 1 day, diethanolamine-induced exclusion of Na+ was measured.
Effects of Salt Shock on Growth and Photosynthetic Activity.
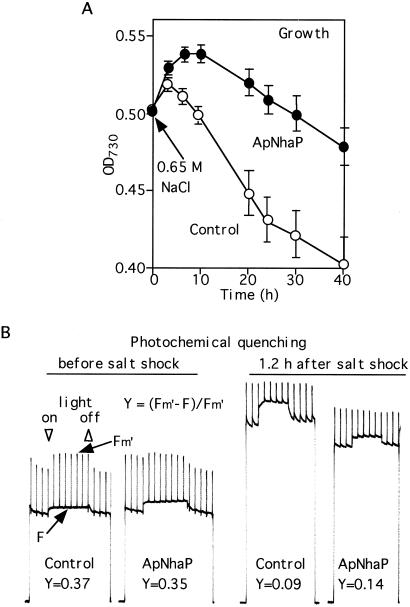
Next, we examined the effects of salt shock on the growth rate of ApNhaP-expressing cells. Upon salt shock (0.65 M NaCl), the ApNhaP-expressing cells could grow up to 10 h whereas the control cells grew with a slower rate, up to 3 h (Fig. 4A). After 1.2 h of salt shock, much higher Na+ exclusion activity was observed for the ApNhaP-expressing cells than for the control cells after the addition of diethanolamine, i.e., 75% vs. 30% during 15 min (data not shown). Salt stress has been shown to impair photosynthetic activity in a number of photosynthetic organisms (7, 11, 14). To determine whether the expression of ApNhaP can improve photosynthetic activity after salt shock, we measured the quantum yield of photosystem II as shown in Fig. 4B. Before salt shock, the quantum yields of photosystem II for the control and the ApNhaP-expressing cells were similar, 0.37 vs. 0.35. However, at 1.2 h after salt shock, these values were decreased to 0.09 and 0.14, respectively. The decrease for the control cells was larger than that for the ApNhaP-expressing cells. These results, together with the data for the Na+/H+ exchange activity, indicate that the ability of cells to retain high photosynthetic activity depends on efficient Na+ extrusion.
Figure 4.
Effects of salt shock on the growth rate (A) and photosynthetic electron transport activity (B) in control and ApNhaP-expressing Synechococcus cells. The control and ApNhaP-expressing cells were grown in BG11 medium until the optical density at 730 nm reached 0.5 and then transferred to the new medium containing 0.65 M NaCl.
ApNhaP-Expressing Cells Could Grow in Sea Water.
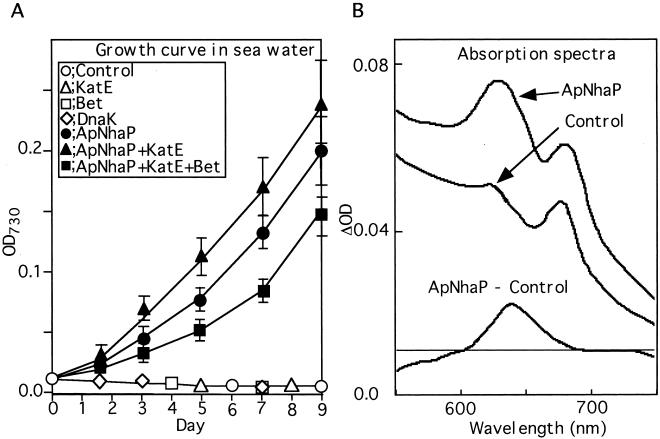
We tested whether ApNhaP-expressing cells could grow in sea water. Sea water was taken from the Mikawa area of Aichi Prefecture in Japan, and its salinity was measured to be 30.4 psu, ≈0.41 M sodium. It was found that the ApNhaP-expressing cells could grow in sea water (Fig. 5A). However, the transformant cells expressing either Bet and/or KatE could not grow in sea water. The coexpression of ApNhaP and KatE resulted in a higher growth rate than that of the ApNhaP-expressing cells, which was in contrast to the results seen in Fig. 2C using BG11 containing 0.5 M NaCl as a growth medium. Synechococcus cells coexpressing ApNhaP, KatE, and Bet could also sustain growth in sea water, although with a slower growth rate than the ApNhaP-expressing cells. These results clearly indicate that expression of ApNhaP conferred salt tolerance on the freshwater cyanobacterium Synechococcus cells to the extent that they could grow in sea water. During the growth of Synechococcus cells in sea water, we found differences in the absorption spectra between the control and the ApNhaP-expressing cells. As shown in Fig. 5B, the ApNhaP-expressing cells exhibited a typical ratio of absorbance between the 630-nm and 680-nm regions. In contrast, the control cells showed significantly decreased absorbance at the 630-nm region compared to that in the 680-nm region. This could be clearly seen by the difference spectrum after normalization to chlorophyll absorption. Because these absorption peaks represent the phycobilisomes and chlorophylls, respectively, the above data suggest that the degradation of phycobilisomes occurs earlier than that of chlorophylls in the control cells, suggesting that phycobilisome degradation may be a product of salt stress.
Figure 5.
Growth curve (A) and absorption spectra (B) of control and transformed Synechococcus cells in sea water. The control and transformed cells at logarithmic phase in BG11 medium were transferred to sea water. In growth curve (A), the initial growth rates ([doubling times (day)]−1) of the cells expressing ApNhaP, ApNhaP + KatE, and ApNhaP + KatE + Bet were 0.88 ± 0.06, 0.76 ± 0.03, and 0.64 ± 0.03, respectively. The absorption spectra (B) of the control and ApNhaP-expressing cells were measured 3 days after transfer to sea water. The difference spectrum between the ApNhaP and control cells was normalized to chlorophyll absorption.
Discussion
The data presented above clearly indicate that compared with the expression of betaine, catalase, and DnaK the expression of ApNhaP from a halotolerant cyanobacterium drastically improved the salt tolerance of a freshwater cyanobacterium. The Synechococcus cells expressing ApNhaP could grow in sea water.
The data can be interpreted as follows. Synechococcus cells have a sufficient capacity for exchange between Na+ and H+ at low salinity. Under high salinity, the low Na+ exclusion activity renders Synechococcus cells unable to cope with Na+ influx, resulting in the cessation of growth. The expression of ApNhaP in Synechococcus cells permits growth in high-salinity medium and even in sea water.
Previously, we introduced the nhaAv gene from Vibrio alginolytica into the same cyanobacterium, Synechococcus sp. PCC 7942 (16), but obtained a Na+-sensitive transformant. One plausible reason for the different effects seen in the NhaAv and ApNhaP strains might be caused by the mistargeting of Vibrio NhaAv to the thylakoid membrane (16). In the present study, the introduced gene, apnhaP, was from a halotolerant cyanobacterium and the host cell was a freshwater cyanobacterium. Therefore, it is likely that the correct targeting of ApNhaP from A. halophytica to the plasma membranes of Synechococcus sp. PCC7942 occurred.
The growth rate of the cells coexpressing ApNhaP and KatE was almost the same (Fig. 2B) or slightly slower (Fig. 2C) than the cells expressing ApNhaP when they were grown in BG11 medium containing 0.4 M or 0.5 M NaCl, respectively. On the contrary, when grown in sea water, the cells coexpressing ApNhaP and KatE yielded slightly better growth than those expressing ApNhaP alone (Fig. 5A). However, the coexpression of ApNhaP, KatE, and Bet did not enhance the growth rates of the ApNhaP-expressing cells in both BG11 medium and sea water (Figs. 2C and 5A). In these ApNhaP-expressing cells, the expression levels of ApNhaP were similar (data not shown). It is unclear why different effects were observed between sea water and BG11 medium in the case of ApNhaP- and KatE-coexpressing cells and why decreased growth rates were observed in both sea water and BG11 medium in the case of ApNhaP-, KatE-, and Bet-coexpressing cells. From these facts, we conclude that the introduction of many genes into these cells does not necessarily produce salt-tolerant plants. In contrast, introduction of a few important genes might be superior for the construction of salt-tolerant plants. Indeed, recent papers by Blumwald's group (5, 18, 19) elegantly showed that overexpression of a single vacuolar Na+/H+ antiporter gene in plants such as oil seed crop Brassica napus permitted them to grow, flower, and produce seeds in the presence of 0.2 M NaCl. Hitherto, we have examined the properties of various transgenic plants by using the dnaK gene from A. halophytica (25, 26), the GS2 gene from rice (8), bet genes from several species (27, 28), Mn-SOD gene from yeast (29), and the katE gene from E. coli. From careful comparison of these transformants under the same conditions and more systematic approaches, the molecular breeding of salt-tolerant plants applicable in the fields should be possible.
Acknowledgments
We thank Ms. Toshie Inaba and Ms. Eiko Tsunekawa for their expert technical assistance. This work was supported in part by Grants-in-Aid for Scientific Research from the Ministry of Education, Science, and Culture of Japan and the High-Tech Research Center of Meijo University.
Footnotes
This paper was submitted directly (Track II) to the PNAS office.
References
- 1.Zhu J-K. Trends Plant Sci. 2001;6:66–71. doi: 10.1016/s1360-1385(00)01838-0. [DOI] [PubMed] [Google Scholar]
- 2.Kempf B, Bremer E. Arch Microbiol. 1998;170:319–330. doi: 10.1007/s002030050649. [DOI] [PubMed] [Google Scholar]
- 3.Serrano R, Rodriguez-Navarro A. Curr Opin Cell Biol. 2001;13:399–404. doi: 10.1016/s0955-0674(00)00227-1. [DOI] [PubMed] [Google Scholar]
- 4.Asada K. Annu Rev Plant Physiol Plant Mol Biol. 1999;50:601–639. doi: 10.1146/annurev.arplant.50.1.601. [DOI] [PubMed] [Google Scholar]
- 5.Apse M P, Aharon G S, Snedden W A, Blumwald E. Science. 1999;285:1256–1125. doi: 10.1126/science.285.5431.1256. [DOI] [PubMed] [Google Scholar]
- 6.Tarczynski M C, Jensen R G, Bohnert H J. Science. 1993;259:508–510. doi: 10.1126/science.259.5094.508. [DOI] [PubMed] [Google Scholar]
- 7.Allakhverdiev S I, Nishiyama Y, Suzuki I, Tasaka Y, Murata N. Proc Natl Acad Sci USA. 1999;96:5862–5867. doi: 10.1073/pnas.96.10.5862. [DOI] [PMC free article] [PubMed] [Google Scholar]
- 8.Hoshida H, Tanaka Y, Hibino T, Hayashi Y, Tanaka A, Takabe T, Takabe T. Plant Mol Biol. 2000;43:103–111. doi: 10.1023/a:1006408712416. [DOI] [PubMed] [Google Scholar]
- 9.Gisbert C, Rus A M, Bolarin M C, Lopez-Coronado J M, Arrillaga I, Montesinos C, Caro M, Serrano R, Moreno V. Plant Physiol. 2000;123:393–402. doi: 10.1104/pp.123.1.393. [DOI] [PMC free article] [PubMed] [Google Scholar]
- 10.Kasuga M, Liu Q, Miura S, Yamaguchi-Shinozaki K, Shinozaki K. Nat Biotechnol. 1999;17:287–291. doi: 10.1038/7036. [DOI] [PubMed] [Google Scholar]
- 11.Hayashi H, Alia, Mustardy L, Deshnium P, Ida M, Murata N. Plant J. 1997;12:133–142. doi: 10.1046/j.1365-313x.1997.12010133.x. [DOI] [PubMed] [Google Scholar]
- 12.Yeo A R, Yeo M E, Flowers S A, Flowers T J. Theor Appl Genet. 1998;79:377–384. doi: 10.1007/BF01186082. [DOI] [PubMed] [Google Scholar]
- 13.Nomura M, Ishitani M, Takabe T, Rai A K, Takabe T. Plant Physiol. 1995;107:703–708. doi: 10.1104/pp.107.3.703. [DOI] [PMC free article] [PubMed] [Google Scholar]
- 14.Deshnium P, Los D A, Hayashi H, Mustardy L, Murata N. Plant Mol Biol. 1995;29:897–907. doi: 10.1007/BF00014964. [DOI] [PubMed] [Google Scholar]
- 15.Kaku N, Hibino T, Tanaka Y, Ishikawa H, Araki E, Takabe T, Takabe T. Plant Sci. 2000;159:281–288. doi: 10.1016/s0168-9452(00)00353-8. [DOI] [PubMed] [Google Scholar]
- 16.Kaku N, Hibino T, Tanaka Y, Takabe T, Nakamura T, Takabe T. Plant Cell Physiol. 1999;40:557–564. [Google Scholar]
- 17.Waditee R, Hibino T, Tanaka Y, Nakamura T, Incharoensakdi A, Takabe T. J Biol Chem. 2001;276:36931–36938. doi: 10.1074/jbc.M103650200. [DOI] [PubMed] [Google Scholar]
- 18.Zhang H-X, Joanna N, Hodson J N, Williams J P, Blumwald E. Proc Natl Acad Sci USA. 2001;98:12832–12836. doi: 10.1073/pnas.231476498. [DOI] [PMC free article] [PubMed] [Google Scholar]
- 19.Zhang H-X, Blumwald E. Nat Biotechnol. 2001;98:12832–12836. doi: 10.1073/pnas.231476498. [DOI] [PMC free article] [PubMed] [Google Scholar]
- 20.Lee B H, Hibino T, Jo J, Viale A M, Takabe T. Plant Mol Biol. 1997;35:763–775. doi: 10.1023/a:1005867420619. [DOI] [PubMed] [Google Scholar]
- 21.Ossowski I, Mulvey M R, Leco PA, Borys A, Loewen P C. J Bacteriol. 1991;173:514–520. doi: 10.1128/jb.173.2.514-520.1991. [DOI] [PMC free article] [PubMed] [Google Scholar]
- 22.Hamada A, Hibino T, Nakamura T, Takabe T. Plant Physiol. 2000;125:437–446. doi: 10.1104/pp.125.1.437. [DOI] [PMC free article] [PubMed] [Google Scholar]
- 23.Nakamura T, Komano Y, Unemoto T. Biochim Biophys Acta. 1995;1230:170–176. doi: 10.1016/0005-2728(95)00053-l. [DOI] [PubMed] [Google Scholar]
- 24.Lamark T, Kaasen I, Eshoo M W, McDougall J, Strom A P. Mol Microbiol. 1991;5:1049–1064. doi: 10.1111/j.1365-2958.1991.tb01877.x. [DOI] [PubMed] [Google Scholar]
- 25.Sugino M, Hibino T, Nii N, Takabe T, Takabe T. Plant Sci. 1999;146:81–88. [Google Scholar]
- 26.Ono K, Hibino T, Kohinata T, Suzuki S, Tanaka Y, Nakamura T, Takabe T, Takabe T. Plant Sci. 2001;160:455–461. doi: 10.1016/s0168-9452(00)00412-x. [DOI] [PubMed] [Google Scholar]
- 27.Kishitani S, Takanami T, Suzuki M, Oikawa M, Yokoi S, Ishitani M, Alvarez-Nakase A M, Takabe T, Takabe T. Plant Cell Environ. 2000;23:107–114. [Google Scholar]
- 28.Takabe T, Nakamura T, Nomura M, Hayashi Y, Ishitani M, Muramoto Y, Tanaka A, Takabe T. In: Stress Responses of Photosynthetic Organisms. Satoh K, Murata N, editors. Amsterdam: Elsevier; 1998. pp. 115–131. [Google Scholar]
- 29.Tanaka Y, Hibino T, Hayashi Y, Tanaka A, Takabe T, Takabe T. Plant Sci. 1999;148:131–138. [Google Scholar]


