

Abstract
Noncoding genetic variants underlie many complex diseases, yet identifying and interpreting their functional impacts remains challenging. Late-onset Alzheimer’s disease (LOAD), a polygenic neurodegenerative disorder, exemplifies this challenge. The disease is strongly associated with noncoding variation, including common variants enriched in microglial enhancers and rare variants that are hypothesized to influence neurodevelopment and synaptic plasticity. These variants often perturb regulatory sequences by disrupting transcription factor (TF) motifs or altering local TF interactions, thereby reshaping gene expression and chromatin accessibility. However, assessing their impact is complicated by the context-dependent functions of regulatory sequences, underscoring the need to systematically examine variant effects across diverse tissues, cell types, and cellular states.
Here, we combined in vitro and in vivo massively parallel reporter assays (MPRAs) with interpretable machine-learning models to systematically characterize common and rare variants across myeloid and neural contexts. Parallel profiling of variants in four immune states in vitro and three mouse brain regions in vivo revealed that individual variants can differentially and even oppositely modulate regulatory function depending on cell-type and cell-state contexts. Common variants associated with LOAD tended to exert stronger effects in immune contexts, whereas rare variants showed more pronounced impacts in brain contexts. Interpretable sequence-to-function deep-learning models elucidated how genetic variation leads to cell-type-specific differences in regulatory activity, pinpointing both direct transcription-factor motif disruptions and subtler tuning of motif context. To probe the broader functional consequences of a locus prioritized by our reporter assays and models, we used CRISPR interference to silence an enhancer within the SEC63-OSTM1 locus that harbors four functional rare variants, revealing its gatekeeper role in inflammation and amyloidogenesis. These findings underscore the context-dependent nature of noncoding variant effects in LOAD and provide a generalizable framework for the mechanistic interpretation of risk alleles in complex diseases.
Late-onset Alzheimer’s disease (LOAD), the most prevalent neurodegenerative disorder worldwide, exhibits strong heritability1. Its genetic architecture comprises multiple components, including the strong influence of the APOE ε4 allele2, common variants with weaker effects, and rare variants. Genome-wide association studies (GWAS)3–6 have identified numerous common variants (minor allele frequency (MAF) ≥ 0.01) that are enriched for functions in immune cells, particularly microglia and macrophages. This genetic landscape implicates neuroinflammation and mirrors the broad observed failure of microglial functions in LOAD brains7,8: impaired surveillance9,10, reduced amyloid-β11,12 and tau clearance13,14, dysregulated injury response15,16, and altered inflammatory regulation17,18. Notably, top risk genes such as BIN1 and TREM2 encode proteins crucial for maintaining myeloid homeostasis; dysfunction in these genes perturbs processes like endocytosis19,20, lipid metabolism19,21, and cytokine signaling19,22, thereby accelerating neurodegeneration23,24. Human single-nucleus transcriptomic studies further delineate distinct microglial activation states, and several of these states display more prominent LOAD-associated gene expression signatures, suggesting state-specific genetic effects25,26. Although fine-mapping efforts are increasingly narrowing down GWAS signals27–31 in the immune context, pinpointing the exact causal variants and their functional mechanisms remains a major challenge.
In contrast to GWAS, whole-genome sequencing (WGS) of 2,247 individuals from 605 multiplex LOAD families uncovered 13 loci with consistent association of rare variant (MAF < 0.01) clusters, such as CTNNA2, KIF2A, SYTL3, CLSTN2, NALCN, and FNBP1L, whose products are pivotal for synaptic function and neurodevelopment32.
This suggests that neuron-intrinsic genetic risk constitutes a previously underappreciated dimension of LOAD. Nevertheless, limited statistical power for individual rare variants within these clusters obscures the identity of the causal alleles, and their precise functional consequences therefore remain unknown. Thus, directly measuring the effects of individual rare alleles and benchmarking them against common variants is essential to establish their relative impact and underlying mechanisms. Furthermore, immune-versus-neural cell-type divergence underscores the importance of analyzing genetic variants in disease-relevant cell types and states. Consequently, there is a critical need for systematic, large-scale functional measurements that directly compare common and rare variants, coupled with detailed mechanistic interpretations in disease-relevant cellular contexts.
Both the GWAS and WGS studies suggest that LOAD is predominantly driven by noncoding variants3–6,32. Noncoding genetic variants contribute to the risk of many complex diseases by disrupting gene regulation, often through interference with transcription factor (TF) binding at cis-regulatory elements (CREs) such as enhancers and promoters33–35. The activity of these CREs can be highly cell-type-specific and even state-specific, shaped by the availability and dynamics of distinct TFs36–39. This specificity implies that the effects of genetic variants on CRE function, and consequently on disease risk, are likewise context-dependent40,41. LOAD GWAS variants show significant enrichment in microglia and macrophage enhancers, potentially disrupting immune enhancer activities42,43. A well-characterized CRE is the microglia-specific enhancer ~25 kb upstream of BIN1 that harbors the lead LOAD risk variant rs6733839. CRISPR-mediated deletion of this enhancer in human iPSC-derived microglia selectively lowers BIN1 mRNA and protein levels, suggesting rs6733839 may modulates LOAD risk by altering microglial BIN1 expression43. Although epigenomic modeling that integrates open chromatin, histone marks, and three-dimensional contacts now permits prediction of variant impacts on these CREs, current models still struggle to resolve the resulting transcriptional and cellular consequences because of the versatile, combinatorial nature of TF function.
Quantifying the functional consequences of non-coding genetic variation is intrinsically difficult: regulatory elements act in highly context-specific manner and typically elicit subtler phenotypic changes than coding mutations44. Massively parallel reporter assays (MPRAs) overcome many technical barriers by coupling thousands of synthesized cis-regulatory elements (CREs) to barcoded reporter constructs, positioned either upstream or downstream of a minimal promoter, to measure transcription factor-driven enhancer activity45. Allelic MPRAs directly contrasting CREs that differ by a single nucleotide, now provide a robust, high-throughput read-out of allele-specific regulatory effects30,31,46–48. Traditional in vitro MPRAs achieve excellent transfection efficiency and statistical power, yet they only approximate—rather than fully replicate—the in vivo cellular identity of their target cell type. Recent in vivo tissue MPRAs, including our AAV-based systemic platform (sysMPRA)49, extended this paradigm to native contexts such as adult brain tissue, enabling measurement of regulatory dynamics within complex cellular environments49,50. Thoughtful selection of the experimental system therefore remains critical for accurately inferring variant function. Additionally, while MPRA effectively quantifies variant impacts on transcription, elucidating downstream effects on endogenous gene expression remains limited. To bridge this gap, methods such as CRISPR interference (CRISPRi)51 and CRISPR-based excision43 have been employed to perturb enhancers, enabling profiling of affected gene expression implicated in LOAD, though still at a relatively limited scale28,30,43. Collectively, these experimental advances establish a versatile toolkit for disentangling the consequences of regulatory variants across diverse cellular contexts.
Complementing these experimental approaches, computational methodologies continue to evolve to interpret how genetic variants influence context- and cell-type-dependent gene expression. Early computational frameworks relied on position weight matrices representing individual TF motifs52. Over the past decade, sequence-to-function models such as DeepSEA53, Enformer54, ChromBPNet55, DeepAllele56 and GET57 have advanced the field by using deep neural networks to learn combinatorial regulatory codes directly from DNA. Although predicting gene expression from sequence alone remains difficult, these architectures now deliver state-of-the-art accuracy on chromatin-feature prediction. Within this deep-learning landscape, convolutional neural networks (CNNs)—neural networks that apply learnable filters to scan sequence features such as TF motifs—continue to excel at regulatory genomics tasks, including cell-type-specific enhancer classification58 and genetic variant effect inference27. Although transformer-based, self-supervised “genomic large language models” aspire to achieve zero-shot prediction by learning the “DNA language”—that is, by modeling genome-wide sequence context and long-range dependencies—ab initio–supervised CNNs and their derivatives54 currently deliver superior predictive performance, greater computational efficiency, and—crucially—enhanced interpretability for uncovering underlying biology59,60. Recently, multimodal foundation models such as AlphaGenome61 have emerged, aiming to unify multiple biological data modalities for predicting variant effects; however, these larger models remain limited in their ability to capture cell-type-specific and state-specific nuances, a task at which simpler CNN architectures still outperform62,63. Together, these advances in deep learning provide a powerful, yet still evolving, framework for mechanistically informed prediction of variant effects on gene regulation.
To clarify how non-coding risk alleles shape LOAD in immune and neural contexts, we curated 599 LOAD-associated variants (186 rare variants, MAF < 0.01; 106 low-frequency variants, 0.01 ≤ MAF < 0.05; and 307 common variants, MAF ≥ 0.05) from GWAS and WGS, selecting those that overlap open chromatin in microglia, macrophages, or neurons (Fig. 1a). Variants were grouped by chromatin accessibility in resting and activated immune cells into immune-specific enhancers, ubiquitously active elements, and regions with limited accessibility (Fig. 1b); most reside in intronic, intergenic, or promoter-proximal positions, consistent with distal-enhancer activity.
Fig. 1 |. Integrative framework for identifying context-dependent regulatory effects of LOAD-associated variants.

(a) Manhattan plot of 599 prioritized late-onset Alzheimer’s disease (LOAD) variants, comprising common and rare variants from genome-wide association studies (GWAS) and whole-genome sequencing (WGS) of familial LOAD cases. Variants were selected based on their statistical association strength and overlap with open chromatin regions in brain and immune cell types.
(b) Variants were mapped to regions classified by chromatin accessibility annotations across immune and neuronal cell types and states, derived from bulk and single-nucleus ATAC-seq (Supplementary Table 3), then grouped as immune-specific cis-regulatory elements (CREs), ubiquitously accessible CREs, or regions with low accessibility. The accompanying bar plot summarizes the genomic context of these variants, showing the percentage that fall within 1–5 kb to transcription start site (TSS), promoter, 5’ untranslated regions (5’ UTR), exons, introns, 3’ untranslated regions (3’ UTR), and intergenic regions.
(c) Overview of the experimental and computational pipeline for functional interpretation of noncoding variants. Massively parallel reporter assays (MPRAs) in multiple cell types and states validate regulatory activity and motif context. Convolutional neural networks trained on multi-cell-type, multi-state ATAC-seq data identify putative regulatory variants and transcription factor motifs. CRISPRi perturbation of the SEC63-OSTM1 locus followed by RNA-seq reveals downstream gene expression and pathway changes, linking regulatory variants to LOAD-relevant molecular mechanisms.
In this study, we established an integrated experimental and computational framework that combines context-dependent in vitro and in vivo MPRA, interpretable CNN models, and CRISPRi perturbation (Fig. 1c). Leveraging a validated THP-1 macrophage model that recapitulates canonical immune states together with mouse brain tissue from the cortex, hippocampus, and striatum that captures native neural context, this approach (i) quantifies the regulatory impact of hundreds of LOAD-associated variants, (ii) prioritizes functionally impactful alleles, (iii) dissects their cell-type- and state-specific mechanisms, and (iv) enables in-depth functional analysis of a disease-risk–associated enhancer harboring functional rare variants. Together, this framework connects noncoding genetic variation to context-dependent regulatory mechanisms and, ultimately, to the key genes and molecular pathways involved in LOAD.
Results
Characterization of THP-1 macrophages as an innate-immune-cell model for LOAD
Mononuclear phagocytes, including microglia, macrophages, and monocytes, are implicated in the genetic predisposition to LOAD5,6,27,42,64. Microglia, the resident macrophages of the central nervous system, continuously survey the brain parenchyma9,10, clear amyloid-β (Aβ)11,12 and tau aggregates13,14, respond to neural injury15,16, and modulate neuroinflammation17,18, all of which are processes dysregulated in LOAD7,8. Although microglia are the primary brain-resident immune cells, perivascular macrophages and recruited monocyte-derived macrophages also participate in plaque clearance and secrete proinflammatory cytokines65–68. In microglia-depleted mouse models of LOAD, it was found that monocyte-derived macrophages repopulated the entire brain and could functionally substitute microglia, marked by amyloid plaque association as well as Trem2-expression69. Moreover, peripheral inflammation could induce microglia immune memory through epigenetic reprogramming, modifying LOAD pathology70. Together with microglia, peripheral immune cells are also increasingly recognized as LOAD modulators27,71.
To model mononuclear phagocytes and LOAD-associated microglial states25,26, we adopted THP-1 cells as a macrophage model, leveraging their transcriptomic similarity to primary microglia and macrophages72 and their ease of genetic and pharmacological manipulation. In contrast, HMC3 microglia showed limited transcriptomic resemblance to primary microglia and were therefore used only as a secondary model in this study. Using chromatin accessibility (ATAC-seq) and transcriptome profiling (RNA-seq), we characterized THP-1 macrophages throughout differentiation and upon stimulation with interferon-β (IFN-β), interferon-γ (IFN-γ), or lipopolysaccharide plus IFN-γ (LPS+IFN-γ), modeling antiviral, M1-polarized, and hyperinflammatory states, respectively (Supplementary Tables 1 and 2).
Upon differentiation from monocytes, THP-1 macrophages demonstrated upregulated immune responses and reduced cell-cycle activity, confirming successful differentiation (Extended Data Fig. 1a). IFN-β and IFN-γ treatments predominantly increased chromatin accessibility at promoters and enhancers, activating gene expression, whereas LPS+IFN-γ triggered broader chromatin remodeling that both opened and closed regulatory regions, leading to concurrent gene activation and repression (Extended Data Fig. 1b,c, 2a,c). IFN-β activated viral defense and leukocyte chemotaxis pathways; IFN-γ induced genes involved in bacterial/lipid sensing and protein trafficking; LPS+IFN-γ not only elicited robust interferon responses but also pronounced inflammatory responses (Extended Data Fig. 1d, 2b). Marker genes for microglia and macrophages (e.g., TREM2, IBA1) remained robustly expressed and exhibited state-specific modulation in each state (Extended Data Fig. 2d). Previous studies have shown that THP-1 macrophages exhibit transcriptomic similarity to both primary and stem-cell-derived microglia72; we further demonstrate that they also share epigenomic profiles with stem-cell-derived microglia (Extended Data Fig. 1e). These results demonstrate that we are able to capture gene expression and open chromatin profiles associated with different inflammatory states of mononuclear phagocytes.
Human single-nucleus transcriptomic studies of post-mortem brain tissue and cortical biopsies from living individuals have identified ~12 distinct microglial states in LOAD25,26. We next examined how THP-1 macrophages under different treatments might recapitulate these states. LPS+IFN-γ treatment induced marker genes of inflammatory microglial states identified in human post-mortem brains, MG10, MG2, and MG8 (ordered by descending inflammatory strength). Marker genes of the MG10 state, indicative of strong inflammation, exhibited the highest upregulation (Extended Data Fig. 2e). Inflammatory microglia are closely associated with amyloid plaques25,26. Sun et al. demonstrated that amyloid-β fibrils induce inflammatory responses in iPSC-derived microglia25. Notably, LPS+IFN-γ stimulation of THP-1 macrophages recapitulated the late (24 h) inflammatory response induced by amyloid-β fibrils (Extended Data Fig. 2f), demonstrating the pathological relevance of LPS+IFN-γ-driven inflammation. Disease-associated microglia (DAM) signatures, distributed across MG3, MG4, and MG10, were all upregulated by LPS+IFN-γ stimulation, further underscoring its disease relevance (Extended Data Fig. 2e). Additionally, antiviral state marker genes (MG11) were robustly upregulated by both IFN-β and LPS+IFN-γ, consistent with LPS-mediated endogenous IFN-β production (Extended Data Fig. 2e). These findings reflect that the THP-1 macrophages can recapitulate several key microglial states observed in the brains of LOAD human subjects.
Inflammatory and antiviral microglial states in human brains are enriched for LOAD GWAS variants25,26. We performed stratified linkage disequilibrium score regression (S-LDSC) and observed significant enrichment of LOAD GWAS variants in open chromatin from THP-1 macrophage states, comparable to that in primary microglia, macrophages, and iPSC/hESC-derived microglia, whereas no significant enrichment was detected in neurons (Extended Data Fig. 1f). Collectively, these data illustrate that THP-1 macrophages can recapitulate key microglial marker gene expression, activation states, and epigenomic features linked to LOAD, providing a practical model for dissecting LOAD-associated immune mechanisms.
Context-dependent MPRA identified LOAD-risk enhancers across neural and immune contexts
To systematically evaluate common and rare LOAD variant effects on cis-regulatory activities, we designed MPRA constructs with barcoded 227-bp synthetic CREs carrying reference or alternate alleles downstream of a minimal promoter, which captures enhancer-like activities (Fig. 2a). CREs were open chromatin peak-centered (variants close to open chromatin peak summit), variant-centered (distal variants), or motif-shuffled (disrupting local TF motifs), providing multiple readouts of variant effects (Fig. 2a; Supplementary Table 3). We assayed the library of 1600 CREs in four immune states (resting, IFN-β, IFN-γ, LPS+IFN-γ) by transfecting both THP-1 macrophages and the alternative microglia model HMC3, with HEK293T cells included as a non-immune control. To capture neural activity in vivo, the same library was delivered noninvasively to the brains of four mice via retro-orbital injection of AAV.PHP.eB virus. We dissected out and measured the regulatory activity of CREs in three brain regions: cortex, hippocampus, and striatum (Fig. 2b). Using median absolute deviation (MAD) scores as a measure of enhancer activity, we found high reproducibility between replicates (Pearson’s r ≈ 0.8–0.9 in vitro, r ≈ 0.6–0.7 in vivo; Extended Data Fig. 3a). Activity profiles clustered by cell type, strongly correlated within immune or neural contexts but moderately across them, highlighting distinct regulatory landscapes and additional interspecies differences (Fig. 2c; Supplementary Table 4).
Fig. 2 |. Context-dependent MPRA identified LOAD-risk enhancers across neuronal and immune contexts.

(a) Schematic of the massively parallel reporter assay (MPRA) design. Synthetic 227-bp candidate cis-regulatory elements (CREs) downstream of a minimal promoter that drives the expression of mCherry, each tagged with unique barcodes for quantification. CREs were either open chromatin peak-centered on or variant-centered, with additional motif-disrupted constructs generated by sequence shuffling around selected variants
(b) Reporter libraries were systemically delivered in vivo to the mouse brain tissues (cortex, hippocampus, and striatum) via AAV.PHP.eB viral retro-orbital injection, and transfected in vitro into THP-1 macrophages and HMC3 microglia-like cells under resting, IFN-β, IFN-γ, and LPS+IFN-γ conditions.
(c) CRE enhancer activities show both cell-type- and immune-state-specific patterns. MPRA activity is quantified using cDNA:DNA ratios and modeled via median absolute deviation (MAD) scores (MPRAnalyze quantitative analysis, see methods). MAD scores reveal strong correlations among similar cell types and conditions (Pearson correlation), whereas LPS+IFN-γ stimulation yields more distinct activity profiles and lower correlations with other immune states. This figure mixes scatter plots, histograms of MAD scores, and a heatmap of MAD score correlations.
(d) Immune and ubiquitous CREs (defined in Fig. 1b) exhibit higher activity in THP-1 macrophages, and immune CREs also display elevated activity in brain tissue (P.MAD, MPRAnalyze quantitative analysis).
(e) Coefficients of HOCOMOCO transcription factor motifs in elastic net models that predict MAD scores of THP-1 macrophage MPRA or brain tissue MPRA. Regression outliers highlighted in red have residuals greater than 3-fold the standard deviation.
(f) Clustering of cell-type-specific and broadly active enhancers. The heatmap depicts Z-normalized reporter transcription activity for each candidate CRE (columns) across the assayed cell types/conditions (rows). For every enhancer, reporter activity was quantified as the mean MAD score of its reference and alternate-allele constructs, then standardized within each cell type by dividing by that cell type’s standard deviation to yield a Z-score. Only enhancers with |Z| ≥ 1.65 (≈ 95th percentile) in at least one context are shown, highlighting elements with strong cell-type-specific or broadly shared activity. Unsupervised hierarchical clustering (Euclidean distance, average linkage) organizes both enhancers and cell types; warmer colors indicate higher activity and cooler colors lower activity.
(g) CRE responses to LPS+IFN-γ stimulation in THP-1 macrophages; most responsive CREs exhibit repression upon stimulation (FDR < 0.05, MPRAnalyze comparative analysis, see methods). Volcano plots show the log fold change of CRE enhancer activities in stimulated THP-1 macrophages versus resting THP-1 macrophages at the X-axis and −log10 (FDR) at the Y-axis.
(h) Genes proximal to LPS+IFN-γ-responsive CREs enriched in immune activation pathways (FDR < 0.05, fast gene set enrichment analysis).
Approximately 13% of tested CREs (P.MAD ≤ 0.05) showed significant enhancer activity in macrophages or brain tissue (Extended Data Fig. 3b, Supplementary Table 4). Immune and ubiquitous CREs were more frequently active in THP-1 macrophages, consistent with ATAC-seq annotations, whereas in brain tissue, immune but not ubiquitous CREs retained activity (Fig. 2d). Many of those ubiquitous CREs were at promoters, which may not operate as efficiently in assays in which the candidate CRE is cloned in downstream of the TSS73,74. This assay limitation likely explains why immune, rather than ubiquitous, CREs appeared more active in brain tissue. Elastic net regression on TF motifs explained a substantial proportion of variance in enhancer activities (R2 = 0.90, P = 0.001, in vitro; R2 = 0.48, P = 0.001, in vivo; permutation test) despite higher noise in in vivo measurements, underscoring the central role of motif composition in shaping enhancer activity; notably, TFs linked to neural development and differentiation, including MEF2B, CRX, CLOCK, NR2E1, and POU3F4, emerged as key contributors to brain enhancer specificity (Fig. 2e). We further identified both cell type-specific as well as broadly active enhancer (Fig. 2f); for example, a distal enhancer at the BIN1 locus (rs13025765/rs13025717) was selectively active in macrophages, while a segment of the NRN1 promoter (rs192104059) showed brain-specific activity.
Among interferon stimulations, LPS+IFN-γ (hyperinflammatory) produced the most distinct enhancer responses. In THP-1 macrophages, 146 CREs (10%) showed significant activity changes in response to LPS+IFN-γ treatment, nearly half of which overlapped differentially accessible chromatin regions, while IFN-β and IFN-γ alone affected only three and one CREs, respectively (Fig. 2c; Supplementary Table 5). Similarly, in HMC3 microglia, 97 CREs responded to LPS+IFN-γ (Supplementary Table 5). Notably, LPS+IFN-γ induced widespread enhancer repression while activating only a small subset of enhancers, highlighting the role of repressive TFs in inflammatory responses (Fig. 2g). The nearest genes to these LPS+IFN-γ-responsive CREs were enriched in immune activation pathways, underscoring their functional relevance (Fig. 2h). Motif analysis revealed that the AP-1 family motif FOSL2 and ELK1 gained positive regulatory influence under LPS+IFN-γ, whereas NRF2 (NFE2L2) acted as a negative regulator, pointing to dynamic TF remodeling during inflammation (Extended Data Fig. 3c). These results reveal that LOAD risk variants converge on cell type-specific and inflammation-sensitive enhancers, providing reliable measurement of their regulatory effects. Our MPRA assay provides a comprehensive annotation of which LOAD-associated variants containing CREs are active across different brain regions and monocyte cell states.
Context-dependent MPRA identified regulatory LOAD variants across immune and neural contexts
Having mapped a high-confidence atlas of enhancer activity across immune and neural contexts, we next asked how LOAD variants modulate those activities. Screening 599 candidate variants with 855 pairs of constructs, we identified expression-modulating variants (emVars; FDR < 0.05) in THP-1 macrophages and HMC3 microglia under four immune states, and in vivo in the cortex, hippocampus, and striatum (Extended Data Fig. 4a, Supplementary Table 6). Of these, 104 emVars were shared between THP-1 macrophages and brain tissue; 188 were exclusive to THP-1 (not detected in brain tissue, though possibly present in HMC3); and 72 were unique to brain tissue (not detected in THP-1, though possibly present in HMC3) (Extended Data Fig. 4b). Among emVars with significant effects in both contexts, approximately 48% exhibited opposite allelic directions, reflecting distinct modes of regulatory activity across tissues. The variants’ effects displayed cell-type-specific patterns (Extended Data Fig. 4c). When aggregated across immune states or brain regions, emVars within active enhancers segregated into brain-specific, immune-specific, and nonspecific clusters (Fig. 3a), underscoring a sharp cell-type divergence in regulatory impact. Consistent with previous open chromatin partitioning (Fig. 1b), immune-specific emVars were enriched in immune CREs, brain-specific emVars preferentially resided in regions of low chromatin accessibility, and nonspecific emVars were overrepresented in ubiquitous CREs, although these trends were not statistically significant (χ2 test, p = 0.3; Extended Data Fig. 4d).
Fig. 3 |. Allele frequency, cellular context, and immune state modulate TF-motif-driven variant effects on enhancer activity.

(a) Clustering of LOAD variants with significant impacts (FDR < 0.05, MPRAnalyze comparative analysis) on active enhancers (P.MAD < 0.1, MPRA quantitative analysis). Brain-specific, immune-specific, and nonspecific effects were observed.
(b) Comparison of MPRA-derived effect sizes between rare (minor allele frequency [MAF] < 0.01) and common (MAF ≥ 0.29) variants in THP-1 macrophages and mouse brain tissue. Common variants exert stronger effects in macrophages, whereas rare variants show greater transcriptional consequences in the brain (P-value, one-tailed Mann-Whitney U test).
(c) TF motif-enrichment of the sequence context around significant expression-modulating variants (emVars) highlights distinct TF families in each cell type. Motif analysis was performed using AME (MEME Suite) to identify TF families enriched in the 25 bp sequence context surrounding MPRA-validated emVars (q < 0.05), separately for each cell type. Results are compared to motif enrichment in cell-type-specific ATAC-seq peaks from THP-1 macrophages and brain tissues (Cortex and Striatum). Similar TF family enrichment patterns were observed in both datasets, with cell-type-specific TFs identified in ATAC-seq showing comparable enrichment around MPRA-significant variants in the corresponding cell type.
(d) Comparison of CRE enhancer activities between constructs harboring single-nucleotide variants and those with shuffled motif sequences. Motif disruption causes significantly stronger transcriptional perturbations than SNVs in several key transcription factor (TF) families, including STAT, IRF, AP-1, MEF2, and SPI1 (FDR ≤ 0.05, one-tailed Wilcoxon signed-rank test). ns, not significant (FDR > 0.05)
(e) Disrupted motif contexts show directional regulatory effects: disruptions that decreased transcription mark the motif as an activator, whereas disruptions that increased transcription mark it as a repressor. Motifs such as IRF, SPI1, and STAT often correlate with increased transcriptional activity, suggesting their roles as activating factors.
(f) Variants exhibit distinct transcriptional responses under hyperinflammatory state (LPS+IFN-γ) (FDR < 0.05, MPRAnalyze comparative analysis). The Y and X axes represent the log fold change of CRE enhancer activities of the major allele versus the minor allele in LPS+IFN-γ-treated and resting THP-1 macrophages, respectively.
This divergence prompted us to investigate whether the genetic origins of LOAD variants are associated with their observed regulatory effects. Common LOAD variants identified by GWAS are enriched in microglial enhancers3–6,29,42,43,75, whereas rare variants from patient-family sequencing studies often map to neural-development and synaptic-plasticity genes32. We therefore tested the hypothesis that common variants are more likely to exert effects in immune cells, whereas rare variants have greater functional consequences in neural contexts. Consistent with this prediction, in THP-1 macrophages, common variants produced larger expression changes than rare variants, whereas in brain tissue, this pattern was reversed (Fig. 3b), with the strongest effects observed among the most common variants (MAF ≥ 0.29; Extended Data Fig. 4e). Although modest, our findings support a model where common LOAD variants primarily influence immune regulation, while rare variants more frequently modulate neural functions.
To investigate the mechanisms driving this cell-type divergence, we next examined TF-motif enrichment near emVars, comparing it directly to motif enrichment within open chromatin regions in THP-1 macrophages and brain tissue. Motifs enriched in open chromatin were also preferentially enriched near emVars within the same cellular context, with consistent representation across TF families. Brain-active emVars were predominantly associated with motifs from TF families involved in neural development and function, including TALE-type homeodomain, HOX-related, NK-related, and Fos-related families (Fig. 3c). In contrast, emVars active in THP-1 macrophages were enriched for immune-related TF families such as ETS-related, IRF, STAT, and NF-κB. Together, these analyses highlight distinct, cell-type-specific regulatory codes through which LOAD-associated variants exert their effects.
We next directly tested whether the TF-motif contexts surrounding these variants functionally modulate enhancer activities. Given that LOAD variants are often predicted to disrupt immune-related TF motifs, we analyzed a set of motif-shuffled enhancers in which a 25-bp window surrounding each variant was fully shuffled to disrupt the predicted immune-related TF-motif context, a design we refer to as motif-context shuffling. Because single-nucleotide variants typically weaken, rather than abolish, TF-binding sites, we hypothesized that complete motif ablation would elicit larger transcriptional shifts. In both THP-1 macrophages and HMC3 microglia, most motif-context shuffling events caused significant disruption of enhancer activity (FDR < 0.05, Supplementary Table 7) and produced markedly larger changes in reporter expression than single-nucleotide substitutions, with the strongest effects observed at motif contexts containing STAT, MEF2, IRF, AP-1, and SPI1 motifs (FDR < 0.05, Fig. 3d). Motif-context shuffling either increased or decreased transcription, though certain TF-motif contexts showed consistent directional biases. For example, IRF-, STAT-, and AP-1-related motif contexts preferentially decreased transcription upon disruption in THP-1 macrophages, highlighting their roles as transcriptional-activating contexts (Fig. 3e). These findings provide strong evidence that variants are associated with functionally active TF-motif contexts.
TFs involved in immune-signaling pathways, such as the interferon response, are often transiently activated; thus, variants disrupting these TF-binding sites may exert regulatory effects only under specific immune conditions. To explore this possibility, we analyzed variant effects separately in antiviral (IFN-β), M1-polarized (IFN-γ), and hyperinflammatory (LPS+IFN-γ) states in both THP-1 macrophages and HMC3 microglia. We detected significant state-specific emVars (FDR < 0.05) in all conditions except IFN-β-stimulated HMC3 cells. Under hyperinflammatory stimulation, we identified seven state-specific emVars in THP-1 macrophages and four in HMC3 cells (Fig. 3f, Supplementary Table 8). Notably, rs10838702-T (SPI1) and rs17515931-T (CLU) reduced transcription exclusively under hyperinflammatory conditions, whereas rs62427420-G (SEC63) reduced transcription only in resting cells. Several variants exhibited more complex patterns: rs73972710-T (CTDP1), rs73000577-C (UBA5), and rs636317-C (MS4A4E) increased transcription in both resting and stimulated states, but showed stronger activation upon stimulation, whereas rs549746751-A (GET3) exerted opposing effects depending on the immune state. These examples reflect regulatory scenarios in which variants disrupt TF binding that is active only in a specific state, alter the strength of binding in a state-dependent manner, or engage distinct TFs acting on the same sequence under different immune conditions.
In summary, our MPRA identifies both cell-type-specific and immune-state-specific effects of LOAD-associated variants on enhancer activity. Context-dependent disruption of regulatory activity is associated with key TF-binding motifs and with the variant’s allele frequency (common versus rare).
Deep-learning models interpret cell-type- and immune-state-specific variant effects
To interpret how LOAD genetic variants influence regulatory codes in MPRA, we trained CNN regression models on ATAC-seq data from multiple cell types, including stimulated and unstimulated THP-1 macrophages, hESC/iPSC-derived microglia, THP-1 monocytes, mouse cortex and striatum, and HEK293(T) cells. These models accurately predicted chromatin accessibility in holdout data from matched or related cell types (Spearman’s ρ ≈ 0.8), while predictions across divergent cell types yielded moderate performance (Spearman’s ρ ≈ 0.5), highlighting the cell type specificity of the regulatory codes they captured (Fig. 4a).
Fig. 4 |. Machine-learning models interpret cell-type- and state-specific regulatory effects of LOAD variants.

(a) Convolutional neural network (CNN) models are trained on ATAC-seq data from multiple immune and neuronal cell types and states to predict chromatin accessibility. These models achieve high accuracy on closely related cell types (Spearman’s ρ ≈ 0.8) and moderate performance across more divergent types (ρ ≈ 0.5), indicating context specificity.
(b) TF-MoDISco motif analysis identifies cell-type- and state-specific transcription factor (TF) motifs based on SHAP importance scores from each model’s predictions (q-value < 0.05). These motifs form combinatorial modules that collectively yield distinct regulatory signatures.
(c) Models trained in immune versus neuronal contexts differentially predict accessibility of LOAD variant-containing sequences, distinguishing immune-specific, ubiquitous, and low-accessibility regions. Predictions from different models are aggregated: macrophage/microglia models (THP-1 macrophages, iPSC-derived microglia, and hESC-derived microglia) and brain-region models (cortex and striatum).
(d) The 50 variants predicted to most strongly alter chromatin accessibility induce markedly larger transcriptional changes in MPRA than the 50 variants predicted to have minimal impact (one-tailed Wilcoxon rank-sum test).
(e) Integrating predicted accessibility and SHAP scores identifies top variants that disrupt CTCF motifs or exert immune-specific and neuron-specific effects. P-values calculated based on differences in predicted chromatin accessibility and SHAP values between major and minor alleles relative to cell-type-specific null distributions.
(f) Linear regression of allele-specific effect sizes across paired cell-type models pinpoints variants with significant cell-type-selective activity (FDR < 0.05). Two patterns emerge: (i) magnitude-shift variants exert the same directional effect in immune and neuronal cells but with different strengths, and (ii) direction-switch variants flip between activation and repression across the two lineages. emVars detected in THP-1 macrophage MPRA, brain MPRA, or both are annotated with triangles, squares, and asterisks, respectively.
(g) Linear regression of allelic effect sizes in immune-state-specific models shows variants with enhanced or diminished regulatory effects in the hyperinflammatory state (LPS+IFN-γ, FDR < 0.05).
(h) Condition-specific regulatory variants. rs73972710 (C:T) at CTDP1—the major C allele forms a repressive ZBTB-family motif that dampens transcription in resting cells, whereas the T allele disrupts the motif and lifts repression. Under hyperinflammatory conditions, chromatin opening around the major allele masks its resting-state repression, reducing allelic differences. SHAP logos visualize the motif gains and losses that drive these state-specific effects.
Using SHAP76-based importance scores and TF-MoDISco77, we show that the models learned key cell type-specific TF motifs. Immune-related motifs (SPI, C/EBP, RUNX) were enriched in macrophage and microglia models, while neural motifs (EGR, MEF2, RFX) were enriched in brain models (FDR < 0.05; Fig. 4b). Only models trained on stimulated cells learned immune state-specific motifs, with IRF, NF-κB, CREB/ATF, and BATF promoting chromatin accessibility, and ZEB reducing accessibility in interferon-treated cells. To dissect TF roles in hyperinflammatory responses, we trained a model specifically on differentially accessible chromatin regions from LPS+IFN-γ-treated THP-1 macrophages (Extended Data Fig. 5a). This model revealed NF-κB, IRF/STAT, and CTCF motifs as drivers of chromatin opening, while, surprisingly, SPI and C/EBP motifs were linked to chromatin closure (Fig. 4b). SPI1 (PU.1) was previously found to be a microglial transcriptional repressor in late-stage LOAD78 that is marked by neuroinflammation79, suggesting a potential repressive role in hyperinflammatory responses. Together, these results demonstrate that the models successfully learned distinct transcription factor codes that underlie cell type- and state-specific patterns of chromatin accessibility.
We evaluated the models on LOAD variant-containing sequences in the MPRA library and found that immune-trained models discriminated against immune CREs from low-ATAC sequences, while brain-trained models favored ubiquitous over immune CREs, reflecting distinct regulatory codes (Fig. 4c). The models recapitulated the TF motif enrichments seen in the matched ATAC-seq datasets, capturing both cell-type- and state-specific activity as well as elements inducible by LPS-plus-IFN-γ stimulation (FDR < 0.05; Extended Data Fig. 3d,e). Overall, these findings highlight that these models capture the generalizable regulatory codes, making them valuable tools for interpreting cell type- and state-specific enhancer function.
We then applied in silico mutagenesis to assess allelic effects of LOAD variants (Supplementary Table 9), facilitated by generating a null distribution from negative sequences and estimating prediction uncertainty via Monte Carlo dropout in our CNN. The models effectively distinguished variants with strong versus weak regulatory effects in MPRA assays performed in THP-1 macrophages, with a similar trend observed for brain tissue, demonstrating concordance between predictions and experimental data (Fig. 4d). By integrating predicted accessibility changes and SHAP importance scores, which were significantly correlated (Spearman’s ρ = 0.8; Extended Data Fig. 5b), the models identified variants that exhibit effects across cell types as well as variants with effects biased toward the immune or neural contexts (P < 0.1; Fig. 4e). Among the strongest outliers were rs636317 (MS4A4E) and rs755951 (PTK2B), both of which alter CTCF motifs. Immune-biased variants were identified near EPHA1, MS4A4A, BIN1, PICALM, and PTK2B, all key microglial regulators, while brain-biased hits included variants near SORL1, SNAP25, and NAPG, central to synaptic vesicle trafficking and amyloid precursor protein processing. Interestingly, some variants showed consistent directional effects across cell types, while others displayed opposing effects (Extended Data Fig. 5c). These results suggest that the models can identify significant regulatory variants that align with MPRA data and capture their context-dependent effects.
To determine cell-type-specific effects of each allele, we performed linear regression on predicted allelic differences, including cell type (immune versus neural) as a covariate to isolate context-dependent effects. This analysis highlighted two major classes of variants: (i) those with a consistent direction but stronger effects in one cell type, and (ii) those with opposite effects between immune and neural contexts (Fig. 4f, Extended Data Fig. 5d, 5e). Surprisingly, common variants in HLA-DRB1 and HLA-DQA1, typically associated with microglial function, showed stronger predicted effects in brain tissue. For example, exclusively in the neural context, the minor G allele of rs9271162 (HLA-DRB1) disrupts a TALE-type homeodomain binding site; the minor T allele of (HLA-DRB1) generates a repressive motif that reduces MEF2 binding; and the minor C allele of rs3104416 (HLA-DQA1) creates an EGR motif (Extended Data Fig. 5f). Notably, a substantial subset of these variants overlap with MPRA-validated emVars. For example, rs13025765 (BIN1), identified as an emVar in both THP-1 macrophages and brain tissue, increases accessibility in immune cells but decreases accessibility in the brain when the minor T allele is present. Together, these findings highlight the power of our models to resolve allele-specific regulatory effects with cell-type precision.
We next explored immune state-specific effects with models trained on LPS+IFN-γ-, IFN-γ-, IFN-β-treated, or resting THP-1 macrophages (Fig. 4g, Extended Data Fig. 5g). Variants with robust context-specificity were identified, such as rs13025765 (BIN1), which showed stronger effects under LPS+IFN-γ stimulation compared to the resting state, and rs189835276 (SEC63), which displayed stronger effects under all three interferon-activated conditions. Models trained on LPS+IFN-γ-responsive sequences provided mechanistic insight (Extended Data Fig. 3d). For example, the resting-state model predicted that for rs73972710 (CTDP1), the major C allele forms a repressive ZBT motif at rest, while the minor T allele disrupts this motif and increases transcription; upon stimulation, the model revealed a chromatin-opening advantage for the major allele, masking the resting-state repression and reducing allelic differences, matching MPRA findings (Fig. 4h; Fig. 3f). These examples demonstrate how the models uncover the regulatory mechanisms underlying the state-specific effects observed in experimental data.
Collectively, these findings demonstrate that LOAD risk variants exhibit dynamic, cell type- and immune state-specific regulatory effects and highlight the utility of deep learning models for predicting and interpreting variant-mediated disruptions in gene regulation.
Functional regulatory LOAD variants
By examining the overlap between MPRA data and machine-learning predictions, we found that both rare and common emVars predicted by models are distributed across THP-1 macrophages and brain tissue, forming “hotspots” where multiple variants converge within the same locus to modulate gene expression (Fig. 5a). Within a given locus, certain minor alleles enhance transcription, whereas others attenuate it, highlighting the complexity of gene regulation in these systems. Two previously uncharacterized hotspots, SEC63-OSTM1 and NELL2-DBX2, were particularly enriched for rare variants with pronounced allelic effects in both macrophages and brain tissues; variants in a NELL2 intron were active exclusively in brain tissue (Extended Data Fig. 6). The immune-associated BIN1 locus, the second-strongest genetic signal for LOAD risk3–6, also emerged among the top hits. Although the disease risk is most often attributed to the coding ε4 allele of APOE, we observed potent noncoding variant effects at the APOE-APOC1 and APOC2 loci in both neural and immune contexts. Together, these findings illustrate how multiple distinct variants within the same locus can reshape the regulatory landscapes in a context-dependent manner, providing new insights into LOAD-associated genetic mechanisms.
Fig. 5 |. Functional regulatory variants.

(a) Genome-wide map of rare, low-frequency, and common expression-modulating variants (emVars) that simultaneously perturb transcription (MPRA) and chromatin accessibility (model predictions). Spatial clustering of these dual-effect alleles marks convergent regulatory hotspots, loci harboring multiple functionally active variants. Dots are colored by the direction of the transcriptional effect (red, minor < major; blue, minor > major). Variants shown satisfy FDR < 0.05 in the MPRA allelic comparison, and |log2FC| > 0.1 and FDR < 0.01 in predicted accessibility differences.
(b) Proposed mechanistic model illustrating how genetic variants modulate transcription via multiple mechanisms. Variants can disrupt or create transcription factor (TF) motifs, alter local TF binding affinity, or influence competitive interactions among TFs, collectively shaping transcriptional output. Motif shuffling abolishes local TF binding, clarifying variant mechanisms.
(c) Criteria-based selection of functional causal variants from MPRA data, categorized by higher or lower transcriptional activity of the major allele relative to the minor allele in THP-1 macrophages, HMC3 microglia-like cells, and mouse brain. Red: variants supported by motif shuffling. Bold: variants predicted to significantly alter chromatin accessibility (FDR < 0.01, two-tailed Wilcoxon signed-rank test on Bayesian predictions using Monte Carlo dropout; logFC accessibility difference magnitude > 0.1).
Integrating multidimensional measurements of genetic variant effects, sequence-level regulatory activity, and motif context function, we synthesized a mechanistic model of regulatory variant actions (Fig. 5b). Variants can (i) destroy or create a core TF site, (ii) fine-tune the strength of adjacent TF motifs, or (iii) re-balance competition among neighboring activators and repressors; motif shuffling represents the extreme case of class (i). Guided by this framework, we prioritized candidate functional regulatory variants that met stringent criteria, including significant enhancer activity, allele-specific transcriptional differences, and, where applicable, disruption of a motif context (Fig. 5c, Supplementary Table 10). Notably, the majority of these prioritized variants also exhibited consistent predicted effects across our machine learning models.
After establishing a high-confidence set of functional regulatory variants, we examined their genomic context to identify the genes they regulate. Because the majority of candidate functional regulatory variants are located in non-promoter regions, we posited that they act through distal enhancers that physically contact target promoters. To nominate enhancer-gene pairs, we applied the Activity-By-Contact (ABC) model80 to Hi-C, H3K27ac ChIP-seq, and ATAC-seq profiles from resting and LPS+IFN-γ-stimulated THP-1 macrophages81, thereby integrating chromatin interaction frequency with enhancer activity (Supplementary Table 11). Interestingly, our analysis revealed three target genes (TAS2R60, AZGP1, PIP) associated with bitter taste sensory pathways, which were enriched among functional regulatory variants in THP-1 macrophages (Extended Data Fig. 4f).
The integrated MPRA-machine-learning framework uncovered a rich set of context-dependent functional regulatory variants and, through ABC modelling, associated each variant cluster with candidate target genes. Equipped with these genomic links, we next interrogated the mechanisms by incorporating model interpretation with CRISPR perturbations to pinpoint how specific alleles rewire transcriptional programs in immune and neural states.
Mechanistic interpretation of functional regulatory variants at BIN1, MS4A, and SEC63-OSTM1 loci
Within the functional regulatory variants that show impacts on enhancer activities, several loci stand out as multiple variants showing divergent effects (Fig. 6a). These include (i) an well-characterized BIN1 enhancer; (ii) an enhancer within the critical MS4A locus, whose gene products modulate TREM2 expression and microglial state82,83; and (iii) a newly identified enhancer overlapping a rare variant cluster at SEC63-OSTM1 locus. Here we show how these variants influence transcription via modulating TF activities differently in immune and neural contexts.
Fig. 6 |. Mechanistic interpretation of causal variants at BIN1, MS4A, and SEC63-OSTM1 loci.

(a) Selected functionally causal variants at BIN1, MS4A, and SEC63-OSTM1 loci and their regulatory effects across cell types. Cells are colored only when the allelic effect is significant within a significantly active enhancer (MPRAnalyze, FDR < 0.05, |P.MAD| > 0.1): red indicates reduced transcription from the minor allele, green indicates increased transcription. Uncolored cells reflect significant allelic effects observed in enhancers that do not meet the activity threshold.
(b) BIN1 locus. Four microglia-active variants cluster in two adjacent enhancers. In enhancer 1, rs6733839 is predicted to strengthen an SPI1 site in immune cells or create an MEF2 site in neurons, yet the minor allele T represses transcription in THP-1 macrophage MPRA, implying SPI1-induced silencing in THP-1 macrophages. Enhancer 2 contains rs13025765 and rs13025717: rs13025765 flips direction between THP-1 macrophage (repression) and brain tissue (activation), reflecting SPIB- versus RFX-driven regulation, whereas rs13025717 disrupts a SP/KLF motif, lowering both transcription and predicted chromatin accessibility in THP-1 macrophages.
(c) MS4A6E intron. An enhancer harbors three functional variants. The minor T allele of rs10897049 strengthens an ETS motif and elevates transcription in macrophages. Conversely, in brain tissue, rs4477457-A disrupts an E2F motif, lowering activity, while rs10792265-G creates an RFX site that likely competes with E2F, further repressing expression. In THP-1 macrophages, these two alleles increased transcription activity, but models did not reveal TF motif differences.
(d) SEC63/OSTM1 enhancer. Four rare variants produced distinct MPRA readouts. The minor A allele of rs147038704 strengthens an SPI1 motif in THP-1 macrophages yet suppresses transcription in both THP-1 macrophages and mouse brain. The minor T allele of rs115607757 weakens a bZIP motif in THP-1 macrophages, lowering transcription in macrophages but elevating it in the brain. The minor C allele of rs189835276 disrupts an ETS-related motif and consistently increases transcription in both cell types.
(e) CRISPR interference experiments highlight the functional enhancer from panel d. Targeting this enhancer with dCas9-KRAB in resting THP-1 macrophages leaves SEC63 and OSTM1 transcripts unchanged yet significantly up-regulates GSAP and SSH1 (DESeq2, adj. P < 0.05). In contrast, silencing the SEC63 promoter provokes a broader secondary response, also elevating GSAP.
(f) Pathway enrichment of the CRISPRi RNA-seq data (fGSEA, FDR < 0.05) reveals state-specific effects of enhancer silencing: in the resting state, it elevates complement signaling and suppresses proliferative programs (E2F, G2M checkpoint, MYC), whereas under LPS+IFN-γ stimulation, it strengthens TNFα–NF–κB, Notch, and KRAS-up signatures and further represses E2F targets.
Asterisks in panels b-d denote variants whose allelic MPRA comparison is significant at FDR < 0.05.
Brain model prediction represents the averaged SHAP values from cortex and striatum models.
Fine-mapping at BIN1 has prioritized rs6733839, an SNP within a microglia-specific enhancer near a SPI1 motif, where the minor T allele creates an MEF2 site and increases chromatin accessibility in iPSC-derived microglia, potentially elevating transcription3–6,84. Previous MPRA assays in HEK293T and THP-1 cells showed no significant allele-specific effects, though subtle upregulation was noted30,31.
Here, we comprehensively evaluated rs6733839 using context-dependent, multilayered approaches (Fig. 6b). SNP-centered MPRA constructs again showed no significant allele-specific effects in THP-1 macrophages, brain tissue, or HEK293T cells. However, peak-centered constructs with rs6733839 at the 5′ or 3′ ends unexpectedly revealed T allele-driven transcriptional repression in THP-1 macrophages and HMC3 microglia-like cells. Machine learning models predicted increased chromatin accessibility for the T allele in both macrophages and brain tissue. Interestingly, immune models suggested the T allele strengthened the nearby SPI1 motif, leading to the observed repression in immune cells, while brain models predicted gain-of-function with MEF2 motif, consistent with upregulation detected in brain MPRA constructs. Synthetic enhancer tiling and motif shuffling analyses further revealed that the motif context surrounding rs6733839 operates as a context-dependent repressor, exhibiting potential combinatorial interactions with adjacent motifs (Extended Data Fig. 7). Its repression can be masked by a potent upstream activator, resulting in an overall activating outcome; however, it can also push downstream activators toward inactivity. Combined interactions with both upstream and downstream motifs result in net repression. Collectively, these data illustrate the complexity of enhancer logic, where a single motif may exert activating or repressive functions contingent on local sequence context and the composition of bound TFs. We also characterized rs13025717, a variant in the adjacent BIN1 enhancer previously predicted to have its T allele disrupt a KLF4 motif meanwhile indirectly affecting the nearby PU.1 (SPI1) binding84,85 (Fig. 6b). In THP-1 MPRA, the T allele reduced transcription, and models predicted decreased chromatin accessibility due to KLF4 motif loss. This variant has also been reported as a BIN1 eQTL in monocytes and a SPI1 binding QTL in the B-lymphoblastoid cell line GM1287885. Another variant, rs13025765, showed opposing effects between THP-1 and brain, reflecting differential engagement of SPIB in immune cells versus RFX in neural contexts (Fig. 6b). Together, these findings reveal how multiple BIN1 enhancer variants modulate LOAD risk through distinct TF mechanisms.
In MS4A, a major open chromatin region within MS4A6E intron 1 is accessible in both microglia and neurons but becomes less accessible under LPS+IFN-γ stimulation in THP-1 macrophages (Fig. 6c). We identified variants with context-specific motif effects: the T allele of rs10897049 strengthened an ETS motif, increasing transcription in macrophages but not in brain; the minor A allele of rs4477457 disrupted an E2F motif, reducing transcription in brain but not in macrophages; and rs10792265 created an RFX motif that may compete with E2F, reducing transcription in brain but not in THP-1 macrophages. These results highlight how individual motif disruptions can drive divergent immune- and neuron-specific transcriptional outcomes.
In the SEC63-OSTM1 intergenic region, four rare variants within an enhancer showed distinct MPRA profiles: three reduced transcription alleles and one increased transcription (Fig. 6d). Notably, these variants are not in linkage-disequilibrium (LD), indicating independent effects. ML analyses suggest that the minor allele T of rs147038704 upregulates SPI1 motifs yet represses transcription, while rs115607757 G allele weakens a bZIP site, reducing macrophage transcription but increasing brain expression. The rs189835276 T allele disrupts an ETS motif, increasing macrophage transcription.
Chromatin analysis (Hi-C, ATAC-seq, H3K27ac ChIP-seq) of publicly available data81 in THP-1 macrophages reveals that this active enhancer is positioned within a chromatin loop connecting the OSTM1 promoter and a distal CTCF site at AFG1L; Hi-C data also show that the enhancer lies within a high-contact region with the SEC63 promoter (Extended Data Fig. 8 a,b). These results suggest that the enhancer has the potential to regulate both OSTM1 and SEC63 expression. Consistently, RNA-seq confirms strong expression of OSTM1 and SEC63 (Supplementary Table 12).
Functionally, SEC63 and OSTM1 are involved in ER import and lysosomal acidification, linking them to LOAD-related ER stress, lysosomal dysfunction, and APP trafficking. To clarify the enhancer’s regulatory role, we performed CRISPRi knockdowns of the enhancer as well as SEC63 and OSTM1 in THP-1 macrophages under both resting and hyperinflammatory conditions. Surprisingly, enhancer repression left SEC63 and OSTM1 unchanged but elevated the LOAD effector genes GSAP and SSH1 by ~30 % (Fig. 6e). In the resting state, the perturbation up-regulated complement genes and down-regulated proliferation pathways (G2M checkpoint, E2F and MYC targets), steering macrophages toward an M1-like state (Fig. 6f). Under LPS+IFN-γ stimulation, the same knock-down amplified TNFα–NF-κB, Notch and KRAS-up signatures and further suppressed E2F targets, reinforcing inflammatory, metabolic and pro-survival pathways. Collectively, these data indicate that the enhancer functions as a gatekeeper for innate-immune signaling. GSAP and SSH1 were also upregulated in amyloid-treated iPSC-microglia and LPS+IFN-γ-stimulated THP-1 macrophages (Supplementary Table 12), implicating their roles in inflammation. Notably, knockdown of SEC63 or OSTM1 also affected immune response pathways and cellular metabolism, with SEC63 knockdown producing broader effects, especially under inflammatory conditions, underscoring their critical roles in macrophage function (Fig. 6e, Extended Data Fig. 8c, 8d, 8e).
Together, these findings reveal how functional regulatory variants at BIN1, MS4A, and SEC63-OSTM1 modulate transcription through distinct, cell type- and context-specific mechanisms, highlighting the critical roles of enhancer architecture and TF networks in orchestrating immune and neural programs relevant to LOAD.
Discussion
GWAS and rare variant studies continue to expand the catalogue of LOAD risk variants, yet fine-mapping these loci remains challenging. In GWAS, tightly linked variants often share indistinguishable association statistics, making it hard to nominate the true causal allele within each LD block. Conversely, WGS highlights ultra-rare variants, but their effect estimates are under-powered without complementary functional evidence. Compounding these issues, LOAD pathogenesis spans multiple cell types and tissues, so variants must be interpreted in the specific cellular contexts where they exert their effects.
Our study combined context-dependent in vitro and in vivo MPRA, deep learning models, and CRISPRi perturbations to systematically map the cell type- and state-specific regulatory effects of 599 LOAD-associated noncoding variants. By examining both common and rare variants across human myeloid cell lines, brain tissue, and diverse immune states, we uncovered striking heterogeneity in functional outcomes. We found several variants exhibiting opposing effects across cell types, underscoring the importance of testing variants in disease-relevant tissue, cellular, and immune conditions. This integrated framework highlights how noncoding variation shapes distinct immune and neural regulatory programs, offering mechanistic insights into the genetic architecture of LOAD.
Although previous GWAS and epigenomic studies highlighted the enrichment of LOAD risk variants in microglial and macrophage enhancers, most functional work has focused narrowly on common variants or immune contexts, leaving rare variants and neural settings largely unexplored. Here, we systematically compare common and rare LOAD variants across immune and neural contexts using reporter assays and deep learning. We show that common variants tend to exert stronger regulatory effects in immune cells, whereas rare variants tend to affect transcription more significantly in the brain context. These findings support our hypothesis that common LOAD variants identified by GWAS and enriched in microglial enhancers3–6,29,42,43,75 are more likely to affect immune regulatory programs, whereas rare variants identified through patient-family sequencing studies—often mapped to genes involved in neural development and synaptic plasticity32—are more likely to exert their effects in a neural context. Although the rare variants we tested are frequently located in regions with low ATAC signal, their potential gain-of-function roles or activities during developmental stages—when chromatin is generally more accessible—should be considered. Additionally, during aging, cells can undergo epigenomic erosion29,86, a process in which closed chromatin becomes more accessible and active regulatory elements lose activities leading to loss of cell identity, potentially enabling these variants buried in closed chromatin to exert effects later in life. The role of rare variants remains underappreciated in LOAD research, and identifying and understanding their functional impact is only the beginning.
By integrating MPRA and machine learning interpretations, we identified regulatory “hotspots” where multiple variants converge to modulate gene expression. Mechanistically, variants disrupt or strengthen TF binding sites, fine-tune motif strength, or rebalance competition among adjacent activators and repressors. Leveraging multidimensional measurements, we nominated functional regulatory variants and link enhancers to their target genes, including an unexpected enrichment of sensory genes, implicated in early LOAD deficits, in THP-1 macrophages.
Detailed analyses of representative loci revealed mechanisms underlying cell type-specific variant effects (Fig 6, Extended Data Fig. 7). At BIN1, prior MPRA studies using SNP-centered constructs failed to detect allele-specific effects; however, by employing longer, peak-centered constructs, we uncovered a reproducible repressive effect of the rs6733839 T allele in macrophages, mediated by SPI1 rather than the previously predicted MEF2 motif. Motif tiling further revealed complex interactions between the variant’s local context and neighboring motifs. Similarly, the rs13025717-T allele in another BIN1 enhancer was previously shown to reduce transcription in HEK293T MPRAs. In our THP-1 macrophage MPRAs, we observed T allele-driven repression only in SNP-centered constructs, while peak-centered constructs showed no effect. Model predictions pointed to SP/KLF motif disruption in immune, but not neural, contexts. These findings, along with the results of Ernst et al.45 and Klein et al.73, highlight how variant positioning and CRE length critically influence the detection and interpretation of regulatory effects, underscoring the need for diverse MPRA designs to capture motif interactions.
In parallel with the recent work of Bond et al.31, we examined variant effects under immune stimulation. We showed that LPS+IFN-γ, which mimics the hyperinflammatory state relevant to LOAD, elicited the most pronounced chromatin remodeling (ATAC-seq) and enhancer-activity shifts (MPRA) in THP-1 macrophages. Notably, at the resting THP-1 macrophages, rs73972710 (CTDP1), the major C allele forms a repressive ZBT motif at rest, whereas the minor T allele disrupts this motif and elevates transcription; upon LPS+IFN-γ stimulation, the major allele gains higher motif scores that mask the resting-state repression and reduces allelic differences, a pattern captured by both our models and MPRA readouts (Fig. 3f, 4h). Beyond CTDP1, several variants at other LOAD risk loci—including the immune-regulatory MS4A cluster, which multiple fine-mapping studies have implicated in disease susceptibility27,28,30,85,87—showed comparable allele-by-stimulation interactions, further underscoring the importance of assaying variants in disease-relevant cellular states. These cases, along with our immune-state profiling of macrophages demonstrate that the magnitude of LOAD-associated variant effects is dynamically tuned by cellular states, such as the inflammatory states implicated in the disease. Context dependence therefore extends beyond cell-type specificity to a temporal dimension in which immune activation scales variant impact. Evaluating candidate variants within disease-relevant immune milieus is thus essential for revealing their full pathogenic potential.
At the SEC63-OSTM1 intergenic enhancer, we identified four functional regulatory rare variants with independent, allele-specific transcriptional effects in THP-1 macrophages mediated through immune motifs. Although Hi-C analysis implicated enhancer interactions with the nearby genes SEC63 and OSTM1, CRISPRi-mediated enhancer perturbation unexpectedly increased expression of distant LOAD effector genes, notably GSAP and SSH1, while enhancing pro-inflammatory signaling pathways without altering SEC63 or OSTM1 transcript levels. γ-Secretase activating protein (GSAP) promotes amyloid-β production via interactions with the γ-secretase complex and amyloid precursor protein (APP)88, whereas Slingshot-1 (SSH1), an actin phosphatase, attenuates Nrf2-mediated antioxidant responses, with its loss ameliorating Aβ and tau pathology89. Thus, increased expression of GSAP and SSH1 likely exacerbates complementary pathogenic mechanisms in LOAD—amyloid deposition and oxidative stress—indicating the enhancer typically serves as a suppressor of these detrimental pathways. Remarkably, although GSAP and SSH1 reside on chromosomes distinct from the enhancer, both genes exhibited altered expression following enhancer perturbation and were upregulated in the inflammatory macrophages, likely reflecting secondary consequences of enhanced innate immune activation. These findings highlight a notable instance wherein distal noncoding regulatory elements modulate LOAD-associated networks through non-canonical or higher-order interactions, linking noncoding genetic variation to amyloidogenesis, oxidative stress, and neuroinflammation.
These mechanistic insights were enabled by several technical advances that improved both the sensitivity and resolution of our measurements. Transcriptomic and epigenomic profiling of cytokine-stimulated THP-1 macrophages ensured that variant effects were assayed in immune states relevant to LOAD pathophysiology. We optimized electroporation-based delivery of MPRA libraries into THP-1 cells, which are typically challenging to transfect, enabling reproducible detection of stimulus-responsive enhancer activities. Building on previous work by Brown et al.49, which demonstrated systemic AAV-mediated MPRA delivery across the blood-brain barrier (sysMPRA), we achieved increased reproducibility and larger library sizes using pseudo-barcoding strategies that aggregate barcodes with similar representation to establish robust expression estimates across individual animals. In parallel, we adapted convolutional neural networks from Ramamurthy et al.27 to predict chromatin accessibility using 500 bp sequences, achieving consistent performance across cell types and datasets, including those generated in different laboratories. To quantify machine learning-predicted variant effects with confidence, we applied both cell-type-matched null distributions and dropout-based uncertainty estimation. Together, these innovations enabled high-confidence, context-specific dissection of noncoding variant function at scale, laying the foundation for systematic interpretation of regulatory architecture in LOAD.
Several limitations warrant mention. THP-1 and HMC3 cells, while experimentally tractable, are surrogates for primary human microglia and macrophages and do not fully capture the complexity of the brain immune milieu. Although we have previously demonstrated an overall conservation of the ‘regulatory code’ between rodent and primate90,91, our in vivo MPRAs in mice may introduce cross-species regulatory differences. Moreover, synthetic CREs, though powerful, may overlook contributions from long-range chromatin contacts, topological features, or promoter-like elements. We also note that some variants, such as rs563571689 at the last nucleotide of APOE exon 1, are predicted to alter splicing without affecting MPRA output, highlighting the importance of complementary assays to capture the full regulatory landscape. While we identified variants with effects specific to brain tissue rather than immune cells, we lacked the statistical power to resolve region-specific effects within the brain. Furthermore, variants with cell type-restricted regulatory functions may be masked in bulk-tissue MPRAs due to their limited representation in the sampled population. Continued method development is needed to achieve single-cell resolution within the native tissue context. Emerging droplet-based single-cell92,93 and spatially resolved62 MPRA platforms offer a promising path to pinpoint subtle, context-specific effects, such as those acting in neural subtypes or immune activation states not represented in our current in vitro systems.
Our findings open key avenues for future research, including systematic enhancer-gene mapping, investigation of variant effects in motif-motif interactions, functional studies of hotspot genes, and defining the cellular states where variants become active to guide therapeutic strategies. Together, these efforts will deepen our understanding of noncoding genetic risks and advance the development of precision therapies for LOAD.
Methods
Cell Culture and Animals
THP-1 Macrophage Differentiation
THP-1 monocytes (ATCC TIB-202) were cultured in RPMI-1640 supplemented with 10% fetal bovine serum (FBS) at 37°C in 5% CO₂, with a density of under 1 million cells/mL. Differentiation into macrophages was induced by treating cells with 100 nM phorbol 12-myristate 13-acetate (PMA, Sigma-Aldrich) for 72 h, followed by a 24 h resting period in PMA-free medium.
HMC3 Microglia-like Cell Culture
HMC3 microglia-like cells (ATCC CRL-3304) were cultured in Microglial Cell Medium Kit (Accegen, ABI-TM009) and maintained at 37°C with 5% CO₂. Cells were passaged before reaching confluence and seeded at appropriate densities for downstream assays.
HEK293T Cell Culture
HEK293T cells (AAVpro(R), Clontech, Cat. No. 632273) were cultured in Dulbecco’s Modified Eagle Medium (DMEM) supplemented with 10% fetal bovine serum (FBS) and maintained at 37°C with 5% CO₂. Cells were passaged into fresh medium before reaching confluence and seeded at appropriate densities for downstream assays.
Stimulation of THP-1 Macrophages and HMC3 Microglia
To model diverse immune states, THP-1 macrophages were stimulated for 4 h and HMC3 microglia for 24 h with interferon-β (IFN-β, 20 ng/mL; R&D Systems), interferon-γ (IFN-γ, 20 ng/mL; PeproTech), or lipopolysaccharide (LPS, 100 ng/mL; InvivoGen) plus IFN-γ (20 ng/mL) to induce antiviral, M1-like, and hyperinflammatory states, respectively. For ATAC-seq characterization of THP-1 macrophages, THP-1 macrophages were additionally stimulated for 24 h to assess longer-term transcriptional and chromatin accessibility changes. Stimulated cells were harvested for RNA-seq, ATAC-seq, and MPRA assays.
Animals
All procedures were approved by the Carnegie Mellon University Institutional Animal Care and Use Committee (IACUC). Experiments were conducted on 10-week-old C57BL/6J mice (Jackson Laboratory, strain 000664; n = 4, 2 males and 2 females). Animals were housed under specific-pathogen-free conditions in individually ventilated cages (≤ 5 mice per cage) containing corncob bedding and nestlet enrichment. The animal room was maintained at 20–22 °C with 45 % relative humidity and a 12 h:12 h light-dark cycle. Autoclaved standard chow (LabDiet 5001) and UV-irradiated water were provided ad libitum. Detailed surgical procedures are described in the section ‘Plasmid Library Transduction of Mouse Brain Regions via AAV Viruses’.
ATAC-seq Experiments
Cell Preparation and Lysis
THP-1 monocytes were centrifuged and pelleted, lysed using pre-chilled Buenrostro lysis buffer94, homogenized with a Dounce homogenizer on ice, and then debris was removed by filtration through a 70 μm mesh. Similarly, THP-1-derived macrophages, adhered to 6-well plates, were lysed with pre-chilled Buenrostro lysis buffer on ice for 10 minutes. Nuclei were dislodged using cell scrapers, filtered through a 70 μm mesh, and pelleted by centrifugation at 500 xg for 5 minutes at 4°C.
Nuclei Isolation and DNA Tagmentation
Isolated nuclei were resuspended in nuclease-free water. DAPI-stained nuclei were quantified to approximately 50,000 using a Countess II cell counter (Thermo Fisher Scientific). These nuclei underwent DNA tagmentation using the Illumina Tagment DNA TDE1 Enzyme and Buffer Kits, incubated at 37°C with shaking at 300 rpm for 30 minutes.
Library Preparation and Amplification
Tagmented DNA was purified using the Qiagen MinElute PCR Purification Kit. The sequencing library was then prepared using NEBNext High-Fidelity PCR Master Mix and primers (Eurofins Genomics) following the Illumina Nextera tagmentation format as previously published95, with the optimal number of amplification cycles determined via qPCR side reactions to be an average of 9 cycles. Final PCR products were purified using the NEB Monarch Nucleic Acid Purification Kit (# T1030).
ATAC-seq Library Sequencing
MPRA sequencing libraries were pooled and sequenced on the Illumina NovaSeq™ 6000 platform at GENEWIZ from Azenta Life Sciences using paired-end 150 bp reads. The libraries achieved an average sequencing depth of 68 million reads per sample.
ATAC-Seq Data Processing
FASTQ files were processed using the ENCODE ATAC-Seq Pipeline. Paired-end sequencing reads from biological replicates in fastq format were analyzed with the pipeline’s default settings. The Irreproducible Discovery Rate (IDR) optimal peaks, derived from these analyses, were utilized for both differential analyses and machine learning model training.
Differential Analysis of THP-1 Macrophages upon Stimulation
Common open chromatin regions were identified by merging IDR optimal peaks from both resting and stimulated THP-1 macrophages within a 200 bp proximity. This merging was performed using the bedtools suite with the command: bedtools sort −i {input} | bedtools merge −d 200 −i − > {output}. Read counts at each peak for each cell type were quantified using the featureCounts function from the Rsubread package, utilizing the bam files and bed files of common chromatin peaks. Differential accessibility analysis was executed using the DESeq296 package, with filtering criteria set to include peaks that had at least one read in a minimum of two replicates. Peaks with significantly different accessibility were determined using a false discovery rate (FDR) threshold of <0.05. Differentially accessible promoter regions were annotated using the hg38 human genome assembly, focusing on known genes within a 500 bp range of the identified open chromatin regions.
Variants Enrichment Analysis: stratified LD Score Regression (S-LDSC)
To pinpoint cell types enriched for LOAD risk, we applied stratified LD score regression (S-LDSC)97 on open chromatin data from various sources. We obtained open chromatin promoter, enhancer and dyadic peaks for 111 reference epigenomes from the Epigenome Roadmap database36. These peaks were merged using bedtools98 and treated as background peaks. Following the original S-LDSC methodology, testing LOAD variants in enrichment in the open chromatin peak of the candidate cell type relative to the Roadmap background. Enrichment p-values were then adjusted across all tests using the Benjamini-Hochberg FDR correction, with enriched cell types defined by a q-value below 0.05. This analysis was performed separately for using different GWAS summary statistics3–6.
RNA-seq Experiments
RNA-seq library preparation and sequencing
Total RNA was isolated with the RNeasy Mini Kit (Qiagen) and RNA integrity was verified on an Agilent 4200 TapeStation. For THP-1 characterization, three biological replicate batches of THP-1 macrophages (± stimulation) and THP-1 monocytes were processed for unstranded poly(A)+ RNA-seq. For CRISPRi samples, total RNA was harvested 4 h after ±stimulation; two biological replicate batches were prepared for (i) poly(A)+ stranded RNA-seq and (ii) rRNA-depleted stranded RNA-seq. All libraries were sequenced by GENEWIZ from Azenta Life Sciences (paired-end 2 × 150 bp).
Poly(A)+ libraries
Total RNA (500 ng per sample) was quantified on a Qubit 2.0 Fluorometer (Thermo Fisher Scientific) and integrity assessed on a 4200 TapeStation (Agilent). External RNA Controls Consortium spike-ins (ERCC Mix 1, Thermo Fisher Scientific, cat. 4456740) were added to the normalized RNA before library construction.
Strand-specific libraries.
Polyadenylated RNA was enriched and strand-specific libraries were prepared with the NEBNext Ultra II Directional RNA Library Prep Kit for Illumina (New England Biolabs) according to the manufacturer’s guidelines. mRNA was fragmented for 8 min at 94 °C, first-strand cDNA was synthesized, and dUTP was incorporated during second-strand synthesis. After end repair/A-tailing, indexed adapters were ligated and libraries were amplified by limited-cycle PCR.
Unstranded libraries.
RNA-seq libraries lacking strand information were generated with the NEBNext Ultra II RNA Library Prep Kit for Illumina (New England Biolabs). Poly(A)+ RNA was captured with Oligo(dT) beads and fragmented for 15 min at 94 °C, followed by first- and second-strand cDNA synthesis. Subsequent end repair/A-tailing, adapter ligation, and limited-cycle PCR amplification mirrored the strand-specific workflow.
Library size profiles were confirmed on the TapeStation, and concentrations were determined by Qubit and KAPA Library Quantification qPCR. Equimolar pools were sequenced on an Illumina NovaSeq 6000 in paired-end mode (2 × 150 bp), targeting ~30 million read pairs per sample.
rRNA-depleted libraries
Total RNA (500 ng) was treated with TURBO DNase (Thermo Fisher Scientific) and rRNA removed using the QIAseq FastSelect-rRNA HMR Kit (Qiagen). Strand-specific libraries were prepared with the same NEBNext Ultra II kit. rRNA-depleted RNA was fragmented for 8 min at 94 °C, followed by first- and dUTP-labelled second-strand synthesis, 3′ adenylation, adapter ligation and limited-cycle PCR (second-strand amplification suppressed by dUTP). Library size was verified on the TapeStation and quantified by Qubit 4.0 and KAPA qPCR. Equimolar pools were clustered on an Illumina NovaSeq X and sequenced in paired-end mode (2 × 150 bp).
RNA-seq Data Processing
Raw paired-end reads were trimmed of adapter sequences and quality-checked using FastQC99. Reads were then aligned to the human reference genome (Ensembl GRCh38) using STAR100. Gene-level counts were obtained with featureCounts (Subread package) using ‘--largestOverlap -s 0’ parameters for unstranded RNA-seq and using ‘--largestOverlap -s 2’ for stranded RNA-seq. The resulting count matrices were imported into R, filtered to remove low-expressed genes, and analyzed with DESeq296, adjusting for batch effects where applicable. lfcShrink using Approximate posterior estimation for GLM coefficients (apeglm)101 was used to shrink log2 (fold change) for genes with low read counts. Independent Hypothesis Weighting (IHW)102 was used for multiple testing corrections. Gene annotations were retrieved via biomaRt to map Ensembl gene IDs to standard gene symbols.
Gene Set Enrichment Analysis (GSEA)
Hallmark gene sets were obtained from the msigdbr package by filtering for “H” category (Hallmark). Genes were ranked based on a statistical measure derived from their differential expression results ‘unshrunk log2FoldChange / lfcSE’. After removing duplicates and low-confidence entries, fgsea was performed on the ranked list, examining Hallmark pathways of size 15–500 genes. Significant pathways (adjusted p < 0.05) were visualized in bar plots of Normalized Enrichment Scores.
Microglia-state concordance
Marker sets for 12 human microglial states and the gene list differentially expressed in amyloid-fibril-treated iPSC microglia were downloaded from Sun et al.25. For each THP-1 state or CRISPR-i perturbation, gene-level log₂-fold-changes (log₂FC) were calculated versus matched controls. Distributions of marker-gene log₂FCs were compared with the non-marker background using two-sided Mann-Whitney U tests; Benjamini-Hochberg correction was applied, and terms with q < 0.05 were deemed significant.
MPRA Plasmid Library Design
Prioritization of late-onset Alzheimer’s disease (LOAD) Genetic Variants
To prioritize LOAD-associated variants for evaluation with both machine learning models and reporter assays, we first assembled a collection of sentinel LOAD GWAS variants from Jansen et al.4 and Kunkle et al.6 that met a significance threshold of 5×10^−8. We then broadened this collection by including variants in linkage disequilibrium with the sentinel variants, using HaploReg (v4.1)103, which leverages data from the 1000 Genomes Project104. Applying an LD r2 threshold of 0.5 resulted in an expanded set of 1,209 variants. Additionally, we gathered variants from the Cure Alzheimer CIRCUITS consortium, including those from fine-mapping studies29 and patient family studies32. The complete set of LOAD genetic variants was subsequently overlapped with open chromatin datasets from immune and neural cells (as shown in Fig. 1b). R package annotatr105 was used to generate genomic annotations for variants. Finally, LOAD GWAS and fine-mapping variants were filtered to retain those within 113 bp of open chromatin peak summits, while all variants from patient family studies were preserved.
Design of cis-regulatory elements (CREs)
A total of 599 unique common and rare variants from LOAD GWAS and WGS were incorporated into 227 base pair synthetic CREs. Variants overlapping open chromatin peak summits in microglia and monocytes, which represent regions most likely to serve as TF binding sites, were prioritized. When a variant overlapped a peak in immune cells or neurons, the summit served as the center of the enhancer. For variants not overlapping open chromatin peaks, SNP-centered enhancers were designed. Additional constructs were generated for variants positioned distal (83 bp) to peak summits and for those with multiple alternate alleles. In addition, 25 base pair motif-shuffled versions of the CREs were produced as positive controls to disrupt TF binding, particularly for variants predicted to affect immune- and neuron-related factors in haploR52,106 (MEF2, SPI1, IRF, STAT, NF-κB, AP-1).
MPRA Experiments
Plasmid Library Assembly
A pool of 24,000 unique 300-nt oligonucleotides (Twist Bioscience, San Francisco, CA, USA) was PCR-amplified (12 cycles; 66 °C annealing) with KAPA HiFi HotStart Polymerase (Roche) using primer (5′-GGCTACCGTCTCACATGGAGTCTGAACCTGTGTGCTA-3′) and primer (5′-GGCTACCGTCTCGACCACTACGATGCTCTTCCGATCT-3′). Amplicons were verified on a D1000 ScreenTape system (Agilent) and purified with the Monarch PCR & DNA Cleanup Kit (NEB).
The MPRA backbone (pAAV-Hsp68-nls/mCherry-MPRAe) was linearized by PCR (35 cycles; 72 °C annealing) with Q5 High-Fidelity DNA Polymerase (NEB) using primer (5′-GGCTACCGTCTCCCATGTTTCTCCATTTGGCGC-3′) and primer (5′-GGCTACCGTCTCGTGGTACTTAGCATCTCAC-3′). The product was gel-separated and extracted with the Monarch Gel Extraction Kit (NEB).
Purified insert and the linearized vector were assembled at a 2:1 molar ratio using the NEB Golden Gate Assembly Kit (BsmBI-v2) under the following thermal program: 42 °C for 1 h, 60 °C for 5 min, then 4 °C hold. 4 uL of the assembly reaction was electroporated into 100 μL of ElectroMAX 10-beta T1 E. coli (Thermo Fisher Scientific). Transformants were expanded in 3 L Terrific Broth at 37 °C, and plasmid DNA was purified with the QIAGEN Plasmid Plus Giga Kit.
Plasmid Library Transfection of Stimulated THP-1 Macrophages
On the day of transfection, the culture supernatant was collected for later use. The cells were detached from the dish with Invitrogen Accumax at 37 °C for 30 min. Transfection was performed using the Nucleofection P3 Primary Cell 4D-Nucleofector kit (Lonza Bioscience). In each electroporation, 2 μg of the MPRA plasmid library was used to transfect 3 million THP-1 macrophages. Cells from five electroporations were pooled and seeded in 6-well plates, then incubated at 37 °C for 1 hour to allow attachment. Next, the medium containing the nucleofection reagent was replaced with the previously collected supernatant, and interferons were added. 4 hours post-electroporation, cells were lysed directly in the wells, and lysates were snap-frozen and stored at −80 °C for RNA extraction. A replicate of each condition was scraped from the plates, snap-frozen in a separate tube, and stored at −80 °C for genomic DNA extraction.
Plasmid Library Transfection of THP-1 Monocytes
THP-1 monocytes in suspension were pelleted by centrifugation at 300 × g for 5 min. Transfection was conducted using a LONZA Nucleofector 4D device with the SG Cell Line 4D-Nucleofector kit. In each electroporation, 1.5 μg of the MPRA plasmid library was used to transfect 3 million THP-1 monocytes. 4 hours post-electroporation, the cells were pelleted, washed with DPBS, and lysed. The resulting lysates were snap-frozen and stored at −80 °C. In parallel, a portion of each cell pellet was snap-frozen in a separate tube for genomic DNA extraction.
Plasmid Library Transfection of HMC3 Microglia and HEK293T Cells
3 million HMC3 or HEK293T cells were seeded in 100 mm dishes 24 hours before transfection. For each dish, 18 μg of the MPRA plasmid library was transfected using 54 μL of Promega FuGene 6. At 24 hours post-transfection, HEK293T cells were washed with DPBS and lysed in the dish for total RNA extraction, and HMC3 cells were treated with interferons. 24 hours after interferon treatment, HMC3 cells were washed with DPBS and lysed in the dish for total RNA extraction. Immediately before cell lysis, 25% of each sample was scraped from the plate, snap-frozen in a tube, and stored at −80 °C for genomic DNA extraction.
Plasmid Library Transduction of Mouse Brain Regions via AAV Viruses
The plasmid pool was packaged into adeno-associated virus PHP.eB (AAV-PHP.eB) following Brown et al.49. Adult C57BL/6J mice (n = 4; two males, two females; 10 weeks old) were anesthetized with 3–4 % isoflurane in oxygen until respiration slowed and the pedal-withdrawal reflex was lost. Each mouse was maintained in 1–2% isoflurane and received two retro-orbital injections of 2 × 10^12 vector genomes (vg) in 85 μl phosphate-buffered saline (PBS), administered 48 h apart. Immediately after each injection, 0.5 % proparacaine hydrochloride ophthalmic solution was applied to the treated eye for comfort, and the animals were monitored continuously for signs of pain or distress.
4 weeks after the second injection, mice were deeply re-anesthetized with isoflurane to the point of absent reflexes and euthanized by decapitation in compliance with institutional guidelines. The cortex, hippocampus and striatum were rapidly micro-dissected from 300 μm coronal brain sections on an ice-chilled stage and snap-frozen on a −80 °C cooling block for subsequent extraction of total RNA and genomic DNA.
cDNA MPRA Sequencing Library Preparation
cDNA libraries were prepared according to the sysMPRA49 protocol. Cell pellets or frozen tissues were used to extract total RNA following the standard protocol of the Qiagen RNeasy kit, including on-column DNase digestion. The resulting RNA samples were further treated with Invitrogen TURBO DNase to remove residual genomic DNA, followed by a cleanup step using the Qiagen MinElute kit. First-strand cDNA was synthesized using Invitrogen SuperScript IV reverse transcriptase and a customized plasmid-sequence-specific primer. MPRA sequencing libraries were then prepared by PCR amplification (26 cycles) with NEBNext High-Fidelity 2X PCR Master Mix and Nextera primers. The PCR products were purified with the NEB Monarch Nucleic Acid Purification kit, quantified using Qubit, and assessed for purity on a TapeStation.
Genomic DNA MPRA Sequencing Library Preparation
Genomic DNA was extracted from cell pellets or frozen tissues using the Qiagen DNeasy Blood & Tissue Kit. MPRA sequencing libraries were then generated by PCR amplification (26 cycles) with NEBNext High-Fidelity 2X PCR Master Mix and the same plasmid-sequence-specific primers from Brown et al.49. For cell-derived samples, 20 ng of genomic DNA was used as the template; for brain tissue, 200 ng of genomic DNA was used. The PCR products were purified using the NEB Monarch Nucleic Acid Purification kit, quantified by Qubit, and evaluated on a TapeStation for product purity.
MPRA Library Sequencing
MPRA sequencing libraries were pooled with ATAC-seq libraries to increase library diversity and sequenced on the Illumina NovaSeq™ 6000 platform at GENEWIZ from Azenta Life Sciences using paired-end 150 bp reads. The cDNA libraries achieved an average sequencing depth of 16 million reads per sample, while the genomic DNA (gDNA) libraries received an average of 4 million reads per sample.
MPRA Data Analysis
Read Mapping and Preprocessing
The paired-end sequencing reads of the cDNA and DNA prepared from each sample were mapped to generate a read count matrix according to both 10 bp sequences at 5’ end and 3’ end of the enhancer and the 8 bp barcodes associated with each enhancer. 21 enhancers that have barcode read counts underrepresented in the DNA read count matrix were filtered out in the analysis. The read count matrix was transformed into an enhancer table and allele table. The enhancer table contains one unique enhancer per row and individual barcode counts for each sample in separate columns. The allele table has each ALT-allele:REF-allele comparison or MOTIFDISRUPT:REF allele comparison in each row and barcodes unique to each allele in a specific sample in each column.
Pseudo-barcodes for Sparse Data
The read count matrices generated from brain tissue and THP-1 monocytes were found to be more sparse than other cell models, which introduces noise to quantification. We transformed the sparse matrices to dense matrices by merging the read counts of similarly represented barcodes into pseudo-barcodes. The barcode read count matrices of brain tissue samples and THP-1 monocytes were transformed to create pseudo-barcodes. First, we sorted 15 barcodes of each enhancer according to the sum of read counts across brain tissue or THP-1 monocytes, and then summed the read counts of every three barcodes in the sorted order to generate five pseudo-barcodes for each enhancer. Pseudo-barcodes showed an improved DNA correlation (Spearman correlation around 0.75) between biological replicates and between sparse data and dense data. The enhancer table and allele table of pseudo-barcodes were used to analyze the mouse brain tissue and THP-1 monocyte, and the original barcodes were used for other cell types.
Quantification of Enhancer Activities
We used the quantitative analysis function of MPRAnalyze107 to estimate transcriptional activity for each candidate regulatory element (CRE), leveraging the paired cDNA and DNA read counts from 15 barcodes pre-designed for each CRE. For each cell type, we applied the regression design dnaDesign = ~Barcode + Replicate, rnaDesign = ~1. To harmonize enhancer activity measurements across in vitro and in vivo models, we employed a conservative median absolute deviation (MAD)-based score (P.MAD.Score < 0.05, one- and two-tailed) to identify significantly active enhancers in each context. For visualization of specific examples, we computed per-replicate transcriptional activities for each CRE.
Quantification of Allelic Differences and Motif Disruption
To compare transcriptional differences attributable to allelic variants and motif shuffling, we used the comparative analysis function of MPRAnalyze107 with at least 4 biological replicates per condition. In these analyses, we compared constructs harboring the CRE with the major versus minor allele, as well as constructs in which the motif was shuffled. The regression design was specified as dnaDesign = ~Barcode + Replicate, rnaDesign = ~Allele, reducedDesign = ~1.
To examine the effect of interferon stimulation on allelic differences, we used the design dnaDesign = ~Barcode + Replicate, rnaDesign = ~Allele + Stimulation + Allele:Stimulation, reducedDesign = ~Allele + Stimulation. For aggregated analyses across stimulated THP-1 macrophages, HMC3 microglia, and mouse brain regions, we included an additional covariate “Condition” in both the rnaDesign and reducedDesign to account for the different conditions.
Motif-based prediction of enhancer activity
MPRA sequences were scanned with FIMO v5.5.5 (MEME-Suite; http://meme-suite.org) against the HOCOMOCO v12 CORE motif library using a threshold of P < 1 × 10^−4. For each enhancer, hits sharing the same HOCOMOCO accession (for example, MA0139) were merged by averaging log-likelihood scores, yielding a motif-by-enhancer score matrix.
Condition-specific enhancer activities (MAD Scores) from THP-1 macrophages (Resting, LPS+IFN-γ) and mouse brain tissue were joined to the motif matrix on enhancer ID; absent motifs were set to zero.
To identify motifs associated with activity, we fitted an Elastic Net model to each condition. Motif scores were z-standardized, and ElasticNetCV from scikit-learn v1.4.0 (https://scikit-learn.org) was run with the default l₁ ratio of 0.5 and the package’s built-in grid of 100 logarithmically spaced α values (five-fold cross-validation, max_iter = 10⁵, random_state = 0). After selecting the best hyper-parameters, we refitted the model once and estimated the significance of the in-sample R2 by permuting the response vector 1,000 times; the empirical P-value equals the fraction of permuted R2 values greater than or equal to the observed R2. Model fit was reported as R2 and its permutation-based P. Non-zero coefficients were retained for downstream interpretation.
Motif-enrichment analysis
For each cell type we extracted 25-bp sequences centred on MPRA-validated expression-modulating variants (emVars). Motif enrichment was assessed with AME v5.5.6 (MEME-Suite) using the HOCOMOCO v12 core mouse–human TF motif collection. Enrichment was calculated with the Wilcoxon rank-sum test (--method ranksum) and average log-odds scoring (--scoring avg); only the top 25 % of motif hits in the target set were considered (--hit-lo-fraction 0.25). The THP-1 emVar sequences served as the control set for brain emVars (and vice-versa) via the --control option. Motifs with an E-value < 10 and Benjamini-Hochberg–adjusted q < 0.05 were deemed significantly enriched.
Machine Learning Model Training and Prediction
Data Preprocessing for Machine Learning
NarrowPeak files of IDR optimal peaks of each cell type were expanded to a uniform width of 500 bp centered on the peak summit. Peak intensities were directly extracted from column 7 of the NarrowPeak files. To create a balanced dataset for machine learning, genomic mononucleotide distribution-matched negative sequences were generated using BiasAway with the command: biasaway g --foreground {foreground} --nfold 1 --bgdirectory {background} --seed 19951124. Each positive sequence was paired with a GC-content matched negative sequence, ensuring no overlap with positive sequences. Signal values for negative sequences were set to zero. The dataset comprising both positive and negative sequences was then partitioned into training, validation, and test sets based on genomic location, assigning sequences from chromosome 4 to the validation set and sequences from chromosomes 8 and 9 to the test set.
Convolutional Neural Network Training
DNA sequences were one-hot encoded into 4×500 matrices and processed using Tensorflow v2.7. The architecture of the neural network comprised sequential layers: “Input, Conv1D, Dropout, Conv1D, Dropout, MaxPooling1D, Flatten, Dense, Dropout, Dense, Dropout, Dense, and Output”. The hyperparameters used are listed in the Supplementary Table 13.
Predicting Chromatin Accessibility Using Machine Learning Models
Candidate sequences, derived from open chromatin peaks, were standardized to 500 bp centered on the peak summit. Peaks from differential analyses were either expanded or trimmed to 500 bp, centered on their middle point. Both forward and reverse complementary sequences of each input were one-hot encoded into 4×500 matrices. These matrices were then fed into the trained convolutional neural network. The model computed the predicted signal value for each input by averaging the peak signals of the forward and reverse complementary sequences.
Model Interpretation
To interpret model predictions at base-pair resolution, we employed SHapley Additive exPlanations (SHAP)76 on both validation datasets and genomic sequences with genetic variants. The SHAP values were input in TF-MODISCO-Lite77 and match TF motifs in the HOCOMOCO V12 Core motif database. The enriched motifs with q value > 0.05 were reported.
Allelic-specific Differences in Predicted ATAC Accessibility and SHAP Contribution Scores
For each candidate variant, we extracted paired 500-bp genomic sequences centered on the variant position, differing solely at the major- or minor-allele nucleotide. Each allele-specific sequence was evaluated using the trained model in both forward and reverse-complement orientations. Strand-specific predictions were averaged to yield a single ATAC-seq accessibility score per allele, and the allelic effect was quantified as the difference between major- and minor-allele scores.
For each allele, we calculated the SHAP contribution score of each nucleotide across the 500-bp region and derived an allelic SHAP contrast by computing the major-minus-minor difference.
To establish a baseline null distribution, we selected GC-matched control sequences from non-peak genomic regions within a held-out validation set, ensuring the central nucleotide matched the major allele of the query candidate variant. We then mutate the central nucleotide to the minor allele nucleotide of the query variant. Differences in predicted accessibility and SHAP scores between these control sequence pairs defined the null distributions, reflecting expected variability in non-functional regions. All differences underwent log10 transformation. The transformed null distributions displayed substantial overlap, whereas candidate SNPs exhibited a marked rightward shift suggestive of functional relevance. Null distributions were modeled using a normal distribution, enabling computation of variant-specific P values. Variants exhibiting P values < 0.1 were prioritized and visualized using a heat map.
Estimating Prediction Uncertainty
To quantify predictive uncertainty, we adopted Monte-Carlo dropout. Specifically, we re-enabled all Dropout layers in the trained CNN and drew 64 stochastic forward passes per input, using 0.3 dropout rate to approximate sampling from the model’s posterior. The resulting ensemble of outputs was summarized by the mean prediction as well as its standard deviation, skewness, and kurtosis, providing a principled estimate of both aleatoric and epistemic uncertainty. To quantify the statistical confidence of allele-specific differences in predicted ATAC accessibility, we performed two-sided Wilcoxon signed-rank tests on the 64 Monte-Carlo dropout replicates per allele and controlled the false-discovery rate with Benjamini–Hochberg correction.
CRISPR Interference Experiments
Plasmid Cloning
We constructed a dCas9-KRAB-MeCP2 plasmid by fusing the bipartite dCas9 repressor (Addgene: 122205) with a third-generation lentiviral backbone (Addgene: 83889). Fragments were PCR-amplified using NEB Q5 High-Fidelity DNA Polymerase and assembled with the NEBuilder HiFi DNA Assembly kit. sgRNA oligonucleotides, synthesized by Eurofins Genomics, were annealed via a thermal cycler and ligated into the direct-capture Perturb-seq sgRNA backbone (Addgene: pBA904), pre-digested with Thermo FastDigest Restriction Enzymes (BstXI and Bpull02I), using NEB T4 DNA Ligase. Assembled plasmids were amplified in NEB 5-alpha competent E. coli and purified with the QIAprep Spin Mini Plasmid Prep kit.
Guide RNA Design
sgRNA spacers, designed to initiate with “G” to optimize mouse U6 promoter activity, targeted the promoters of SEC63, OSTM1, and the enhancer of interest using CRISPick (Broad Institute). Two safe-targeting and one non-targeting sgRNAs were selected from published sources108,109. All sgRNA sequences are provided in the Supplementary Table 14.
Lentivirus Production
HIV-based lentiviral particles were produced by transfecting 0.75 × 10^6 HEK293T cells in 2.5 mL DMEM with a total of 3 μg of lentiviral backbone and genome plasmids (Addgene: 12251, 12253, 12259; plasmid ratio 2:1:1:4 μg) using Lipofectamine 3000. Cells were cultured at 37°C for 2–4 days, after which virus-containing supernatants were filtered through a 0.45 μm PVDF filter (Millipore Sigma) and either used immediately or stored at −80°C.
Stable Cell Generation
THP-1 monocytes were infected with dCas9-virus in 1 mL RPMI1640 (10% FBS) containing 10 μg/mL polybrene (0.3 × 10^6 cells per well in a 6-well plate). After 3 days at 37°C, cells were refreshed with new media; on day 4, 15 μg/mL blasticidin was added for selection. Following 2 days of selection, stable cells were expanded in flasks with continued antibiotic maintenance.
Sample Collection for RNA-seq
Stable THP-1 cell lines were differentiated into macrophages via 3 days of PMA treatment followed by 1 day of resting. On day 4, macrophages were treated with or without LPS+IFN-γ for 4 hours, lysed in-plate, and total RNA was extracted for RNA-seq as described previously.
Enhancer-promoter Mapping
Enhancer-promoter mapping with the Activity-by-Contact model
THP-1 enhancer-promoter interactions were predicted with the Activity-by-Contact (ABC) algorithm80. All input data (Hi-C, ATAC-seq, and H3K27ac ChIP-seq for resting cells and for cells stimulated 4 h with LPS+IFN-γ) were obtained from the same GEO series, GSE201376 (Reed et al.81, hg19). The publicly supplied 5-kb Hi-C contact matrix was used as-is, whereas the raw ATAC-seq and ChIP-seq FASTQ files were re-processed with the ENCODE ATAC-seq and ChIP-seq pipelines (hg19 alignment, default parameters). ABC scores were computed from the re-processed activity tracks and the Hi-C contacts, and enhancer-promoter pairs with ABC ≥ 0.02 were retained as putative regulatory links.
Gene-set enrichment of ABC-linked target genes for functional regulatory variants in THP-1 macrophages
functional regulatory variants discovered by MPRA in both resting and LPS+IFN-γ-stimulated THP-1 macrophages were linked to their putative target genes CRISPRi with the ABC map (ABC ≥ 0.02 in either state). The union of genes (13 genes) from the two conditions was analyzed with enrichGO110 (clusterProfiler v4.16.0) against the Gene Ontology Biological-Process ontology in org.Hs.eg.db. Over-representation was tested with the hypergeometric method and Benjamini-Hochberg correction; terms with adjusted P < 0.05 were considered significantly enriched.
Extended Data
Extended Data Fig. 1 |. Epigenomic characterization of stimulated THP-1 macrophages as a microglial model.

(a) Differentiation of THP-1 monocytes into macrophages, confirmed by reduced cell cycle-related pathways and elevated immune response pathways in ATAC-seq and RNA-seq(FDR < 0.05, DESeq2, fast gene set enrichment analysis).
(b) ATAC-seq of THP-1 macrophages stimulated with IFN-β, IFN-γ, or LPS+IFN-γ shows distinct regulatory responses, including promoter opening and closing (padj < 0.05, DESeq2).
(c) Principal component analysis (PCA) of open chromatin profiles of THP-1 macrophages stimulated with IFN-β, IFN-γ, or LPS+IFN-γ.
(d) Pathway analyses of promoters with gained accessibility under each stimulation highlight antiviral (IFN-β) and M1 polarization pathways (IFN-γ) and defense responses (LPS+IFN-γ) (FDR < 0.05, fast gene set enrichment analysis).
(e) Stratified LD-score regression (S-LDSC) reveals significant enrichment of LOAD risk variants in chromatin accessible in THP-1 macrophages, comparable to primary or hESC/iPSC-derived microglia, but not in neurons or HMC3/HEK293T cells.
(f) PCA of open chromatin profiles confirms that THP-1 macrophages resemble iPSC/hESC-derived microglia, whereas HMC3 is closer to immortalized cell lines. These findings validate THP-1 macrophages as a practical model for dissecting LOAD-associated immune mechanisms.
Extended Data Fig. 2 |. Transcriptomic profiling and microglial marker validation in THP-1 macrophages.

(a) Differential expression analyses confirm significant up- or downregulated genes under various stimulation conditions (FDR < 0.05, DESeq2).
(b) Gene set enrichment analyses of resting and stimulated THP-1 macrophages reveal immune-related shifts (IFN-β, IFN-γ, LPS+IFN-γ) that mirror ATAC-seq changes in Extended Data Fig. 1. (FDR < 0.05, fast gene set enrichment analysis).
(c) PCA of RNA-seq data shows distinct transcriptomic clusters for each state, reflecting diverse immune states.
(d) Microglial and macrophage markers were expressed in all conditions.
(e) Differential expression of microglial-state marker genes (Sun et al.25) in stimulated THP-1 macrophages versus non-marker genes (two-sided Mann-Whitney U, Benjamini-Hochberg correction). Significance codes, Benjamini-Hochberg FDR: **** < 1 × 10⁻⁴; *** < 1 × 10⁻³; ** < 1 × 10⁻²; * < 0.05; NS, not significant.
(f) Transcriptomic concordance between LPS + IFN-γ-stimulated THP-1 macrophages and amyloid-fibril-treated iPSC-microglia. Pearson’s r is calculated on the expression levels of genes that are differentially expressed in the amyloid-fibril model (Sun et al.25).
Extended Data Fig. 3 |. MPRA reproducibility, cell-type clustering, and motif contributions to LPS+IFN-γ-responsive enhancers.

(a) Biological replicates show high concordance in MPRA activity (Pearson’s r ≈ 0.8–0.9 in vitro, r ≈ 0.6–0.7). t-SNE analysis of CRE enhancer activities reveals distinct clustering by cell type.
(b) Approximately 12.5% of the tested candidate cis-regulatory elements (CREs) are active (MPRAnalyze quantitative analysis, P.MAD.Score < 0.1) in both macrophages and mouse brain regions.
(c) Coefficients of HOCOMOCO transcription factor motifs in elastic net models that predict MAD scores of LPS+IFN-γ-treated THP-1 macrophages and resting THP-1 macrophages. Regression outliers highlighted in red have residuals greater than 3-fold the standard deviation.
(d) Deep-learning models trained on LPS+IFN-γ responsive ATAC-seq peaks (DESeq2, padj < 0.05) identify TF motifs positively and negatively enriched among LPS+IFN-γ responsive MPRA enhancers. NF-κB, IRF/STAT, and CG-rich motifs contribute to increased accessibility, whereas SPI1 and C/EBP motifs correlate with decreased accessibility (TF-MoDISco, motif q-value < 0.05).
(e) Deep-learning models trained on ATAC-seq data identify cell-type-specific TF motifs enriched among active MPRA enhancers, confirming motif-driven transcriptional regulation (TF-MoDISco, motif q-value < 0.05).
Extended Data Fig. 4 |. Context-dependent functional impacts of LOAD-associated genetic variants.

(a) Volcano plots of significantly functional common and rare LOAD variants identified by MPRA in THP-1 macrophages and mouse brain tissue (MPRAnalyze comparative analysis, FDR < 0.05). Variants highlight cell-type specificity and effect-size distributions of regulatory effects.
(b) Venn diagram illustrating overlaps of expression-modulating variants identified across THP-1 macrophages, HMC3 microglia, and mouse brain.
(c) Variant effects quantified by MPRA reveal cell-type-specific impacts. Spearman correlation coefficients (P < 0.05) are higher between similar cell types and lower between distinct cell types, emphasizing cell-type specificity.
(d) Variants show a visible trend of segregating into immune-, brain-, or nonspecific categories consistent with their CRE annotations, but this distribution does not reach statistical significance (Chi-squared test, p > 0.05).
(e) Common versus rare variant effects on transcriptional regulation in MPRA. Rare variants (minor allele frequency [MAF] < 0.01) have stronger effects in brain tissue; common variants (including low frequency variants, MAF ≥ 0.01) exhibit greater effects in THP-1 macrophages. Highly frequent variants (MAF ≥ 0.1) reinforce this pattern, highlighting distinct roles for rare versus common LOAD variants. Each dot represents an independent one-tailed Mann-Whitney U test; y-axis indicates the test P-value. Dot size represents the ratio of common to rare variants, and the number of common variants at critical points is displayed. Dark blue/red: more common than rare variants (rare MAF ≤ 0.2); light blue/red: fewer common than rare variants (rare MAF > 0.2).
(f) Genes regulated by distal enhancers that contain functionally causal variants are enriched in sensory-related pathways (fGSEA, FDR < 0.05).
Extended Data Fig. 5 |. Machine-learning models identify cell-type- and immune-state-specific variant effects.
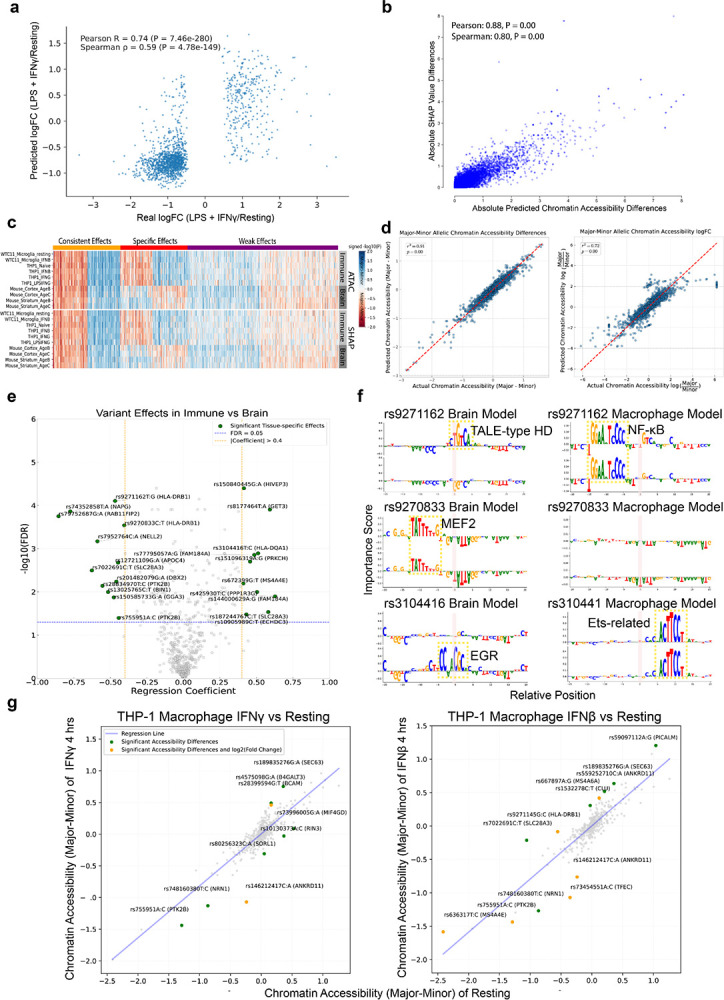
(a) Convolutional neural network (CNN) models trained on LPS+IFN-γ-responsive peaks (differentially accessible regions in ATAC-seq, DEseq2, FDR < 0.05) in THP-1 macrophages. The model showed good performance on the validation dataset (Pearson’s r, 0.74).
(b) Model-derived accessibility changes significantly correlate with SHAP importance scores (Pearson’s r, 0.88), validating the approach for identifying regulatory variants.
(c) In silico mutagenesis reveals allelic effects of LOAD variants, including consistent, specific, and weak effects. P-values calculated based on differences in predicted chromatin accessibility and SHAP values between major and minor alleles relative to cell-type-specific null distributions.
(d,e) Linear regression across multiple machine learning predictions of chromatin accessibility differences and log fold changes captures immune-versus neuronal-specific variant effects.
(f) Examples of variants in HLA-DRB1 and HLA-DQA1 show unexpectedly strong neuronal effects (SHAP values visualized by logomaker).
(g) Independent linear regressions of model-predicted effect sizes across two immune states (resting, IFN-γ, IFN-β) show variants with state-specific activity. Variants whose standardized residuals exceed 3-fold standard deviation (two-tailed P < 0.01) are classified as IFN-γ-specific, IFN-β-specific, or brain-region-specific.
Extended Data Fig. 6 |. Rare variants in NELL2 and DBX2 highlight neuronal-specific regulatory outcomes.

Two rare variants in the NELL2 locus (rs1376126, rs143882939) display no significant effect in THP-1 macrophages but show contrasting allelic activity in mouse hippocampus, cortex, and striatum, demonstrating neuronal-context specificity (*FDR<0.05, MPRAnalyze comparative analysis). Machine learning models do not capture motifs that positively contribute to chromatin accessibility (SHAP scores by TF-MoDISco). Nearby variants in the DBX2 promoter (rs73278954, rs113838039) have measurable effects in both macrophages and brain tissue. Collectively, these findings emphasize how rare LOAD variants can selectively affect neuronal enhancers while also exerting cross-cell-type regulatory functions in certain contexts.
Extended Data Fig. 7 |. Synthetic enhancer tiling and motif shuffling for BIN1 in THP-1 macrophage MPRA.

Synthetic enhancer tiling and 25 bp motif shuffling around rs6733839 at the BIN1 locus illustrate how combinatorial interactions determine whether the motif context around exerts an activating or repressive effect. MAD scores quantify transcriptional activity (MPRAnalyze quantitative analysis), and motif-allele differences are evaluated by MPRAnalyze comparative analyses, respectively (*FDR<0.05, MPRAnalyze comparative analysis). When the motif context pairs only with upstream motifs (rs6733839_Enhancer1), the CRE behaves as an enhancer. When paired with both upstream and downstream motifs (rs6733839_Enhancer2), it is embedded in a repressive CRE but still confers partial activation. When paired only with downstream motifs (rs6733839_Enhancer3), it acts repressively within a repressive CRE. Removing the rs6733839 motif context while retaining downstream motifs (rs72838288_Enhancer1) produces a net activating enhancer. These observations suggest that the rs6733839 motif context provides a repressive function in combination with downstream motifs but becomes activating when upstream motifs are present, with the net effect ultimately dominated by its combination with downstream sequences.
Extended Data Fig. 8 |. Chromatin architecture and functional consequences of CRISPRi targeting the SEC63-OSTM1 enhancer.

(a) Hi-C in THP-1 macrophages (<5-kb resolution) places the enhancer (black bar) in the same contact domain as the SEC63 promoter and shows a looping interaction with the OSTM1 promoter and a CTCF anchor in the intronic regions of AFG1L.
(b) Three-dimensional chromatin model of the SEC63-OSTM1 enhancer and nearby genes.
(c) SEC63, the enhancer, and OSTM1 knockdown in hyperinflammatory (LPS + IFN-γ-treated) THP-1 macrophages.
(d) CRISPRi knockdown of the SEC63 and OSTM1 promoters perturbs distinct transcriptional pathways in resting and hyperinflammatory (LPS + IFN-γ-treated) THP-1 macrophages (fgsea, FDR<0.05).
(e) Expression of the microglial-state marker genes defined by Sun et al.25 after CRISPRi. Silencing SEC63 shifts multiple microglial programs, and these shifts are amplified under LPS + IFN-γ-highlighting a central role for SEC63 in state transitions and immune responses.
Supplementary Material
Supplementary Table 1 | ATAC-seq promoter accessibility in THP-1 cells Genome-wide differential-accessibility statistics for all promoters (±1 kb from the annotated TSS) profiled in THP-1 monocytes and in macrophages that were unstimulated or stimulated with IFN-β, IFN-γ, or LPS+IFN-γ. For each stimulus-versus-resting comparison, the table lists genomic coordinates, base-mean accessibility, log₂-fold change, Wald statistic, and Benjamini–Hochberg-adjusted P value (padj).
Supplementary Table 2 | RNA-seq gene-expression profiles in THP-1 cells Gene-level differential-expression statistics for THP-1 monocytes and macrophages exposed to IFN-β, IFN-γ, or LPS+IFN-γ, alongside the unstimulated macrophage state. For every annotated gene, the table reports transcript ID, gene symbol, base-mean expression, log₂-fold change relative to the baseline, Wald statistic, and Benjamini–Hochberg-adjusted P value (padj).
Supplementary Table 3 | MPRA oligonucleotide library design A complete list of all variants and their corresponding oligonucleotides included in the MPRA designed to test regulatory variants associated with LOAD, with functional annotations for every element.
Supplementary Table 4 | Enhancer activity in MPRAs Enhancer activities for each cis-regulatory element (CRE) measured by MPRA, based on 15 unique barcode replicates per CRE.
Supplementary Table 5 | State-specific enhancer activities in immune-cell MPRAs Differential enhancer activities in THP-1 macrophages and HMC3 microglia following IFN-β, IFN-γ, or LPS+IFN-γ stimulation, reported as log₂-fold change and false-discovery-rate-adjusted P values relative to the resting state.
Supplementary Table 6 | Allelic MPRA effects (emVars) Allelic activity differences (reference versus alternate) for all expression-modulating variants (emVars) identified in the MPRA experiments, including effect size (log₂-fold change) and padj. Log₂-fold changes for major-versus-minor alleles need to be adjusted according to the ‘REFALT_Flip’ indicator listed in Supplementary Table 3.
Supplementary Table 7 | Motif-shuffled effects in MPRAs Transcriptional differences of motif-shuffled CREs relative to the corresponding CREs harboring LOAD genetic variants.
Supplementary Table 8 | State-specific allelic effects in MPRAs Allelic activity differences that are specific to immune stimulation in THP-1 macrophages and HMC3 microglia, with interaction statistics for allele × stimulus effects.
Supplementary Table 9 | Predicted variant effects from machine learning Allele-specific regulatory impact scores from convolutional neural network (CNN) models and splicing-impact scores from SpliceAI for every variant assayed.
Supplementary Table 10 | Prioritized functional variants across cell types Integrated list of high-confidence functional regulatory variants in THP-1 macrophages, mouse brain tissue, HMC3 microglia, and HEK293T cells, combining MPRA and computational predictions.
Supplementary Table 11 | ABC promoter–enhancer links for candidate variants Activity-by-contact (ABC) model results linking candidate variants to putative target promoters in THP-1 macrophages, including ABC scores and genomic coordinates of interacting elements.
Supplementary Table 12 | CRISPRi RNA-seq in THP-1 macrophages Differential gene-expression statistics from CRISPRi perturbations of candidate regulatory elements or their nearest-gene promoters in THP-1 macrophages, reported as log₂-fold change versus non-targeting control and Benjamini–Hochberg-adjusted P values.
Supplementary Table 13 | CNN architecture and training hyper-parameters Layer-by-layer specification of the convolutional neural network used to predict ATAC-seq accessibility. Table details input shape, layer type, kernel size, stride, number of filters/units, activation function, dropout rate, optimizer, learning-rate schedule, batch size, and training epochs.
Supplementary Table 14 | CRISPRi sgRNA designs Sequences and genomic targets of all sgRNAs used for enhancer and promoter knock-downs. For each guide RNA we list the target category (enhancer / promoter / non-targeting / safe-targeting), oligo sequences (5′→3′) and spacer sequences.
Acknowledgement
We thank Spencer Gibson for piloting the Monte Carlo dropout procedure that informed our assessment of model-prediction uncertainty. We are grateful to Jianglin Zhang for validating sysMPRA in gut tissues through molecular imaging that confirmed systemic infection and assay performance. We acknowledge Xiantong Xin’s efforts in piloting ATAC-seq of THP-1 monocytes. We also thank Robert van de Weerd for his careful proofreading and constructive feedback on the manuscript.
Funding
This work was supported by Cure Alzheimer’s Fund (ARP), PA Cure 4100087331 (ARP), NIH DP1DA046585 (ARP). B.N.P. was supported by an NIH F30 pre-doctoral fellowship (F30 DA053020). The funders had no role in study design, data collection and analysis, decision to publish, or preparation of the manuscript.
Funding Statement
This work was supported by Cure Alzheimer’s Fund (ARP), PA Cure 4100087331 (ARP), NIH DP1DA046585 (ARP). B.N.P. was supported by an NIH F30 pre-doctoral fellowship (F30 DA053020). The funders had no role in study design, data collection and analysis, decision to publish, or preparation of the manuscript.
Footnotes
Competing Interests
None.
Data Availability
Illumina sequencing data were deposited in Gene Expression Omnibus (GEO) with the accession number ***.
Code Availability
Scripts for data analysis are available upon request.
Reference
- 1.Rabinovici G. D. Late-onset Alzheimer Disease. Contin.: Lifelong Learn. Neurol. 25, 14–33 (2019). [DOI] [PMC free article] [PubMed] [Google Scholar]
- 2.Liu C.-C., Liu C.-C., Kanekiyo T., Xu H. & Bu G. Apolipoprotein E and Alzheimer disease: risk, mechanisms and therapy. Nat. Rev. Neurol. 9, 106–118 (2013). [DOI] [PMC free article] [PubMed] [Google Scholar]
- 3.Wightman D. P. et al. A genome-wide association study with 1,126,563 individuals identifies new risk loci for Alzheimer’s disease. Nat Genet 53, 1276–1282 (2021). [DOI] [PMC free article] [PubMed] [Google Scholar]
- 4.Jansen I. E. et al. Genome-wide meta-analysis identifies new loci and functional pathways influencing Alzheimer’s disease risk. Nat Genet 51, 404–413 (2019). [DOI] [PMC free article] [PubMed] [Google Scholar]
- 5.Bellenguez C. et al. New insights into the genetic etiology of Alzheimer’s disease and related dementias. Nat. Genet. 54, 412–436 (2022). [DOI] [PMC free article] [PubMed] [Google Scholar]
- 6.Kunkle B. W. et al. Genetic meta-analysis of diagnosed Alzheimer’s disease identifies new risk loci and implicates Aβ, tau, immunity and lipid processing. Nat Genet 51, 414–430 (2019). [DOI] [PMC free article] [PubMed] [Google Scholar]
- 7.Leng F. & Edison P. Neuroinflammation and microglial activation in Alzheimer disease: where do we go from here? Nat Rev Neurol 17, 157–172 (2021). [DOI] [PubMed] [Google Scholar]
- 8.Miao J. et al. Microglia in Alzheimer’s disease: pathogenesis, mechanisms, and therapeutic potentials. Front. Aging Neurosci. 15, 1201982 (2023). [DOI] [PMC free article] [PubMed] [Google Scholar]
- 9.Nimmerjahn A., Kirchhoff F. & Helmchen F. Resting Microglial Cells Are Highly Dynamic Surveillants of Brain Parenchyma in Vivo. Science 308, 1314–1318 (2005). [DOI] [PubMed] [Google Scholar]
- 10.Cserép C. et al. Microglia monitor and protect neuronal function through specialized somatic purinergic junctions. Science 367, 528–537 (2020). [DOI] [PubMed] [Google Scholar]
- 11.Ard M. D., Cole G. M., Wei J., Mehrle A. P. & Fratkin J. D. Scavenging of Alzheimer’s amyloid β-protein by microglia in culture. J. Neurosci. Res. 43, 190–202 (1996). [DOI] [PubMed] [Google Scholar]
- 12.McGeer P. L., Itagaki S., Tago H. & McGeer E. G. Reactive microglia in patients with senile dementia of the Alzheimer type are positive for the histocompatibility glycoprotein HLA-DR. Neurosci. Lett. 79, 195–200 (1987). [DOI] [PubMed] [Google Scholar]
- 13.Bolós M. et al. Direct Evidence of Internalization of Tau by Microglia In Vitro and In Vivo. J. Alzheimer’s Dis. 50, 77–87 (2015). [DOI] [PubMed] [Google Scholar]
- 14.Scheiblich H. et al. Microglia rescue neurons from aggregate-induced neuronal dysfunction and death through tunneling nanotubes. Neuron 112, 3106–3125.e8 (2024). [DOI] [PubMed] [Google Scholar]
- 15.Welch G. M. et al. Neurons burdened by DNA double-strand breaks incite microglia activation through antiviral-like signaling in neurodegeneration. Sci Adv 8, eabo4662 (2022). [DOI] [PMC free article] [PubMed] [Google Scholar]
- 16.Davalos D. et al. ATP mediates rapid microglial response to local brain injury in vivo. Nat. Neurosci. 8, 752–758 (2005). [DOI] [PubMed] [Google Scholar]
- 17.Muzio L., Viotti A. & Martino G. Microglia in Neuroinflammation and Neurodegeneration: From Understanding to Therapy. Front. Neurosci. 15, 742065 (2021). [DOI] [PMC free article] [PubMed] [Google Scholar]
- 18.Gao C., Jiang J., Tan Y. & Chen S. Microglia in neurodegenerative diseases: mechanism and potential therapeutic targets. Signal Transduct. Target. Ther. 8, 359 (2023). [DOI] [PMC free article] [PubMed] [Google Scholar]
- 19.Sudwarts A. et al. BIN1 is a key regulator of proinflammatory and neurodegeneration-related activation in microglia. Mol. Neurodegener. 17, 33 (2022). [DOI] [PMC free article] [PubMed] [Google Scholar]
- 20.Wang S. et al. TREM2 drives microglia response to amyloid-β via SYK-dependent and -independent pathways. Cell 185, 4153–4169.e19 (2022). [DOI] [PMC free article] [PubMed] [Google Scholar]
- 21.Wang Y. et al. TREM2 Lipid Sensing Sustains the Microglial Response in an Alzheimer’s Disease Model. Cell 160, 1061–1071 (2015). [DOI] [PMC free article] [PubMed] [Google Scholar]
- 22.Zhong L. et al. Soluble TREM2 induces inflammatory responses and enhances microglial survival. J. Exp. Med. 214, 597–607 (2017). [DOI] [PMC free article] [PubMed] [Google Scholar]
- 23.Dourlen P., Kilinc D., Landrieu I., Chapuis J. & Lambert J.-C. BIN1 and Alzheimer’s disease: the tau connection. Trends Neurosci. 48, 349–361 (2025). [DOI] [PubMed] [Google Scholar]
- 24.Ulland T. K. & Colonna M. TREM2 — a key player in microglial biology and Alzheimer disease. Nat. Rev. Neurol. 14, 667–675 (2018). [DOI] [PubMed] [Google Scholar]
- 25.Sun N. et al. Human microglial state dynamics in Alzheimer’s disease progression. Cell 186, 4386–4403.e29 (2023). [DOI] [PMC free article] [PubMed] [Google Scholar]
- 26.Gazestani V. et al. Early Alzheimer’s disease pathology in human cortex involves transient cell states. Cell 186, 4438–4453.e23 (2023). [DOI] [PMC free article] [PubMed] [Google Scholar]
- 27.Ramamurthy E. et al. Regression convolutional neural network models implicate peripheral immune regulatory variants in the predisposition to Alzheimer’s disease. PLOS Comput. Biol. 20, e1012356 (2024). [DOI] [PMC free article] [PubMed] [Google Scholar]
- 28.Yang X. et al. Functional characterization of Alzheimer’s disease genetic variants in microglia. Nat. Genet. 55, 1735–1744 (2023). [DOI] [PMC free article] [PubMed] [Google Scholar]
- 29.Xiong X. et al. Epigenomic dissection of Alzheimer’s disease pinpoints causal variants and reveals epigenome erosion. Cell 186, 4422–4437.e21 (2023). [DOI] [PMC free article] [PubMed] [Google Scholar]
- 30.Cooper Y. A. et al. Functional regulatory variants implicate distinct transcriptional networks in dementia. Science 377, eabi8654 (2022). [DOI] [PubMed] [Google Scholar]
- 31.Bond M. L. et al. Deciphering the functional impact of Alzheimer’s Disease-associated variants in resting and proinflammatory immune cells. medRxiv 2024.09.13.24313654 (2024) doi: 10.1101/2024.09.13.24313654. [DOI] [Google Scholar]
- 32.Prokopenko D. et al. Whole-genome sequencing reveals new Alzheimer’s disease–associated rare variants in loci related to synaptic function and neuronal development. Alzheimer’s Dement. 17, 1509–1527 (2021). [DOI] [PMC free article] [PubMed] [Google Scholar]
- 33.Dunham I. et al. An integrated encyclopedia of DNA elements in the human genome. Nature 489, 57–74 (2012). [DOI] [PMC free article] [PubMed] [Google Scholar]
- 34.Maurano M. T. et al. Systematic Localization of Common Disease-Associated Variation in Regulatory DNA. Science 337, 1190–1195 (2012). [DOI] [PMC free article] [PubMed] [Google Scholar]
- 35.Heinz S. et al. Effect of natural genetic variation on enhancer selection and function. Nature 503, 487–492 (2013). [DOI] [PMC free article] [PubMed] [Google Scholar]
- 36.Kundaje A. et al. Integrative analysis of 111 reference human epigenomes. Nature 518, 317–330 (2015). [DOI] [PMC free article] [PubMed] [Google Scholar]
- 37.Ostuni R. et al. Latent Enhancers Activated by Stimulation in Differentiated Cells. Cell 152, 157–171 (2013). [DOI] [PubMed] [Google Scholar]
- 38.Umans B. D. & Gilad Y. Oxygen-induced stress reveals context-specific gene regulatory effects in human brain organoids. Genome Res. gr.280219.124 (2025) doi: 10.1101/gr.280219.124. [DOI] [PMC free article] [PubMed] [Google Scholar]
- 39.Umans B. D., Battle A. & Gilad Y. Where Are the Disease-Associated eQTLs? Trends Genet. 37, 109–124 (2021). [DOI] [PMC free article] [PubMed] [Google Scholar]
- 40.Fairfax B. P. et al. Innate Immune Activity Conditions the Effect of Regulatory Variants upon Monocyte Gene Expression. Science 343, 1246949 (2014). [DOI] [PMC free article] [PubMed] [Google Scholar]
- 41.Kribelbauer-Swietek J. F. et al. Context transcription factors establish cooperative environments and mediate enhancer communication. Nat. Genet. 56, 2199–2212 (2024). [DOI] [PMC free article] [PubMed] [Google Scholar]
- 42.Gjoneska E. et al. Conserved epigenomic signals in mice and humans reveal immune basis of Alzheimer’s disease. Nature 518, 365–369 (2015). [DOI] [PMC free article] [PubMed] [Google Scholar]
- 43.Nott A. et al. Brain cell type–specific enhancer–promoter interactome maps and disease-risk association. Science 366, 1134–1139 (2019). [DOI] [PMC free article] [PubMed] [Google Scholar]
- 44.Ward L. D. & Kellis M. Interpreting noncoding genetic variation in complex traits and human disease. Nat. Biotechnol. 30, 1095–1106 (2012). [DOI] [PMC free article] [PubMed] [Google Scholar]
- 45.Ernst J. et al. Genome-scale high-resolution mapping of activating and repressive nucleotides in regulatory regions. Nat. Biotechnol. 34, 1180–1190 (2016). [DOI] [PMC free article] [PubMed] [Google Scholar]
- 46.Lee S. et al. Massively parallel reporter assay investigates shared genetic variants of eight psychiatric disorders. Cell 188, 1409–1424.e21 (2025). [DOI] [PMC free article] [PubMed] [Google Scholar]
- 47.Tewhey R. et al. Direct Identification of Hundreds of Expression-Modulating Variants using a Multiplexed Reporter Assay. Cell 165, 1519–1529 (2016). [DOI] [PMC free article] [PubMed] [Google Scholar]
- 48.Siraj L. et al. Functional dissection of complex and molecular trait variants at single nucleotide resolution. bioRxiv 2024.05.05.592437 (2024) doi: 10.1101/2024.05.05.592437. [DOI] [PubMed] [Google Scholar]
- 49.Brown A. R. et al. An in vivo systemic massively parallel platform for deciphering animal tissue-specific regulatory function. Front. Genet. 16, 1533900 (2025). [DOI] [PMC free article] [PubMed] [Google Scholar]
- 50.Degner K. N., Bell J. L., Jones S. D. & Won H. Just a SNP away: The future of invivo massively parallel reporter assay. Cell Insight 4, 100214 (2025). [DOI] [PMC free article] [PubMed] [Google Scholar]
- 51.Qi L. S. et al. Repurposing CRISPR as an RNA-Guided Platform for Sequence-Specific Control of Gene Expression. Cell 152, 1173–1183 (2013). [DOI] [PMC free article] [PubMed] [Google Scholar]
- 52.Kheradpour P. & Kellis M. Systematic discovery and characterization of regulatory motifs in ENCODE TF binding experiments. Nucleic Acids Res. 42, 2976–2987 (2013). [DOI] [PMC free article] [PubMed] [Google Scholar]
- 53.Zhou J. & Troyanskaya O. G. Predicting effects of noncoding variants with deep learning–based sequence model. Nat. Methods 12, 931–934 (2015). [DOI] [PMC free article] [PubMed] [Google Scholar]
- 54.Avsec Ž. et al. Effective gene expression prediction from sequence by integrating long-range interactions. Nat. Methods 18, 1196–1203 (2021). [DOI] [PMC free article] [PubMed] [Google Scholar]
- 55.Pampari A. et al. ChromBPNet: bias factorized, base-resolution deep learning models of chromatin accessibility reveal cis-regulatory sequence syntax, transcription factor footprints and regulatory variants. bioRxiv 2024.12.25.630221 (2025) doi: 10.1101/2024.12.25.630221. [DOI] [Google Scholar]
- 56.Tu X. et al. Deep genomic models of allele-specific measurements. bioRxiv 2025.04.09.648060 (2025) doi: 10.1101/2025.04.09.648060. [DOI] [Google Scholar]
- 57.Fu X. et al. A foundation model of transcription across human cell types. Nature 1–9 (2025) doi: 10.1038/s41586-024-08391-z. [DOI] [PMC free article] [PubMed] [Google Scholar]
- 58.Lawler A. J. et al. Machine learning sequence prioritization for cell type-specific enhancer design. eLife 11, e69571 (2022). [DOI] [PMC free article] [PubMed] [Google Scholar]
- 59.Benegas G., Ye C., Albors C., Li J. C. & Song Y. S. Genomic Language Models: Opportunities and Challenges. arXiv (2024) doi: 10.48550/arxiv.2407.11435. [DOI] [PubMed] [Google Scholar]
- 60.Patel A. et al. DART-Eval: A Comprehensive DNA Language Model Evaluation Benchmark on Regulatory DNA. arXiv (2024) doi: 10.48550/arxiv.2412.05430. [DOI] [Google Scholar]
- 61.Avsec Ž. et al. AlphaGenome: advancing regulatory variant effect prediction with a unified DNA sequence model. bioRxiv 2025.06.25.661532 (2025) doi: 10.1101/2025.06.25.661532. [DOI] [Google Scholar]
- 62.Leone M. J. et al. Combining Machine Learning and Multiplexed, In Situ Profiling to Engineer Cell Type and Behavioral Specificity. bioRxiv 2025.06.20.660790 (2025) doi: 10.1101/2025.06.20.660790. [DOI] [Google Scholar]
- 63.Gosai S. J. et al. Machine-guided design of cell-type-targeting cis-regulatory elements. Nature 634, 1211–1220 (2024). [DOI] [PMC free article] [PubMed] [Google Scholar]
- 64.Consortium, A. et al. Rare coding variants in PLCG2, ABI3, and TREM2 implicate microglial-mediated innate immunity in Alzheimer’s disease. Nat. Genet. 49, 1373–1384 (2017). [DOI] [PMC free article] [PubMed] [Google Scholar]
- 65.Silvin A. et al. Dual ontogeny of disease-associated microglia and disease inflammatory macrophages in aging and neurodegeneration. Immunity 55, 1448–1465.e6 (2022). [DOI] [PubMed] [Google Scholar]
- 66.Goldmann T. et al. Origin, fate and dynamics of macrophages at central nervous system interfaces. Nat. Immunol. 17, 797–805 (2016). [DOI] [PMC free article] [PubMed] [Google Scholar]
- 67.Utz S. G. et al. Early Fate Defines Microglia and Non-parenchymal Brain Macrophage Development. Cell 181, 557–573.e18 (2020). [DOI] [PubMed] [Google Scholar]
- 68.Siret C. et al. Deciphering the heterogeneity of the Lyve1+ perivascular macrophages in the mouse brain. Nat. Commun. 13, 7366 (2022). [DOI] [PMC free article] [PubMed] [Google Scholar]
- 69.Varvel N. H. et al. Replacement of brain-resident myeloid cells does not alter cerebral amyloid-β deposition in mouse models of Alzheimer’s disease. J. Exp. Med. 212, 1803–1809 (2015). [DOI] [PMC free article] [PubMed] [Google Scholar]
- 70.Wendeln A.-C. et al. Innate immune memory in the brain shapes neurological disease hallmarks. Nature 556, 332–338 (2018). [DOI] [PMC free article] [PubMed] [Google Scholar]
- 71.Thome A. D. et al. Functional alterations of myeloid cells during the course of Alzheimer’s disease. Mol. Neurodegener. 13, 61 (2018). [DOI] [PMC free article] [PubMed] [Google Scholar]
- 72.Quiroga I. Y. et al. Synthetic amyloid beta does not induce a robust transcriptional response in innate immune cell culture systems. J Neuroinflamm 19, 99 (2022). [DOI] [PMC free article] [PubMed] [Google Scholar]
- 73.Klein J. C. et al. A systematic evaluation of the design and context dependencies of massively parallel reporter assays. Nat Methods 17, 1083–1091 (2020). [DOI] [PMC free article] [PubMed] [Google Scholar]
- 74.Nguyen T. A. et al. High-throughput functional comparison of promoter and enhancer activities. Genome Res. 26, 1023–1033 (2016). [DOI] [PMC free article] [PubMed] [Google Scholar]
- 75.Jones L. et al. Genetic Evidence Implicates the Immune System and Cholesterol Metabolism in the Aetiology of Alzheimer’s Disease. PLoS ONE 5, e13950 (2010). [DOI] [PMC free article] [PubMed] [Google Scholar]
- 76.Lundberg S. & Lee S.-I. A Unified Approach to Interpreting Model Predictions. arXiv (2017) doi: 10.48550/arxiv.1705.07874. [DOI] [Google Scholar]
- 77.Shrikumar A. et al. Technical Note on Transcription Factor Motif Discovery from Importance Scores (TF-MoDISco) version 0.5.6.5. arXiv (2018) doi: 10.48550/arxiv.1811.00416. [DOI] [Google Scholar]
- 78.Morabito S. et al. Single-nucleus chromatin accessibility and transcriptomic characterization of Alzheimer’s disease. Nat. Genet. 53, 1143–1155 (2021). [DOI] [PMC free article] [PubMed] [Google Scholar]
- 79.Heneka M. T. et al. Neuroinflammation in Alzheimer disease. Nat. Rev. Immunol. 25, 321–352 (2025). [DOI] [PMC free article] [PubMed] [Google Scholar]
- 80.Fulco C. P. et al. Activity-by-contact model of enhancer–promoter regulation from thousands of CRISPR perturbations. Nat. Genet. 51, 1664–1669 (2019). [DOI] [PMC free article] [PubMed] [Google Scholar]
- 81.Reed K. S. M. et al. Temporal analysis suggests a reciprocal relationship between 3D chromatin structure and transcription. Cell Rep. 41, 111567 (2022). [DOI] [PMC free article] [PubMed] [Google Scholar]
- 82.Rosner D. et al. The Alzheimer’s Disease Risk Genes MS4A4A And MS4A6A Cooperate to Negatively Regulate Trem2 and Microglia states. bioRxiv 2024.11.23.625001 (2024) doi: 10.1101/2024.11.23.625001. [DOI] [PubMed] [Google Scholar]
- 83.Deming Y. et al. The MS4A gene cluster is a key modulator of soluble TREM2 and Alzheimer’s disease risk. Sci. Transl. Med. 11, (2019). [DOI] [PMC free article] [PubMed] [Google Scholar]
- 84.Nott A. & Holtman I. R. Genetic insights into immune mechanisms of Alzheimer’s and Parkinson’s disease. Front. Immunol. 14, 1168539 (2023). [DOI] [PMC free article] [PubMed] [Google Scholar]
- 85.Novikova G. et al. Integration of Alzheimer’s disease genetics and myeloid genomics identifies disease risk regulatory elements and genes. Nat Commun 12, 1610 (2021). [DOI] [PMC free article] [PubMed] [Google Scholar]
- 86.Yang J.-H. et al. Loss of epigenetic information as a cause of mammalian aging. Cell (2023) doi: 10.1016/j.cell.2022.12.027. [DOI] [PMC free article] [PubMed] [Google Scholar]
- 87.Huang D. & Ovcharenko I. Silencer variants are key drivers of gene upregulation in Alzheimer’s disease. medRxiv 2025.04.07.25325386 (2025) doi: 10.1101/2025.04.07.25325386. [DOI] [PubMed] [Google Scholar]
- 88.He G. et al. Gamma-secretase activating protein is a therapeutic target for Alzheimer’s disease. Nature 467, 95–98 (2010). [DOI] [PMC free article] [PubMed] [Google Scholar]
- 89.Cazzaro S. et al. Slingshot homolog-1–mediated Nrf2 sequestration tips the balance from neuroprotection to neurodegeneration in Alzheimer’s disease. Proc. Natl. Acad. Sci. 120, e2217128120 (2023). [DOI] [PMC free article] [PubMed] [Google Scholar]
- 90.Kaplow I. M. et al. Inferring mammalian tissue-specific regulatory conservation by predicting tissue-specific differences in open chromatin. BMC Genom. 23, 291 (2022). [DOI] [PMC free article] [PubMed] [Google Scholar]
- 91.Kaplow I. M. et al. Relating enhancer genetic variation across mammals to complex phenotypes using machine learning. Science 380, eabm7993 (2023). [DOI] [PMC free article] [PubMed] [Google Scholar]
- 92.Zhao S. et al. A single-cell massively parallel reporter assay detects cell-type-specific gene regulation. Nat. Genet. 55, 346–354 (2023). [DOI] [PMC free article] [PubMed] [Google Scholar]
- 93.Lalanne J.-B. et al. Multiplex profiling of developmental cis-regulatory elements with quantitative single-cell expression reporters. Nat. Methods 21, 983–993 (2024). [DOI] [PMC free article] [PubMed] [Google Scholar]
- 94.Buenrostro J. D., Giresi P. G., Zaba L. C., Chang H. Y. & Greenleaf W. J. Transposition of native chromatin for fast and sensitive epigenomic profiling of open chromatin, DNA-binding proteins and nucleosome position. Nat. Methods 10, 1213–1218 (2013). [DOI] [PMC free article] [PubMed] [Google Scholar]
- 95.Preissl S. et al. Single-nucleus analysis of accessible chromatin in developing mouse forebrain reveals cell-type-specific transcriptional regulation. Nat. Neurosci. 21, 432–439 (2018). [DOI] [PMC free article] [PubMed] [Google Scholar]
- 96.Love M. I., Huber W. & Anders S. Moderated estimation of fold change and dispersion for RNA-seq data with DESeq2. Genome Biol 15, 550 (2014). [DOI] [PMC free article] [PubMed] [Google Scholar]
- 97.Consortium R. et al. Partitioning heritability by functional annotation using genome-wide association summary statistics. Nat Genet 47, 1228–1235 (2015). [DOI] [PMC free article] [PubMed] [Google Scholar]
- 98.Quinlan A. R. & Hall I. M. BEDTools: a flexible suite of utilities for comparing genomic features. Bioinformatics 26, 841–842 (2010). [DOI] [PMC free article] [PubMed] [Google Scholar]
- 99.Andrews S. FastQC: A Quality Control Tool for High Throughput Sequence Data. https://www.bioinformatics.babraham.ac.uk/projects/fastqc/ (2010).
- 100.Dobin A. et al. STAR: ultrafast universal RNA-seq aligner. Bioinformatics 29, 15–21 (2013). [DOI] [PMC free article] [PubMed] [Google Scholar]
- 101.Zhu A., Ibrahim J. G. & Love M. I. Heavy-tailed prior distributions for sequence count data: removing the noise and preserving large differences. Bioinformatics 35, 2084–2092 (2018). [DOI] [PMC free article] [PubMed] [Google Scholar]
- 102.Ignatiadis N., Klaus B., Zaugg J. B. & Huber W. Data-driven hypothesis weighting increases detection power in genome-scale multiple testing. Nat. Methods 13, 577–580 (2016). [DOI] [PMC free article] [PubMed] [Google Scholar]
- 103.Ward L. D. & Kellis M. HaploReg: a resource for exploring chromatin states, conservation, and regulatory motif alterations within sets of genetically linked variants. Nucleic Acids Res 40, D930–D934 (2012). [DOI] [PMC free article] [PubMed] [Google Scholar]
- 104.Auton A. et al. A global reference for human genetic variation. Nature 526, 68–74 (2015). [DOI] [PMC free article] [PubMed] [Google Scholar]
- 105.Cavalcante R. G. & Sartor M. A. annotatr: genomic regions in context. Bioinformatics 33, 2381–2383 (2017). [DOI] [PMC free article] [PubMed] [Google Scholar]
- 106.Zhbannikov I. Y., Arbeev K., Ukraintseva S. & Yashin A. I. haploR: an R package for querying web-based annotation tools. F1000research 6, 97 (2017). [DOI] [PMC free article] [PubMed] [Google Scholar]
- 107.Ashuach T. et al. MPRAnalyze: statistical framework for massively parallel reporter assays. Genome Biol 20, 183 (2019). [DOI] [PMC free article] [PubMed] [Google Scholar]
- 108.Yao D. et al. Multicenter integrated analysis of noncoding CRISPRi screens. Nat. Methods 21, 723–734 (2024). [DOI] [PMC free article] [PubMed] [Google Scholar]
- 109.Replogle J. M. et al. Combinatorial single-cell CRISPR screens by direct guide RNA capture and targeted sequencing. Nat Biotechnol 38, 954–961 (2020). [DOI] [PMC free article] [PubMed] [Google Scholar]
- 110.Yu G., Wang L.-G., Han Y. & He Q.-Y. clusterProfiler: an R Package for Comparing Biological Themes Among Gene Clusters. OMICS: A J. Integr. Biol. 16, 284–287 (2012). [DOI] [PMC free article] [PubMed] [Google Scholar]
Associated Data
This section collects any data citations, data availability statements, or supplementary materials included in this article.
Supplementary Materials
Supplementary Table 1 | ATAC-seq promoter accessibility in THP-1 cells Genome-wide differential-accessibility statistics for all promoters (±1 kb from the annotated TSS) profiled in THP-1 monocytes and in macrophages that were unstimulated or stimulated with IFN-β, IFN-γ, or LPS+IFN-γ. For each stimulus-versus-resting comparison, the table lists genomic coordinates, base-mean accessibility, log₂-fold change, Wald statistic, and Benjamini–Hochberg-adjusted P value (padj).
Supplementary Table 2 | RNA-seq gene-expression profiles in THP-1 cells Gene-level differential-expression statistics for THP-1 monocytes and macrophages exposed to IFN-β, IFN-γ, or LPS+IFN-γ, alongside the unstimulated macrophage state. For every annotated gene, the table reports transcript ID, gene symbol, base-mean expression, log₂-fold change relative to the baseline, Wald statistic, and Benjamini–Hochberg-adjusted P value (padj).
Supplementary Table 3 | MPRA oligonucleotide library design A complete list of all variants and their corresponding oligonucleotides included in the MPRA designed to test regulatory variants associated with LOAD, with functional annotations for every element.
Supplementary Table 4 | Enhancer activity in MPRAs Enhancer activities for each cis-regulatory element (CRE) measured by MPRA, based on 15 unique barcode replicates per CRE.
Supplementary Table 5 | State-specific enhancer activities in immune-cell MPRAs Differential enhancer activities in THP-1 macrophages and HMC3 microglia following IFN-β, IFN-γ, or LPS+IFN-γ stimulation, reported as log₂-fold change and false-discovery-rate-adjusted P values relative to the resting state.
Supplementary Table 6 | Allelic MPRA effects (emVars) Allelic activity differences (reference versus alternate) for all expression-modulating variants (emVars) identified in the MPRA experiments, including effect size (log₂-fold change) and padj. Log₂-fold changes for major-versus-minor alleles need to be adjusted according to the ‘REFALT_Flip’ indicator listed in Supplementary Table 3.
Supplementary Table 7 | Motif-shuffled effects in MPRAs Transcriptional differences of motif-shuffled CREs relative to the corresponding CREs harboring LOAD genetic variants.
Supplementary Table 8 | State-specific allelic effects in MPRAs Allelic activity differences that are specific to immune stimulation in THP-1 macrophages and HMC3 microglia, with interaction statistics for allele × stimulus effects.
Supplementary Table 9 | Predicted variant effects from machine learning Allele-specific regulatory impact scores from convolutional neural network (CNN) models and splicing-impact scores from SpliceAI for every variant assayed.
Supplementary Table 10 | Prioritized functional variants across cell types Integrated list of high-confidence functional regulatory variants in THP-1 macrophages, mouse brain tissue, HMC3 microglia, and HEK293T cells, combining MPRA and computational predictions.
Supplementary Table 11 | ABC promoter–enhancer links for candidate variants Activity-by-contact (ABC) model results linking candidate variants to putative target promoters in THP-1 macrophages, including ABC scores and genomic coordinates of interacting elements.
Supplementary Table 12 | CRISPRi RNA-seq in THP-1 macrophages Differential gene-expression statistics from CRISPRi perturbations of candidate regulatory elements or their nearest-gene promoters in THP-1 macrophages, reported as log₂-fold change versus non-targeting control and Benjamini–Hochberg-adjusted P values.
Supplementary Table 13 | CNN architecture and training hyper-parameters Layer-by-layer specification of the convolutional neural network used to predict ATAC-seq accessibility. Table details input shape, layer type, kernel size, stride, number of filters/units, activation function, dropout rate, optimizer, learning-rate schedule, batch size, and training epochs.
Supplementary Table 14 | CRISPRi sgRNA designs Sequences and genomic targets of all sgRNAs used for enhancer and promoter knock-downs. For each guide RNA we list the target category (enhancer / promoter / non-targeting / safe-targeting), oligo sequences (5′→3′) and spacer sequences.
Data Availability Statement
Illumina sequencing data were deposited in Gene Expression Omnibus (GEO) with the accession number ***.
Scripts for data analysis are available upon request.