

Abstract
The rapidly advancing field of nanotechnology is driving the development of precise sensing methods at the nanoscale, with solid-state nanopores emerging as promising tools for biomolecular sensing. This study investigates the increased sensitivity of solid-state nanopores achieved by integrating DNA origami structures, leading to the improved analysis of protein translocations. Using holo human serum transferrin (holo-hSTf) as a model protein, we compared hybrid nanopores incorporating DNA origami with open solid-state nanopores. Results show a significant enhancement in holo-hSTf detection sensitivity with DNA origami integration, suggesting a unique role of DNA interactions beyond confinement. This approach holds potential for ultrasensitive protein detection in biosensing applications, offering advancements in biomedical research and diagnostic tool development for diseases with low-abundance protein biomarkers. Further exploration of origami designs and nanopore configurations promises even greater sensitivity and versatility in the detection of a wider range of proteins, paving the way for advanced biosensing technologies.
Graphical Abstract

INTRODUCTION
Contemporary research in the field of biomedical sciences pursues novel therapeutic advancements in disease diagnosis and prevention. Understanding the intricate interactions between DNA and proteins is of great importance for deciphering fundamental biological mechanisms and for identifying protein biomarkers involved in the development of different diseases.1-4 Conventional methodologies for analyzing single molecules, such as footprinting assays,5 EMSA,6 southwestern blotting,7 Y1H phage display,8 and proximity ligation assay (PLA),9 offer good throughput but often lack sensitivity in detecting rare biomolecules. In contrast, sophisticated single molecule techniques, such as atomic force microscopy, single ion channel sensing, optical and magnetic tweezers, and super resolution microscopy, provide high sensitivity but struggle with analyzing large numbers of molecules efficiently,10 prompting the need for innovative approaches. Recent research efforts have focused on understanding the dynamics of DNA origami–protein interactions,11,12 exploring methods to enhance sensitivity and selectivity in detecting protein molecules,13 and elucidating the underlying mechanisms governing these interactions. Studies have utilized a combination of experimental and computational approaches to characterize DNA origami structures,14 investigate their binding kinetics with proteins,15 and engineer tailored nanostructures for certain sensing applications.16
Nanopores are classified into biological and solid-state categories, each offering distinct advantages for single-molecule sensing. While biological nanopores, exemplified by the alphahemolysin toxin,17-19 exhibit natural precision, solid-state nanopores (SSNs) fabricated on solid surfaces offer unparalleled accuracy on single molecule sensing and chemical functionality.20-22 Researchers have improved the sensitivity and specificity of nanopore-based assays and perform accurate analysis of protein translocations and interactions employing precise fabrication,23 surface modification,24 electrochemical control,25 multipore arrays, etc.26 By strategically modifying nanopore surfaces with specific ligands, ligand-capped clusters, or incorporating biological nanomachines, researchers can tailor their sensing properties to detect and analyze biomolecular interactions with high sensitivity and selectivity.27-31 Functionalization allows for the creation of nanopores with specialized binding sites designed to capture target molecules, facilitating the real-time monitoring of DNA–protein interactions.32-34 Additionally, nanopores functionalized for DNA–protein interaction monitoring serve as valuable tools for studying various biological phenomena, including DNA repair mechanisms,35,36 genome stability,37 and protein–protein interactions.38
Exploring DNA–protein interactions using SSN offers a deeper understanding of biomolecular dynamics on the nanoscale. Amidst its decade-long utilization, DNA origami has transitioned into a practical phase, showcasing its versatility in biotechnology applications.39,40 Among the recent applications of DNA origami is its utilization in nanopore technology, an area proposed three decades ago for its potential in single-molecule physics and biomolecule sensing.41,42 DNA origami nanopores serve a dual role in nanopore investigations: enhancing the sensitivity and selectivity of SSN by incorporating DNA origami structures, versatile,43,44 and they also directly function as nanopores themselves.45 Recent studies have demonstrated the effectiveness of DNA origami nanopore traps for protein sensing15,46 as well as optimizing DNA origami design to achieve distinct protein interactions.47,48 Various designs have been explored for applications, such as DNA sequencing,49 single-molecule filtering,16 biosensing,50 and drug delivery,14 showcasing the extensive research efforts in this domain.
This work presents a novel strategy for enhancing the sensitivity of SSN for protein analysis using octahedral DNA origami.51 Our approach involves the electrophoretic trapping of predesigned DNA origami structures within the nanopore, leading to superior sensitivity in single-molecule protein detection. Focusing on the translocation dynamics of holo-hSTf comprised of 679 amino acids with a molecular weight of ~80 kDa,52 a protein with critical roles in DNA repair and genome stability, we demonstrate the effectiveness of our method in improving capture rate and dwell time of target proteins. Furthermore, we investigated the impact of electrolyte type and concentration on the transport mechanism of holo-hSTf through the origami-trapped nanopore. In the context of recent developments, such as the custom-engineered DNA nanopores that demonstrate tunable pore shapes and widths for single-molecule sensing,64 our DNA origami-incorporated hybrid nanopore offers distinct advantages, including enhanced analyte sensitivity, stability under varied conditions, and reduced sensing interference when analytes pass through electron clouds, making it a more versatile tool for precise biomolecular analysis. Our work contributes to the advancement of single-molecule protein analysis and has significant implications for various fields, including biosensing, drug discovery, and fundamental studies of DNA–protein interactions, which are essential for unveiling the molecular mechanisms underlying cellular processes.
EXPERIMENTAL SECTION
Materials.
A Millipore-Sigma Direct Q3 filtering system was used to produce ultrapure type I water (Burlington, MA). Unless specified otherwise, all other chemical reagents and solvents were obtained from Sigma-Aldrich (St. Louis, MO) and used without additional purification.
Nanopore Fabrication.
Using a silicon nitride membrane (NXDB-50B105 V122, Norcada) with a thickness of 12 ± 2 nm and the chemically tuned controlled dielectric breakdown (CT-CDB) approach, a nanopore was fabricated in this work.56,63 To create a seal between two polytetrafluoroethylene flow cells, two silicon nitride chips were placed side by side with poly(dimethylsiloxane) (PDMS) gaskets. A tight seal was guaranteed by the PDMS gaskets. A solution containing 1 M KCl (P9333, Sigma-Aldrich) buffered with 10 mM Tris (J61036, Alfa Aesar) at a pH of ~8 was placed in the flow cell reservoirs. In accordance with prior research,57,63 sodium hypochlorite (425044, Sigma-Aldrich) was added to this solution at a predetermined ratio of 2:9. Ag/AgCl electrodes were inserted into each flow cell half-cell, and the voltage was applied to the solution using a specially designed circuit.
In order to detect the creation of a nanopore, a dramatic spike in current was seen when the voltage was applied across the silicon nitride membrane. The equation below was used to measure the conductance of the solution in the flow cell containing the nanopore and calculate the diameter of the nanopore:
| (1) |
In this case, , , and stand for the electrolyte solution’s conductivity, the nanopore’s nominal thickness, and the diameter of the nanopore, respectively. Short voltage pulses (1–3 s) were used to enlarge the nanopore’s size to reach the required diameter. After the CT-CDB procedure, the solution’s conductance was measured, and it was replaced with particular electrolyte (either 0.5 or 1 M LiCl or KCl) buffered with 10 mM Tris pH ~ 8. Throughout the experiment, baseline current values were taken at every applied voltage to ensure that there were no impurities in the flow cell reservoirs. The technique yielded nanopores that all displayed linear current–voltage curves and ohmic behavior. Eq 1 showed that the diameter of the resultant nanopores was 25 ± 2 nm. Because stable trapping occurrences were seen, a nanopore with a diameter of 25 nm was found to be optimum for DNA origami experiments as opposed to nanopores with a diameter of larger or smaller sizes.
DNA Origami Synthesis.
The octahedron DNA origami frame was designed using the DNA origami design software caDNAano (http://cadnano.org/).58 The edges of the octahedron frame were designed to be six-helix bundles (6HB) with edge lengths of 84 base pairs. DNA origami frames are folded by mixing 40 nM M13mp18 scaffold purchased from Bayou Biolabs, LLC with a 5:1 staple to scaffold ratio. The staple sequences were purchased from Integrated DNA Technologies (IDT). The buffer of this solution is mixed to contain 1X TAE and 12.5 mM magnesium chloride. This mixture is heated to 90 °C and slowly cooled to 20 °C over a period of 20 h to allow for the correct folding of the scaffold sequence into the target 3D DNA origami frame. This protocol is adapted from previous literature,59-61 and was performed on the automated liquid handling workbench, driven by the Tecan Fluent 1080 with on-deck synthesis and characterization instrumentation, located at the Center for Functional Nanomaterials at Brookhaven National Laboratory. The folded DNA origami is washed several times in order to remove the excess staples used during the folding process. The origami samples are washed four times through a Millipore Sigma Amicon Ultra 0.5 mL centrifugal filters in an Eppendorf 5424R (100 kDa cutoff) at a speed of 2k rcf for 15 min using a buffer consisting of (1×) TAE and 12.5 mM magnesium chloride.
Protein Preparation.
Ten micrograms of human holo-transferrin (T0665, Sigma-Aldrich) protein was reconstituted to a 50 μg/mL concentration in sterile 1 × PBS, pH ~ 7.4. A 5 nM concentration of holo-hSTf protein was introduced to the flow cell’s trans side reservoir in order to collect data.
TEM Imaging.
DNA origami samples were placed on a TEM grid and stained with uranyl acetate for negative contrast. The imaging process was carried out using a JEOL 1400 instrument operated at 120 keV at the Center for Functional Nanomaterials, Brookhaven National Laboratory.
Data Collection and Analysis.
The signal was acquired by using an Axopatch 200B amplifier (Molecular Devices, LLC) and digitalized by using a Digidata 1550B device (Molecular Devices). During every experiment, a 250 kHz sampling rate was employed, and the Axopatch 200B’s built-in 10 kHz Bessel filter was utilized to filter the raw data. A constant transmembrane potential of +200 mV was applied throughout the experiments for all data collection (unless stated otherwise). Data was recorded with pCLAMP 11.2 software (Molecular Devices). During the experiment, data was extracted from each event using the resistive pulse analysis software EventPro 3.0. Parameters including resistive pulse depth (ΔI), and duration (Δt) were extracted.62 The data from EventPro 3.0 was further analyzed using the well-known data analysis tool OriginPro 2023, the equations are stated in Section S12.
RESULT AND DISCUSSION
Hybrid Nanopore: DNA Origami Trapping Dynamics.
The study aimed to assess how integrating DNA origami affects single molecule translocation dynamics in SSN, with the hypothesis that DNA origami could improve nanopore sensing capabilities and regulate molecular translocation. Quantitative analyses were conducted by comparing protein translocations through open and origami-functionalized hybrid nanopores across different experimental conditions. Holo-hSTf served as the model single molecule protein for label-free translocation through the nanopores. The experimental setup, detailed in Figure 1, involved step-by-step procedures where flow cells were filled with electrolytes (LiCl or KCl) at varying concentrations (0.5 or 1 M). Baseline current of the bare SSN was recorded over a voltage range from +200 to −200 mV to assess nanopore symmetry (Figure S1). Subsequently, 100 pM DNA origami was introduced to the cis side of the flow cells, and an electric potential of +200 mV was applied to drag it electrophoretically toward the SSN, resulting in a partial current blockade due to an origami trapping onto the SSN. Moving forward, we will use the term “hybrid nanopore” to denote the origami-trapped SSN, and “open nanopore” for the bare SSN, for simplicity. Initially, the origami is electrophoretically trapped (depicted in light blue) onto the pore in an unstable manner. Subsequently, it attempts to settle down, resulting in a stable orientation of the origami to the nanopore. This orientation causes the current to decrease further, accompanied by reduced noise (depicted in dark blue) (also see Figures S3,S6, and S7). However, the hybrid nanopore can be formed without partial blocking by the origami and directly settling down onto the nanopore (Figure S4).
Figure 1.

Experimental setup and representative current traces for the octahedron DNA origami trapped hybrid nanopore, facilitating protein translocations of holo-hSTf. (a) Schematic of origami trapping (first three panels) and holo-hSTf translocation through origami trapped hybrid solid-state nanopore (last panel). A typical open pore current trace (red) before the origami is loaded on the cis side usually gets trapped in the pore with two steps under an applied potential. The short drop in current (light blue) indicates the origami trapped in the nanopore, which, after a few seconds, leads to deeper and longer blockades (dark blue), suggesting stabilization within seconds, allowing it to stably remain in the pore until the electrophoretic force is removed. To study origami–protein interactions, holo-hSTf was added to the trans side of the flow cell under continuous applied potential and an origami being already trapped; a typical current trace of holo-hSTf passing through the hybrid nanopore (teal). A constant transmembrane potential of +200 mV was applied throughout the experiments for all data collection. All of the data were collected with a 10 kHz low pass Bessel filter with a sampling frequency of 250 kHz. (b) Measurement of open pore conductance in the nanopore with 0.5 M (red) and 1 M LiCl (green), where represents the conductance of open nanopore and represents the conductance of hybrid nanopore. Conductance after a single origami is trapped in 0.5 M LiCl (dark blue) and 1 M LiCl (orange) is only recorded at positive voltage bias, as they exit at opposite bias. (c) A typical platonic octahedron wire-frame DNA origami structure. (d) TEM image of DNA origami octahedra.
A constant positive potential maintained origami trapping while holo-hSTf (5 nM) was added to the trans side of the flow cells, resulting in further current blockade spikes as holo-hSTf translocated through the hybrid nanopore, as illustrated in Figure 1a (depicted in teal) (also refer to Figures S3 and S5). The rationale behind the addition of the holo-hSTf proteins into the trans side is the dominant electro-osmotic force in a lower salt concentration electrolytic environment, as shown in a comparative study performed by Saharia et al.53 Figure 1b illustrates current–voltage (IV) measurements at 0.5 and 1 M LiCl concentrations, both for open nanopore and hybrid nanopore, across voltages from −200 mV to +200 mV with a 40 mV step. A comparison of IV curves in 1 M LiCl between the open nanopore (green) and hybrid nanopore (orange) reveals a decrease in conductance from 111.38 to 92.73 nS after origami trapping, confirming the single DNA origami trap. Similarly, in 0.5 M LiCl, the IV curves for the open nanopore (red) and hybrid nanopore SSN (dark blue) indicate a conductance drop from 66.29 to 51.06 nS. Notably, IV curves for the hybrid nanopore in both 0.5 M LiCl (dark blue) and 1 M LiCl (orange) do not extend to the negative side of the graph due to electrophoretic trapping of origami onto the open SSN; applying a negative potential would release the origami, leaving the bare nanopore. Figure 1c is a 3D model of a standard platonic octahedron DNA origami structure, comprising around 6000 double-stranded DNA base pairs and 1500 single-stranded bases, totaling approximately 13,500 negatively charged bases per structure, with each strut measuring roughly 30 nm in length.51 The characterization of octahedron wire-frame DNA origami was done by TEM imaging depicted in Figure 1d and S2). In this study, we examined and analyzed the attributes of holo-hSTf protein sensing under electrolytic conditions of 0.5 and 1 M LiCl and KCl, pH 8 employing both open nanopore and hybrid nanopore methodologies. Our investigation highlights the superiority of the hybrid nanopore over open nanopore sensing for protein sensing.
Comparative Analysis of Current Blockades, Dwell Times, and Event Area.
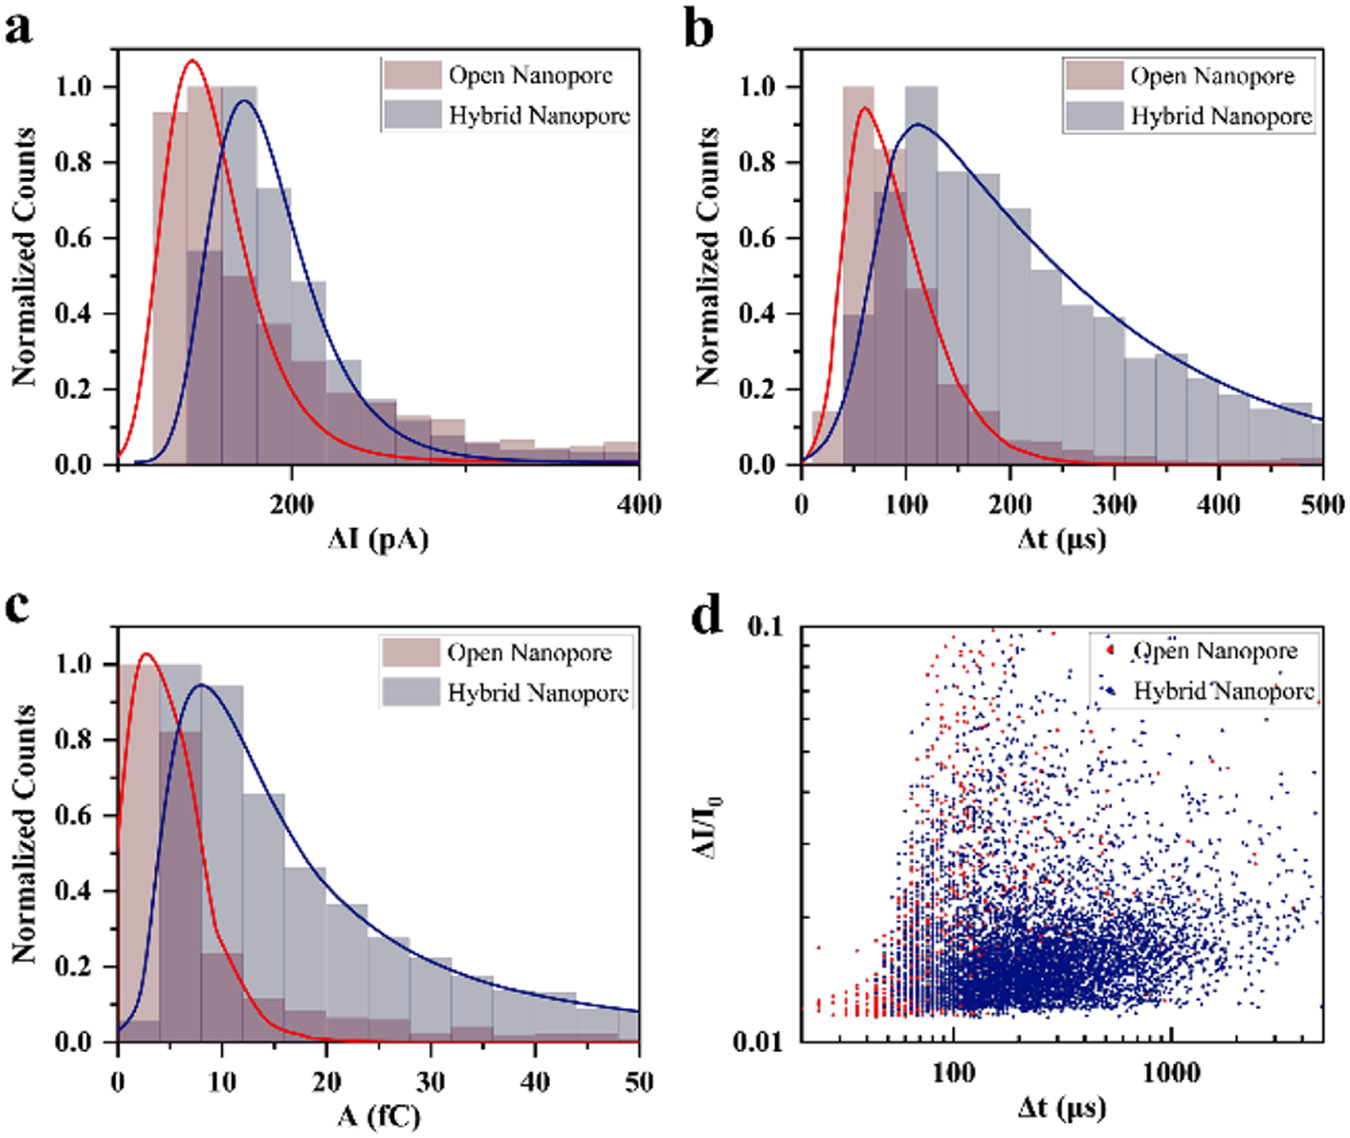
The quantitative analysis of holo-hSTf protein interactions with open and hybrid nanopores using 0.5 M LiCl electrolyte at +200 mV is depicted in Figure 2. The data convincingly demonstrates that the trapped origami significantly enhances the nanopore’s sensitivity for holo-hSTf detection, as evident in deeper current blockades, prolonged dwell times, and a larger overall event area. Figure 2a displays the current blockade distributions, with the red peak representing the open pore and the dark blue peak corresponding to the hybrid nanopore. The hybrid nanopore exhibits a higher mean current blockade (186.9 pA vs 130.92 pA), indicating that the protein spends more time within the confined space, experiencing deeper blockades and generating stronger signals. This enhanced interaction likely arises from nonspecific charge interactions between the protein and the DNA origami structure (Figure S9). Figure 2b compares the dwell time distributions, revealing a clear distinction. The open pore distribution (red) is narrower, indicating a more uniform range of translocation times. In contrast, the hybrid pore distribution (dark blue) is broader and shifted toward longer dwell times (197.23 μs vs 95.27 μs), signifying a wider range of translocation times. This suggests that the presence of origami restricts or slows the protein’s movement, leading to more consistent and prolonged interactions with the nanopore, potentially due to steric or nonspecific electrostatic interactions. Figure 2c presents the event area analysis, which combines the current blockade and dwell time to provide a comprehensive measure of the protein-nanopore interaction strength. The term “Event area” refers to the integral of the current blockage over time during a nanoparticle translocation event, measured in femtocoulombs (fC). The trapped origami distribution (dark blue) shows a significant shift toward higher event areas (9.44 fC vs 4.44 fC) compared to the open pore (red). This substantial increase reflects the combined effect of deeper blockades and longer dwell times achieved with the hybrid nanopore, resulting in a markedly improved signal-to-noise ratio and detection sensitivity. Figure 2d depicts that the hybrid nanopore data (dark blue) form a tighter cluster compared to the open pore data (red), indicating a stronger and more consistent relationship between interaction depth and duration. This further supports the notion that origami confines the protein, leading to more detectable translocation events. Notably, the trapped origami data exhibits a wider range of dwell times at higher blockades, suggesting the possibility of multiple interaction modes or conformational changes within the origami structure. Further experiments and analysis have been performed with different nanopore sizes at 0.5 M LiCl and 10 mM Tris pH ~ 8 to support the results discussed in this study (Figures S14 and S15).
Figure 2.

Quantitative analysis of DNA origami and holo-hSTf interactions. (a) Current blockades distribution of holo-hSTf protein through an open pore (red) and through a hybrid nanopore (dark blue). (b) Dwell time distribution of holo-hSTf protein in an open pore and through a trapped origami. (c) Event area analysis revealing distinct characteristics in hybrid nanopore. In all the figures (a–c), solid line represents the fitted curve of the histogram. (d) Correlation analysis: scatter plot depicting relative current blockade vs dwell time of translocation holo-hSTf (number of events > 3163) in an open pore (red circle) and hybrid pore (blue diamond). All the data were taken by adding 100 pM DNA origami to the cis side and 5 nM holo-hSTf to the trans side in symmetric electrolyte of 0.5 M LiCl, 10 mM tris, pH ~ 8.0, using ~25 nm SSN.
Influence of Salt Concentration and Electrolyte Type.
The comparative analysis of holo-hSTf protein translocations through open and hybrid nanopore in both 0.5 and 1 M LiCl and KCl electrolytes at +200 mV transmembrane potential presented in Figure 3 demonstrates a broad understanding of the influence of salt concentration and electrolyte type. As summarized in Table S1, the data confirm a significant enhancement in detection sensitivity offered by the hybrid nanopore. This is evident in deeper current blockades (ranging from 130.92 pA to 642.39 pA), prolonged dwell times (ranging from 95.27 to 262.01 μs), and larger event areas (ranging from 4.44 fC to 37.57 fC) observed across various electrolyte conditions. Comparing the left and right columns of Figure 3 reveals the impact of the hybrid nanopore. In both 0.5 and 1 M KCl, the hybrid nanopore (orange) consistently exhibits higher mean current blockades; for example, 642.39 pA in 1 M KCl compared to 178.78 pA in the open nanopore, indicating stronger protein–DNA interactions (refer to Figures S9-S12). This suggests that KCl, a kosmotropic ion, promotes favorable interactions between the protein and origami structure. The differences in current blockades (mean values ranging from 130.92 pA to 642.39 pA), dwell times (mean values ranging from 95.27 to 262.01 μs), and event areas (mean values ranging from 4.44 fC to 37.57 fC) observed between 0.5 and 1 M concentrations are relatively minor compared to the overall effect of the DNA origami trap.
Figure 3.

Comparative analysis of holo-hSTf translocations through open and hybrid nanopores in 0.5 and 1 M LiCl and KCl electrolytes of pH ~ 8. In the left column, a–c) are the distributions obtained from the data taken using 0.5 M LiCl (number of events > 3163) and KCl (number of events > 1405) electrolytes. In the right column, (d–f) are the distributions obtained from the data taken using 1 M LiCl (number of events > 2203) and KCl (number of events > 1923) electrolytes. (a) and (d) represent the current blockade distribution of translocating holo-hSTf through open and hybrid nanopore, (b) and (e) represent their dwell time distributions, and (c) and (f) are the distributions of the event area. All the data are taken using LiCl through open nanopore are represented in red, while translocations through hybrid nanopores are depicted in blue. Likewise, translocations in KCl through open SSN are represented in green, and through hybrid nanopores in orange. Dashed lines indicate the histogram obtained from the raw data of holo-hSTf translocations, while solid lines with respective colors represents the fitted curves.
This confirms that DNA origami plays a dominant role in enhancing sensitivity, regardless of minor changes in electrolyte concentration within the chosen range. Figure 3a,b showcase the current blockade and dwell time distributions in 0.5 M salt concentration, and Figure 3d,e depict the current blockade and dwell time distributions in 1 M salt concentration, respectively. In both LiCl and KCl, the hybrid nanopore (dark blue and orange) consistently displays deeper current blockades (e.g., in 0.5 and 1 M KCl the hybrid nanopore exhibits a broader distribution of blockades with longer tails compared to the open nanopore) and longer dwell times (e.g., in 0.5 and 1 M KCl, the hybrid nanopore has a significantly longer dwell time compared to both LiCl conditions) compared to the open nanopore (red and green). This aligns with the observations in Figure 2 and further supports the effectiveness of the origami trap in enhancing the protein signal. The most striking difference is observed in both 0.5 and 1 M KCl (Figure 3b,d, orange), where the dwell time for the hybrid nanopore is significantly longer compared to both LiCl conditions and even the open nanopore in KCl. This extended interaction time further strengthens the case for KCl-induced favorable interactions between the protein and the DNA origami. Figure 3c,f depict the event area distributions. In both LiCl and KCl, the hybrid nanopore distributions (blue and orange) display clear shifts toward larger event areas (e.g., in 1 M KCl, the hybrid nanopore distribution shows a significantly larger peak compared to the open nanopore) compared to the open nanopore (red and green). This signifies a combined effect of deeper blockades and longer dwell times achieved with the origami, leading to a markedly improved signal-to-noise ratio and detection sensitivity (refer to Figures S9-S12 for additional details). Although, it is challenging to trap the DNA origami in 1 M KCl at +200 mV (see Figure S8), the increase in event area is more pronounced in 1 M KCl (Figure 3f, orange) compared to other conditions, further confirming the positive influence of KCl on the interaction between the protein and DNA origami structure. The correlation analysis of protein translocation dynamics presented with the help of scatter plots (Figure S13) and Kruskal–Wallis Test55 analysis to further strengthens the findings.
Statistical Analysis of Translocation Parameters.
Expanding on the insights gained from Figure 3, we explore into a more detailed statistical examination of translocation parameters concerning the interaction of holo-hSTf protein with both open and hybrid nanopores across different LiCl and KCl salt concentrations (0.5 and 1 M) (Figure 4). This quantitative analysis sheds light on the combined influence of salt concentration and the DNA origami trap on protein detection sensitivity. Figure 4a-c presents the mean current blockade, mean dwell time, and mean event area, respectively, for both open and hybrid nanopores in different electrolytes. These values are extracted from the fitted curves of the distributions shown in Figure 3. A general trend emerges across both LiCl and KCl: mean current blockade and event area tend to increase slightly with higher salt concentration, regardless of the presence of the origami trap, which is presented in Figure 4a,c, respectively. This indicates that higher ionic strength generally strengthens the interaction between the protein and the nanopore, likely due to improved conductivity and reduced electrostatic repulsion. However, Figure 4b reveals a contrasting effect of the salt concentration on the mean dwell time. For LiCl, both open and hybrid nanopores exhibit decreasing dwell times with increasing concentration. On the other hand, for KCl, both open and hybrid nanopores show an increase in dwell time. These differing trends indicate that the relationship between salt ions, the protein, and the complex DNA origami structure is intricate and varies depending on the specific type of electrolyte present. Figure 4d presents the mean capture rate, reflecting the frequency of successful protein capture events by the nanopore.
Figure 4.

Statistical analysis of translocation parameters in LiCl and KCl solutions (0.5 and 1 M). (a–c) Comparative means analysis extracted from fitted curves: (a) mean current drop analysis, (b) mean dwell time analysis, and (c) mean event area analysis. (d) Illustration of the capture rate of the holo-hSTf with respect to salt concentration in both LiCl and KCl through open nanopore and hybrid nanopore. (e) and (f) show the mean current blockade and dwell time, respectively, versus pore diameter in 0.5 M LiCl and 0.5 M KCl. In all plots, translocations in LiCl through SSNs are represented in red, while translocations through hybrid nanopores are depicted in dark blue. Translocations in KCl through open nanopores are represented in green and through hybrid nanopores in orange. This comprehensive analysis provides insight into the statistical significance of translocation parameters, enhancing our understanding of the influence of the salt concentration on solid-state nanopore dynamics. Error bars represent the inter-nanopore variability observed from multiple experiments using different nanopores under the same conditions.
Consistent with the trends in other panels, the capture rate increases linearly with increasing salt concentration for both LiCl and KCl, indicating an overall improved detection sensitivity at higher salt conditions. Notably, the origami trap consistently enhances the capture rate at both concentrations compared to that of the open nanopore, further highlighting its effectiveness in promoting protein–nanopore interactions. The higher capture rate observed with the hybrid nanopore compared with the open nanopore likely stems from a combined effect. In the absence of origami (open pore), strong electrostatic repulsion from the negatively charged nanopore walls can hinder the protein’s initial approach and entry. The origami might introduce a more favorable electrostatic environment potentially through shielding the nanopore’s negative charge,54 creating a localized region with reduced repulsion near the entrance, facilitating initial protein–nanopore interaction. The origami’s structure and charge distribution might create a steering effect through electro-osmotic force,15 directing the negatively charged protein toward the pore opening despite the overall repulsion. Additional analysis supporting these results, including the impact of voltage on the capture rate, is provided in Figure S17. Figure 4e,f further elucidates the relationship between nanopore size and key translocation parameters using data from six different pore sizes derived from three distinct nanopores. After trapping the origami, the conductance of the nanopores decreases, effectively reducing the pore size due to partial blockage by the origami. Specifically, the original open nanopore sizes are 23.2, 25.4, and 26.1 nm, which reduce to 17.7, 23.2, and 23.4 nm, respectively, when transformed into hybrid nanopores. Figure 4e reveals a trend where smaller pore sizes correspond to increased mean current blockades. This suggests that smaller nanopores facilitate greater disruption of ionic flow during translocation events, likely due to a smaller cross-sectional area, allowing the translocating protein to interact more with the hybrid nanopore. Figure 4f indicates that mean dwell time generally decreases with increasing pore size in the open nanopore but increases in the hybrid nanopore. This inverse relationship implies that proteins translocate more quickly through larger nanopores, but slower in hybrid nanopore, potentially due to increased interaction time with the origami and nanopore walls. However, outliers observed between the pores could be attributed to several factors, including protein aggregation, potential differences in the surface properties or electrostatic interactions as well as possible variations in experimental conditions or calibration drift over time. Together, these additional analyses underscore the significant impact of nanopore size on the sensing performance, highlighting the balance between sensitivity and translocation dynamics across different nanopore dimensions.
Enhanced Sensitivity in Matched Conductance Hybrid Nanopores.
The remarkable ability of DNA origami trapping to enhance the sensitivity of SSNs for holo-hSTf protein detection, even when the pore conductances are identical, has been quantitatively analyzed in Figure 5. This finding highlights the unique advantages of the origami-based approach beyond simply confining the protein within the nanopore. Figures 5a-c showcases the distributions of current blockade, dwell time, and event area for holo-hSTf translocations through open nanopore (red) and hybrid nanopore (dark blue) with the same conductance. Despite the identical conductance, the hybrid nanopore consistently exhibits deeper current blockades (172.67 pA vs 142.9 pA), longer dwell times (145.86 μs vs 66.66 μs), and larger event areas (9.5 fC vs 3.36 fC) compared to the open nanopore. This remarkable enhancement in sensitivity can be attributed solely to the role of the origami structure in modulating protein–nanopore interactions. The wider spread of dwell times observed in the scatter plot of Figure 5d for the hybrid nanopore suggests that origami introduces heterogeneity in interaction dynamics. This diversity could arise from nonspecific charge interactions within the origami structure, conformational changes induced by the protein, or transient interactions that prolong the translocation event. Additionally, the origami might create a more confined and structured environment within the nanopore, leading to more efficient blockade and signal generation. The finding that DNA origami trapping enhances sensitivity even with matched pore conductance opens exciting possibilities for tailoring nanopore biosensors. By designing origami structures with individual functionalities, researchers can potentially target and manipulate protein–nanopore interactions to achieve ultrasensitive and selective detection. Further experiments and analysis have been conducted with ~26 nm open nanopores, resulting in conductance equivalent to ~20 nm nanopores due to DNA origami incorporation. These were then compared to the translocations of holo-hSTf through ~20 nm open nanopores at 0.5 M LiCl 10 mM Tris pH ~ 8 to support the results discussed in this study (see Figure S16).
Figure 5.
Comparative analysis of holo-hSTf translocations through open and hybrid nanopores having the same conductance. (a) Current blockades distribution of holo-hSTf protein in an open pore (red) and through a trapped origami (dark blue). (b) Dwell time distribution of holo-hSTf protein in an open pore and through a hybrid nanopore. (c) Event area analysis revealing distinct characteristics in hybrid nanopores. In all the panels (a–c), solid lines represent the fitted curve of the histogram. (d) Correlation analysis: scatter plot depicting relative current blockade vs dwell time of translocation holo-hSTf in an open pore (red circle) and origami trapped (blue diamond) pore. The data set that represents the origami trap was collected after a ~25 nm pore was fabricated and then trapping an origami onto the pore, resulting conductance is equivalent to a ~23 nm open nanopore. Although the open pore and hybrid pore both have similar conductance, the hybrid pore has shown enhanced sensitivity.
CONCLUSION
In summary, this study systematically explored the impact of integrating DNA origami into the SSN on single molecule translocation dynamics. The findings indicate that DNA origami significantly improves nanopore sensing capabilities, enhancing sensitivity and detection specificity for protein molecules like holo-hSTf. The hybrid nanopore consistently showed deeper current blockades, prolonged dwell times, and larger event areas compared to those of open nanopores across various electrolyte conditions. This sensitivity enhancement was evident regardless of minor changes in the electrolyte concentration, highlighting the dominant role of DNA origami in modulating protein–nanopore interactions. Moreover, the origami-based approach introduced heterogeneity in interaction dynamics, potentially through nonspecific charge interactions or conformational changes within the origami structure. Notably, even when the conductance was matched, the hybrid nanopore outperformed open nanopores, emphasizing the discrete role of DNA origami in enhancing detection sensitivity. These findings suggest promising avenues for tailoring nanopore biosensors through the precise design and functionalization of DNA origami structures, with implications for ultrasensitive and selective detection in biomedical research and beyond. Further exploration of origami designs, electrolyte compositions, and nanopore materials could lead to the development of advanced biosensing platforms with enhanced performance and versatility.
Supplementary Material
The Supporting Information is available free of charge at https://pubs.acs.org/doi/10.1021/acs.analchem.4c02016.
Typical current traces of open and hybrid nanopore, DNA origami trapping events, single event comparison, along with the quantitative analysis with different nanopore sizes; capture rate of holo-hSTf as a function of applied potential; further analysis and control experiments, such as quantitative comparison of translocations through open pore and hybrid pore, comparison of translocations in matched conductance hybrid nanopores, comparison of holo-hstf proteins capture rate, and Kruskal–Wallis Test (PDF)
ACKNOWLEDGMENTS
This work was supported by the National Science Foundation (CBET #2022398 and CBET #2041340), the National Institutes of Health (1R01GM149949-01), the Nano & Material Technology Development Program through the National Research Foundation of Korean (NRF) funded by Ministry of Science and ICT (RS-2024-00449882). The DNA assembly work was supported by the DOE, the Office of Basic Energy Sciences, grant DE-SC0008772. The authors would also like to acknowledge Matthew O’Donohue and Navod Thyashan for their insightful discussion and technical support.
Footnotes
The authors declare no competing financial interest.
Contributor Information
Kamruzzaman Joty, Department of Mechanical Engineering, Southern Methodist University, Dallas, Texas 75205, United States.
Madhav L. Ghimire, Department of Mechanical Engineering, Southern Methodist University, Dallas, Texas 75205, United States
Jason S. Kahn, Center for Functional Nanomaterials, Brookhaven National Laboratory, New York 11973, United States
Sangyoup Lee, Bionics Research Center, Korea Institute of Science and Technology Biomedical Research Division, Seoul 02792, Republic of Korea.
George Alexandrakis, University of Texas at Arlington, Department of Bioengineering, Arlington, Texas 76019, United States.
Min Jun Kim, Lyle School of Engineering, Applied Science Program and Department of Mechanical Engineering, Southern Methodist University, Dallas, Texas 75205, United States.
REFERENCES
- (1).Chen Z; Wang C; Hao L; Gao R; Li F; Liu S Biosens. Bioelectron 2019, 128, 104–112. [DOI] [PubMed] [Google Scholar]
- (2).Meunier-Prest R; Bouyon A; Rampazzi E; Raveau S; Andreoletti P; Cherkaoui-Malki M Biosens. Bioelectron 2010, 25 (12), 2598–2602. [DOI] [PubMed] [Google Scholar]
- (3).Diculescu VC; Chiorcea-Paquim A-M; Oliveira-Brett AM TrAC, Trends Anal. Chem 2016, 79, 23–36. [Google Scholar]
- (4).Song S; Wang L; Li J; Fan C; Zhao J TrAC, Trends Anal. Chem 2008, 27 (2), 108–117. [Google Scholar]
- (5).Vierstra J; Stamatoyannopoulos JA Nat. Methods 2016, 13 (3), 213–221. [DOI] [PubMed] [Google Scholar]
- (6).Hellman LM; Fried MG Nat. Protoc 2007, 2 (8), 1849–1861. [DOI] [PMC free article] [PubMed] [Google Scholar]
- (7).Jia Y; Nagore L; Jarrett H Southwestern Blotting Assay. In DNA-Protein Interactions, Leblanc BP; Rodrigue S; Springer: New York, NY, 2015; pp. 8599. DOI: . [DOI] [PMC free article] [PubMed] [Google Scholar]
- (8).Dey B; Thukral S; Krishnan S; Chakrobarty M; Gupta S; Manghani C; Rani V Mol. Cell. Biochem 2012, 365 (1), 279–299. [DOI] [PubMed] [Google Scholar]
- (9).Alam MS Curr. Protoc. Immunol 2018, 123 (1), No. e58. [DOI] [PMC free article] [PubMed] [Google Scholar]
- (10).Squires AH; Gilboa T; Torfstein C; Varongchayakul N; Meller A Methods Enzymol. 2017, 582, 353–385. [DOI] [PubMed] [Google Scholar]
- (11).Kong G; Xiong M; Liu L; Hu L; Meng H-M; Ke G; Zhang X-B; Tan W Chem. Soc. Rev 2021, 50 (3), 1846–1873. [DOI] [PubMed] [Google Scholar]
- (12).Knappe GA; Wamhoff E-C; Bathe M Nat. Rev. Mater 2023, 8 (2), 123–138. [DOI] [PMC free article] [PubMed] [Google Scholar]
- (13).Liu L; Wu H-C Angew. Chem., Int. Ed 2016, 55 (49), 15216–15222. [DOI] [PubMed] [Google Scholar]
- (14).Khosravi R; Ghasemi RH; Soheilifard R Mol. Biotechnol 2020, 62 (9), 423–432. [DOI] [PubMed] [Google Scholar]
- (15).Wen C; Bertosin E; Shi X; Dekker C; Schmid S Nano Lett. 2023, 23 (3), 788–794. [DOI] [PMC free article] [PubMed] [Google Scholar]
- (16).Pal S; Naik A; Rao A; Chakraborty B; Varma MM ACS Appl. Nano Mater 2022, 5 (7), 8804–8810. [Google Scholar]
- (17).Song L; Hobaugh MR; Shustak C; Cheley S; Bayley H; Gouaux JE Science 1996, 274 (5294), 1859–1866. [DOI] [PubMed] [Google Scholar]
- (18).Robertson JWF; Ghimire ML; Reiner JE Biochim. Biophys. Acta, Biomembr 2021, 1863 (9), 183644. [DOI] [PMC free article] [PubMed] [Google Scholar]
- (19).Ghimire ML; Gibbs DR; Mahmoud R; Dhakal S; Reiner JE Anal. Chem 2022, 94 (28), 10027–10034. [DOI] [PubMed] [Google Scholar]
- (20).Xue L; Yamazaki H; Ren R; Wanunu M; Ivanov AP; Edel JB Nat. Rev. Mater 2020, 5 (12), 931–951. [Google Scholar]
- (21).Yuan Z; Wang C; Yi X; Ni Z; Chen Y; Li T Nanoscale Res. Lett 2018, 13 (1), 56. [DOI] [PMC free article] [PubMed] [Google Scholar]
- (22).Garaj S; Hubbard W; Reina A; Kong J; Branton D; Golovchenko JA Nature 2010, 467 (7312), 190–193. [DOI] [PMC free article] [PubMed] [Google Scholar]
- (23).Zeng X; Xiang Y; Liu Q; Wang L; Ma Q; Ma W; Zeng D; Yin Y; Wang D Nanomaterials 2021, 11 (8), 1942. [DOI] [PMC free article] [PubMed] [Google Scholar]
- (24).Hu R; Tong X; Zhao Q Adv. Healthcare Mater 2020, 9 (17), 2000933. [DOI] [PubMed] [Google Scholar]
- (25).Wang G; Wang L; Han Y; Zhou S; Guan X Acc. Chem. Res 2013, 46 (12), 2867–2877. [DOI] [PubMed] [Google Scholar]
- (26).Chen K; Choudhary A; Sandler SE; Maffeo C; Ducati C; Aksimentiev A; Keyser UF Adv. Mater 2023, 35 (12), 2207434. [DOI] [PubMed] [Google Scholar]
- (27).Lee K; Park K-B; Kim H-J; Yu J-S; Chae H; Kim H-M; Kim K-B Adv. Mater 2018, 30 (42), 1704680. [DOI] [PubMed] [Google Scholar]
- (28).Wang X; Thomas T-M; Ren R; Zhou Y; Zhang P; Li J; Cai S; Liu K; Ivanov AP; Herrmann A; Edel JB J. Am. Chem. Soc 2023, 145 (11), 6371–6382. [DOI] [PMC free article] [PubMed] [Google Scholar]
- (29).Ghimire ML; Cox BD; Winn CA; Rockett TW; Schifano NP; Slagle HM; Gonzalez F; Bertino MF; Caputo GA; Reiner JE ACS Nano 2022, 16 (10), 17229–17241. [DOI] [PMC free article] [PubMed] [Google Scholar]
- (30).Cox BD; Ghimire ML; Bertino MF; Reiner JE ACS Appl. Nano Mater 2020, 3 (8), 7973–7981. [Google Scholar]
- (31).Rockett TW; Almahyawi M; Ghimire ML; Jonnalagadda A; Tagliaferro V; Seashols-Williams SJ; Bertino MF; Caputo GA; Reiner JE ACS Sens. 2024, 9 (2), 860–869. [DOI] [PMC free article] [PubMed] [Google Scholar]
- (32).Lepoitevin M; Ma T; Bechelany M; Janot J-M; Balme S Adv. Colloid Interface Sci 2017, 250, 195–213. [DOI] [PubMed] [Google Scholar]
- (33).Iqbal SM; Akin D; Bashir R Nat. Nanotechnol 2007, 2 (4), 243–248. [DOI] [PubMed] [Google Scholar]
- (34).Haque F; Li J; Wu H-C; Liang X-J; Guo P Nano Today 2013, 8 (1), 56–74. [DOI] [PMC free article] [PubMed] [Google Scholar]
- (35).Kowalczyk SW; Hall AR; Dekker C Nano Lett. 2010, 10 (1), 324–328. [DOI] [PubMed] [Google Scholar]
- (36).Wang F; Zahid OK; Swain BE; Parsonage D; Hollis T; Harvey S; Perrino FW; Kohli RM; Taylor EW; Hall AR Nano Lett. 2017, 17 (11), 7110–7116. [DOI] [PMC free article] [PubMed] [Google Scholar]
- (37).Healy K; Schiedt B Nanomedicine 2007, 2 (6), 875–897. [DOI] [PubMed] [Google Scholar]
- (38).Kwak D-K; Chae H; Lee M-K; Ha J-H; Goyal G; Kim MJ; Kim K-B; Chi S-W Angew. Chem., Int. Ed 2016, 55 (19), 5713–5717. [DOI] [PubMed] [Google Scholar]
- (39).Thomsen RP; Malle MG; Okholm AH; Krishnan S; Bohr SS-R; Sørensen RS; Ries O; Vogel S; Simmel FC; Hatzakis NS; Kjems J Nat. Commun 2019, 10 (1), 5655. [DOI] [PMC free article] [PubMed] [Google Scholar]
- (40).Endo M; Yang Y; Sugiyama H Biomater. Sci 2013, 1 (4), 347–360. [DOI] [PubMed] [Google Scholar]
- (41).Bell NA; Engst CR; Ablay M; Divitini G; Ducati C; Liedl T; Keyser UF Nano Lett. 2012, 12 (1), 512–517. [DOI] [PubMed] [Google Scholar]
- (42).Wei R; Martin TG; Rant U; Dietz H Angew. Chem 2012, 124 (20), 4948–4951. [DOI] [PubMed] [Google Scholar]
- (43).Hernández-Ainsa S; Keyser UF Nanoscale 2014, 6 (23), 14121–14132. [DOI] [PubMed] [Google Scholar]
- (44).Chen K; Keyser UF Solid-State Nanopore Sensing Enhanced by Designed DNA Nanostructures. In Solid State Nanopores: From Fabrication to Biosensing, Leburton J-P, Ed.; Nanostructure Science and Technology; Springer International Publishing: Cham, 2023; pp. 117131. DOI: . [Google Scholar]
- (45).Bell NAW; Keyser UF FEBS Lett. 2014, 588 (19), 3564–3570. [DOI] [PubMed] [Google Scholar]
- (46).Schmid S; Stömmer P; Dietz H; Dekker C Nat. Nanotechnol 2021, 16 (11), 1244–1250. [DOI] [PubMed] [Google Scholar]
- (47).Huang J; Suma A; Cui M; Grundmeier G; Carnevale V; Zhang Y; Kielar C; Keller A Small Struct. 2020, 1 (1), 2000038. [Google Scholar]
- (48).Shen Q; Xiong Q; Zhou K; Feng Q; Liu L; Tian T; Wu C; Xiong Y; Melia TJ; Lusk CP; Lin CJ Am. Chem. Soc 2023, 145 (2), 1292–1300. [DOI] [PMC free article] [PubMed] [Google Scholar]
- (49).Hernández-Ainsa S; Bell NAW; Thacker VV; Göpfrich K; Misiunas K; Fuentes-Perez ME; Moreno-Herrero F; Keyser UF ACS Nano 2013, 7 (7), 6024–6030. [DOI] [PubMed] [Google Scholar]
- (50).Raveendran M; Lee AJ; Sharma R; Wälti C; Actis P Nat. Commun 2020, 11 (1), 4384. [DOI] [PMC free article] [PubMed] [Google Scholar]
- (51).Kahn JS; Xiong Y; Huang J; Gang O JACS Au 2022, 2 (2), 357–366. [DOI] [PMC free article] [PubMed] [Google Scholar]
- (52).Welch S. Transferrin: The Iron Carrier; CRC Press, 1992. [Google Scholar]
- (53).Saharia J; Bandara YMNDY; Karawdeniya BI; Hammond C; Alexandrakis G; Kim MJ RSC Adv. 2021, 11 (39), 24398–24409. [DOI] [PMC free article] [PubMed] [Google Scholar]
- (54).Iwabuchi S; Kawamata I; Murata S; Nomura SMA Chem. Commun 2021, 57 (24), 2990–2993. [DOI] [PubMed] [Google Scholar]
- (55).Ostertagová E; Ostertag O; Kováč J Appl. Mech. Mater 2014, 611, 115–120. [Google Scholar]
- (56).Saharia J; Bandara YMNDY; Karawdeniya BI; Alexandrakis G; Kim MJ Electrophoresis 2021, 42 (7), 899–909. [DOI] [PMC free article] [PubMed] [Google Scholar]
- (57).Bandara YMNDY; Saharia J; Karawdeniya BI; Hagan JT; Dwyer JR; Kim MJ Nanotechnology 2020, 31 (33), 335707. [DOI] [PubMed] [Google Scholar]
- (58).Douglas SM; Marblestone AH; Teerapittayanon S; Vazquez A; Church GM; Shih WM Nucleic Acids Res. 2009, 37 (15), 5001–5006. [DOI] [PMC free article] [PubMed] [Google Scholar]
- (59).Tian Y; Lhermitte JR; Bai L; Vo T; Xin HL; Li H; Li R; Fukuto M; Yager KG; Kahn JS; Xiong Y; Minevich B; Kumar SK; Gang O Nat. Mater 2020, 19 (7), 789–796. [DOI] [PubMed] [Google Scholar]
- (60).Tian Y; Wang T; Liu W; Xin HL; Li H; Ke Y; Shih WM; Gang O Nat. Nanotechnol 2015, 10 (7), 637–644. [DOI] [PMC free article] [PubMed] [Google Scholar]
- (61).Liu W; Tagawa M; Xin HL; Wang T; Emamy H; Li H; Yager KG; Starr FW; Tkachenko AV; Gang O Science 2016, 351 (6273), 582–586. [DOI] [PMC free article] [PubMed] [Google Scholar]
- (62).Bandara YMNDY; Saharia J; Karawdeniya BI; Kluth P; Kim MJ Anal. Chem 2021, 93 (34), 11710–11718. [DOI] [PubMed] [Google Scholar]
- (63).Bandara YMNDY; Karawdeniya BI; Saharia J; Kim MJ; Dwyer JR Ohmic Nanopore Fabrication and Real-time Cleaning US 11,981,557 B2, 2024.
- (64).Xing Y; Dorey A; Jayasinghe L; Howorka S Nat. Nanotechnol 2022, 17, 708–713. [DOI] [PubMed] [Google Scholar]
Associated Data
This section collects any data citations, data availability statements, or supplementary materials included in this article.