

Abstract
OBJECTIVE:
To develop a three-dimensional computer model to predict levator ani muscle stretch during vaginal birth.
METHODS:
Serial magnetic resonance images from a healthy nulliparous 34-year-old woman, published anatomic data, and engineering graphics software were used to construct a structural model of the levator ani muscles along with related passive tissues. The model was used to quantify pelvic floor muscle stretch induced during the second stage of labor as a model fetal head progressively engaged and then stretched the iliococcygeus, pubococcygeus, and puborectalis muscles.
RESULTS:
The largest tissue strain reached a stretch ratio (tissue length under stretch/original tissue length) of 3.26 in medial pubococcygeus muscle, the shortest, most medial and ventral levator ani muscle. Regions of the ileococcygeus, pubococcygeus, and puborectalis muscles reached maximal stretch ratios of 2.73, 2.50, and 2.28, respectively. Tissue stretch ratios were proportional to fetal head size: For example, increasing fetal head diameter by 9% increased medial pubococcygeus stretch by the same amount.
CONCLUSION:
The medial pubococcygeus muscles undergo the largest stretch of any levator ani muscles during vaginal birth. They are therefore at the greatest risk for stretch-related injury.
Pelvic floor dysfunction, which includes urinary as well as fecal incontinence and pelvic organ prolapse, is a major women’s health problem. The annual cost of treating urinary incontinence alone in the United States is $12.4 billion (in 1995 dollars).1 Indeed, 11% of American women eventually require surgery for pelvic floor dysfunction, including urinary incontinence and pelvic organ prolapse.2 Epidemiological studies have associated pelvic floor dysfunction with prior vaginal delivery.3,4 However, although “falling of the womb” and other pelvic floor problems were first described in the Kahun Papyrus,5 approximately 3000 years later, the specific birth-induced injuries that result in pelvic floor dysfunction remain to be fully characterized and their mechanisms understood. With three million vaginal deliveries in the United States annually,6 and the risk to the pelvic floor being potentially modifiable, new insights could help prevent injuries and their sequelae in several hundred thousand women every year.
The striated muscles of the levator ani form an important element of the structural support mechanism in the pelvis. Striated muscles are known to be most susceptible to injury when forcibly lengthened; the extent of the injury is proportional to the work done on the muscle (the product of the force causing one end of the muscle to move relative to the other times the distance moved) during the stretch.7 Injury to the levator ani muscles as a result of vaginal birth has been documented.8 However, neither the degree to which the levator ani muscles are stretched during birth nor the identity of those muscles most prone to stretch-related injury has been quantified, in part because such measurements are presently not feasible in laboring women. Because the levator ani play a critical role in pelvic floor function, damage associated with what would appear to be large stretch during vaginal delivery is potentially an important pathomechanical factor.
The overall three-dimensional shape of the pelvic floor has been visualized with magnetic resonance imaging.9 Although the length and morphology of its individual muscle fibers have been measured,10 their three-dimensional lines of action, needed to begin the analysis of injury mechanisms, remain to be measured. Furthermore, quantification of the geometric changes in these muscles during the second stage of labor is needed. Birth must impose a remarkable degree of distension in these muscles if one assumes that the diameter of the molded fetal head (ie, 9 cm, based on data from Chitty et al11) is approximately four times the initial diameter of the urogenital hiatus (ie, 2.5 cm, according to DeLancey and Hurd12) in the levator ani muscle through which the head must pass during the second stage of labor. In this case, assuming circular geometry, the circumferential length of the circumvaginal tissue would increase fourfold in proportion to the ratio of the two diameters. Materials scientists usually quantify large, soft tissue deformations with the term “stretch ratio,” rather than “strain,” which is reserved for small deformations. The stretch ratio is defined as the ratio of tissue length under stretch to the original tissue length. Hence, in the preceding example, the circumvaginal tissue stretch ratio would have a numerical value of 3.54.
At the present time, it is not known which pelvic floor structures experience the greatest tissue stretch, what the magnitude of stretch is, or when during labor the greatest stretch is sustained. Injury is known to result when muscular or collagenous structures are deformed beyond certain limits.13 This report therefore describes a computer model of the pelvic floor, as well as its subsequent use to estimate the levator ani stretch ratios induced during the second stage of simulated vaginal birth.
MATERIALS AND METHODS
A three-dimensional computer model of the levator ani muscles attached to a bony pelvis was created. As the first step, a 34-year-old nulliparous white woman gave written informed consent to be scanned with a 1.5-T General Electric magnetic resonance imaging scanner as part of the institutional review board–approved study. She was one of 80 healthy young women scanned who met the following inclusion criteria: age less than 45 years, no previous vaginal delivery, no symptoms of urinary incontinence, normal support on pelvic examination, and absence of genital or neurological abnormalities that might influence pelvic floor function. Within this sample, her scans proved to be of superior image quality, and the geometry of her bony pelvic floor attachment points within one standard deviation of the mean size and shape: a 75th percentile sagittal diameter (measured from the midline of the arcuate pubic ligament to the center of the sacrococcygeal junction) and a 44th percentile lateral diameter (ischial spine separation distance).
Thirty axial and 30 coronal magnetic resonance images, each 5 mm thick, were taken of the pelvic region. The relevant outlines of relevant structures were digitized from these consecutive 5-mm-thick proton density axial magnetic resonance scans in the sagittal and transverse planes on the basis of our previous experience.14 These structures included the pelvic bones, and each element of the levator ani muscle along with its connective tissue origin and insertion. The portions of the pelvic organs (urethra, lower vagina, and internal and external anal sphincters) were also outlined in each scan and digitized. The digitized outlines of each structure were imported into I-DEAS (EDS, Plano, TX), an engineering graphics software package.
The imported profiles were connected (“lofted”) to render solid three-dimensional objects representing the levator ani muscles, surrounding pelvic bones, and organs (Figure 1). The scans focused on the pelvic floor and did not contain the portions of the pelvic bones above the relevant attachment points. To better orient the reader, the surfaces of a complete pelvis were digitized in three dimensions to the nearest millimeter with a Optotrak 3020 system (Northern Digital, Waterloo, Ontario, Canada) and the points imported into I-DEAS. The surfaces were lofted and resized to conform to the points of soft tissue origin and insertion (pubic symphysis, iliac spines, coccyx, and sacrum) as measured on the magnetic resonance scans without changing the geometry of the pelvic floor soft tissues. Because muscle fiber direction is not consistently visible on the magnetic resonance scans, fiber direction was based on known origin-insertion pairs established in the literature.15,16
Figure 1.
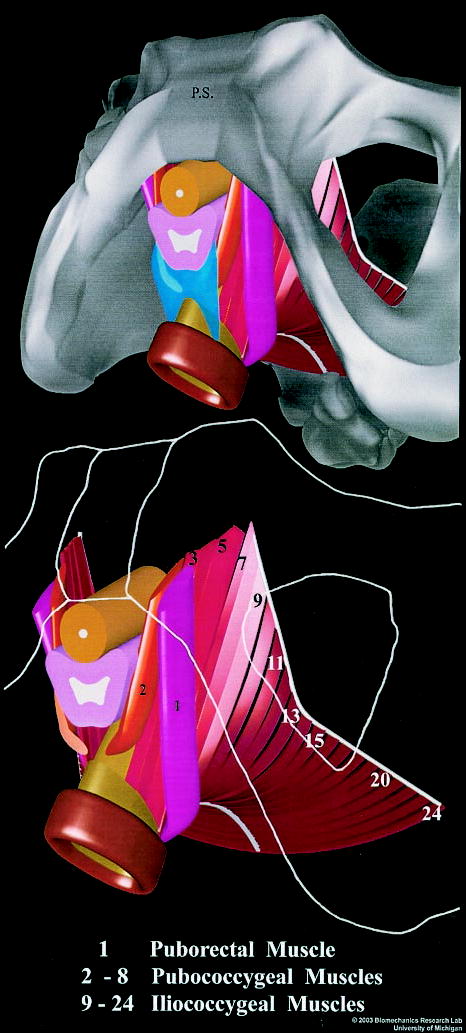
(Top) Inferior three-quarter view, seen from the left, of the pelvic floor structures appearing behind the ischiopubic rami (gray). That portion of the perineal membrane (blue) connecting the most medial portion (2) of the pubococcygeus muscles to the perineal body is shown. The lateral portions of the perineal membrane have been removed. (Bottom) The pelvic bones (outlined from image above in white) and perineal body have been removed to show a close-up of the arrangement of the iliococcygeal, pubococcygeal, puborectalis muscles, as well as the urethra (umber), vagina (pink), and rectum (brown). Individual muscle bands are identified by a number inscribed near their origin on the arcus tendineus (white). The anal sphincters were segmented directly from in vivo magnetic resonance images, but neither the coapting effect of the venous plexus nor its covering anoderm are shown. © 2003 Biomechanics Research Lab, University of Michigan, Ann Arbor.
Lien. Muscle Stretch During Birth. Obstet Gynecol 2004.
The passive connective tissues in the pelvic floor model followed published observations.17 Thus, the arcus tendinea of the levator ani connected the left and right ischial spines, and their bony insertions 1 cm on either side of the pubic symphysis (Figures 1 and 2).
Figure 2.
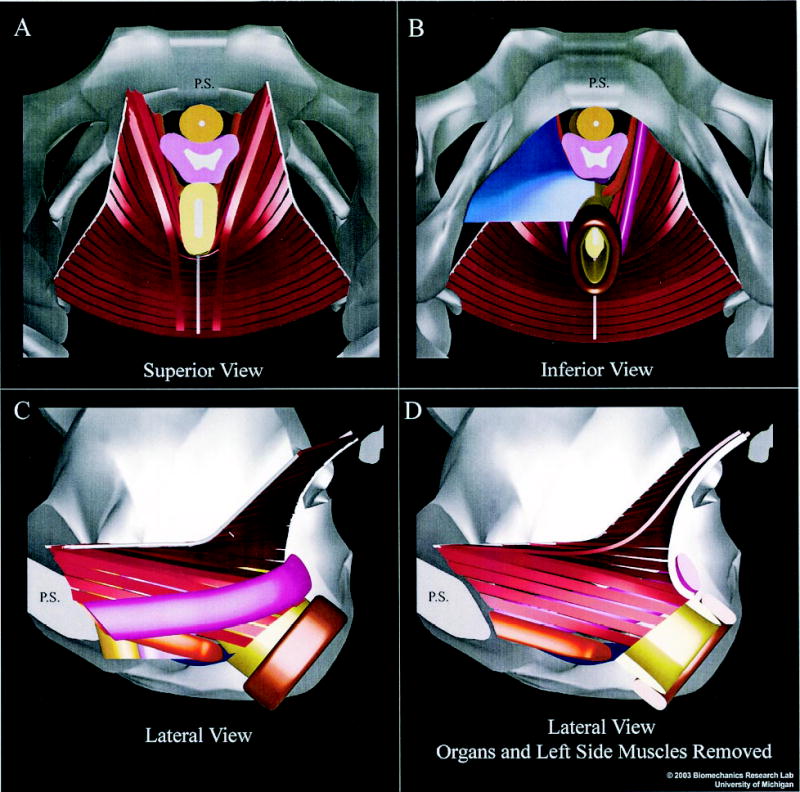
Superior and inferior (A and B) and left lateral views of the muscular elements of the female pelvic floor (C and D). (A and B) The pubic symphysis (PS) appears in the midline at the top of each image. The sacrum (not shown) would appear at bottom. (B) Half of the perineal membrane (blue) has been removed to reveal the medialmost pubococcygeus (orange) and puborectalis (magenta) muscles. The arcus tendineus appears bilaterally as the cablelike structures (white) to which the lateral ends of each iliococcygeus muscle (red ) band insert; the midline anococcygeal raphe (white) is also evident. (C) The left half of the bony pelvis has been removed to reveal a lateral exterior view of the muscles. (D) The left-side muscles have also been removed, along with the pelvic organs, to reveal an inner view of the right-side muscles. The internal and external anal sphincters are shown in light and dark brown, respectively. Colors for urethra and vagina are the same as in Figure 1. The anal sphincters were segmented directly from in vivo magnetic resonance images, but neither the coapting effect of the venous plexus nor its covering anoderm are shown. © 2003 Biomechanics Research Lab, University of Michigan, Ann Arbor.
Lien. Muscle Stretch During Birth. Obstet Gynecol 2004.
To construct the pelvic floor model, three pairs of levator ani muscles were included: the pubococcygeus and the puborectalis (called collectively the pubovisceral muscles18), and the iliococcygeus muscles, which were based on descriptions in the existing literature15–17,19 (Figures 1 and 2). The pubovisceral muscles form a U shape as they originate from the inner surface of the pubic bone on either side of the midline and insert into the vagina, perineal membrane, perineal body, and anal sphincter complex, as well as forming a sling behind the rectum (Figures 1 and 2). The paired iliococcygeal muscles originate from the arcus tendineus of the levator ani, cross over the midline at the anococcygeal raphe, and continue on the contralateral side. The iliococcygeus muscle forms a horizontal sheet that spans the opening in the posterior region of the pelvis between the pubococcygeus muscle, the posterior ilia, and sacrum.
This information was used to construct 24 individual model muscle bands that followed the parallel-fibered architecture of the levator ani muscle and its subunits. These bands were numbered, for reference purposes, from 1 to 24 in a ventrodorsal direction and labeled with a prefix (PC, pubococcygeus; PR, puborectalis; or IC, iliococcygeus) indicative of the muscle each partially represents. For analysis purposes, we measured the length of the center line of each 1-mm-thick by 5-mm-wide muscle band. Each band connected origin-insertion pairs via the shortest path passing through each of the sagittal and transverse plane cross-sectional muscle profiles traced from the magnetic resonance scans (Figures 1 and 2). The width of the muscle bands was chosen to give a manageable number of muscle bundles that would allow each region of the muscle to be studied.
Once the pelvic floor model was completed, we next used the model to estimate average levator ani muscle stretch ratios in individual parts of the muscle and their spatial distribution during descent of the fetal head through the pelvis in the second stage of vaginal delivery. To do this, a simulated fetal head was passed incrementally through the pelvis (Figure 3). The fetal head’s course was constrained by the pubic rami in the front, but also by the ischial spines on each side and the sacrum at the back to form the familiar curve of Carus. The path of the head’s equator formed a “birth tube” around which the soft tissues had to stretch.
Figure 3.
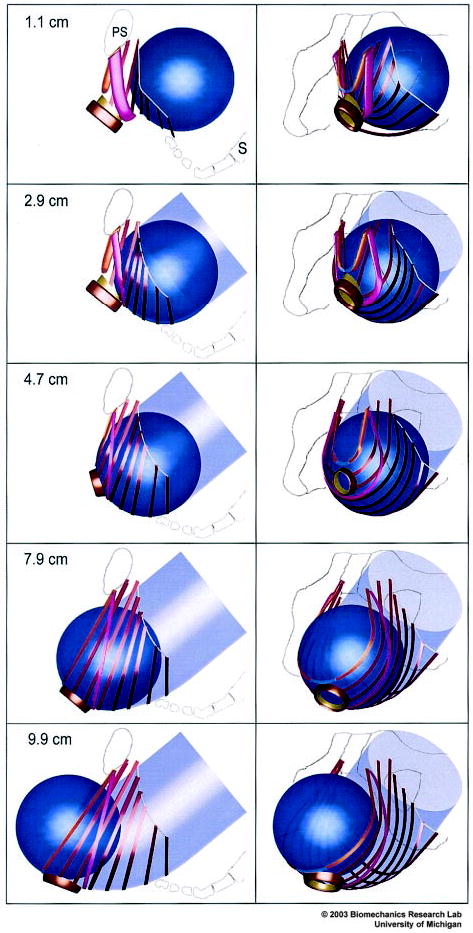
Simulated effect of fetal head descent on the levator ani muscles in the second stage of labor. At top left, a left lateral view shows the fetal head (blue) located posteriorly and inferiorly to the pubic symphysis (PS) in front of the sacrum (S). The sequence of five images at left show the fetal head as it descends 1.1, 2.9, 4.7, 7.9, and 9.9 cm below the ischial spines as the head passes along the curve of Carus (indicated by the transparent, light blue, curved tube). The sequence of five images at right are front-left, three-quarter views corresponding to those shown at left. © 2003 Biomechanics Research Lab, University of Michigan, Ann Arbor.
Lien. Muscle Stretch During Birth. Obstet Gynecol 2004.
As a first-order approximation, the fetal head was simulated with one of three different-sized spheres, after taking into account the 20% reduction in diameter that typically occurs as a result of the effect of molding20: 8 cm diameter (representing the third percentile molded fetal head); 9 cm diameter (for the 50th percentile); and 9.84 cm diameter (for the 97th percentile).11 Following obstetrical convention, fetal head descent was assessed relative to a line joining the ischial spines (defined as “0 cm” descent). After 3 cm of descent (“station +3”), the point of closest approximation of the surface of the head passed 1 cm behind and tangential to the posteroinferior surface of the pubic symphysis. The 1-cm distance between the head and the pubis represents the space occupied by the compressed pelvic soft tissues.
Soft tissue stretch ratios were calculated along the center of each muscle band for the incremental steps of fetal head descent during vaginal delivery. Calculations of muscle stretch needed for the muscle to wrap around the fetal head were based on the assumption that, during birth, the fetal head would displace the levator ani muscles a maximum of 9.0 cm in a craniocaudal–ventrodorsal direction as it passed through them. This distance was determined from measurements made from published anatomic observations during birth.21 In the absence of data to the contrary, the 23 ilio- and pubococcygeus muscle bands were assumed to remain equally spaced when contacting the fetal head through each stage of the simulated birth (Figure 3). The sensitivity of our results to violations of this assumption is provided in Results. The pubovisceral muscles were assumed to have unchanged origins and insertions.
The fetal head was placed at each of eight equally spaced locations along the curve of Carus between the point when the iliococcygeal muscle was engaged by the head until the “biparietal” diameter passed the pubococcygeal muscle. This process was started when the vertex of the head contacted the iliococcygeal muscles after it had descended 1.1 cm inferior to a reference line joining the left and right ischial spines. The overall stretch in each muscle band engaged by the fetal head was then measured as it passed in a straight line from its origin to wrap tangentially about the head. The arcus tendineus, consisting of dense regular connective tissue, was assumed inextensible yet sufficiently flexible to bend laterally around the descending fetal head.
RESULTS
Seven muscle bands were engaged by 1.1-cm fetal head descent, two more by 2.1-cm descent, one by 3.2-cm descent, and the last muscle band, the medialmost member of pubococcygeus (PC2), was engaged by 4.2 cm of head descent (Figure 4). The maximal increase in muscle stretch that occurred with each increment of fetal head descent (shown by the steepest slope of each curve in Figure 4) occurred in seven muscle bands between 1.1-and 2.9-cm head descent. However, for the pubococcygeus bands (PC3, PC5, and PC7) the corresponding maximal increase in stretch ratios occurred between 4.7-and 6.4-cm descent). For the medialmost pubococcygeal band, PC2, the maximal increase occurred between 4.2 and 4.7 cm.
Figure 4.
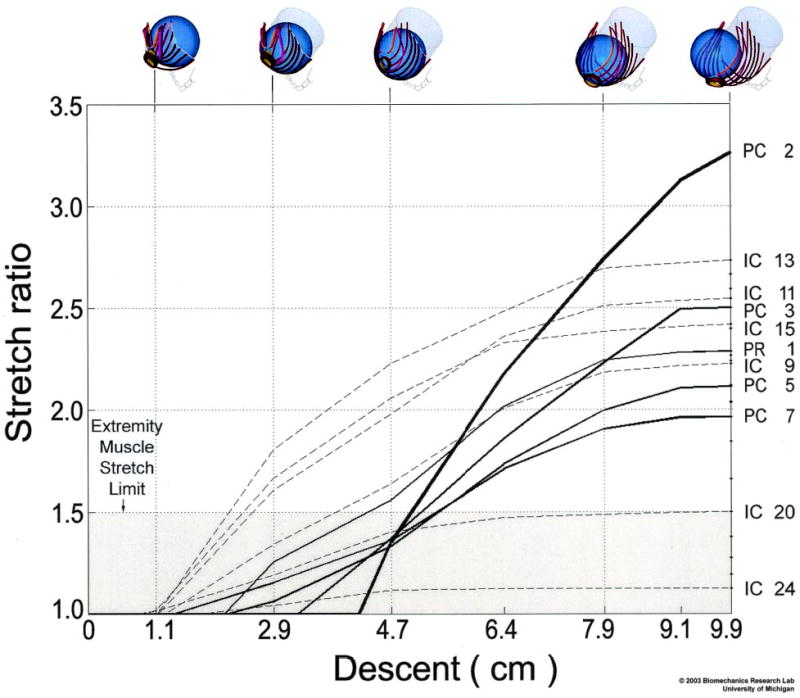
The relationship between fetal head descent (abscissa, in centimeters; icons at top) and the resulting muscle stretch ratios (ordinate) in selected levator ani muscles. The labels at right identify the pubococcygeus (PC), iliococcygeus (IC), and puborectalis (PR) muscle bands defined and numbered in Figure 1. The largest stretch is induced in the medialmost pubococcygeus (PC2) muscle, the last muscle to be engaged by the fetal head. The shaded region denotes the values of stretch tolerated by nongravid appendicular striated muscle without injury. © 2003 Biomechanics Research Lab, University of Michigan, Ann Arbor.
Lien. Muscle Stretch During Birth. Obstet Gynecol 2004.
A sigmoidal relationship was found between fetal head descent and muscle stretch (Figure 4). Despite being the last muscle to be engaged, the medialmost pubococcygeus muscle (PC2) exhibited the largest stretch ratio of any muscle, 3.26, at 9.9 cm of head descent; this value exceeded the maximal stretch in other muscles by 19% or more (Figures 4 and 5). Different regions of the iliococcygeus muscle, IC13, IC11, IC15, IC9, IC20, and IC24 stretch ratios reached 2.73, 2.54, 2.42, 2.22, 1.50, and 1.13, respectively. The other pubococcygeus muscles (PC3, PC5, and PC7) exhibited stretch ratios of 2.50, 2.11, and 1.96, respectively, whereas puborectalis (PR1) reached an intermediate value of 2.28. The large stretch ratio occurred in the medialmost component (PC2) of the pubococcygeus muscle as a result of its short initial length (Figure 5) and the location of its origins near the midline (Figures 2 and 3). Note that the stretch ratio is influenced both by the initial length and also by the degree of elongation that occurs with dilatation caused by the fetal head. Although the puborectalis muscle has similar origin to the pubococcygeus, its longer initial length resulted in a relatively smaller maximal stretch. The smaller stretch in the iliococcygeal muscles may be attributed to their more lateral and posterior origin. The inferiormost point on the PC2 pubococcygeus muscle displaced a maximum of 96 mm in a craniocaudal–ventrodorsal direction as a result of distension by the fetal head after negotiating the curve of Carus. Only 5 of the 24 muscle bands had stretch ratios less than that which would injure nongravid striated muscle in the extremity (Figure 5).7
Figure 5.
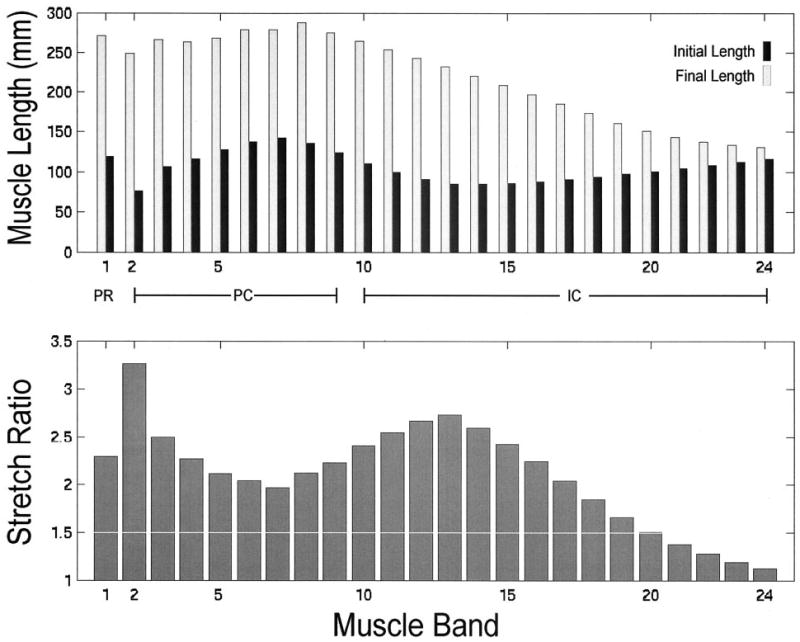
The upper bar graph compares, by muscle, initial and final muscle lengths corresponding to 1.1- and 9.9-cm model fetal head descent, respectively, as shown anatomically in Figure 3. The lower bar graph shows the maximum corresponding stretch ratio found in each levator ani muscle band. Note that the value of the stretch ratio is not simply proportional to initial or final length. For both graphs, muscles are arranged left to right, in ventral to dorsal order of origin location, following the numbering used in Figure 1.
Lien. Muscle Stretch During Birth. Obstet Gynecol 2004.
Muscle stretch ratios were found to be proportional to fetal head diameter: Reducing fetal head diameter by 11% diminished the medialmost coccygeal muscle band stretch by 10.5%, whereas enlarging fetal head diameter by 9% increased that muscle stretch by 8.8%.
To assess the sensitivity of these findings to the degree of downward descent experienced by the levator ani muscles during head descent, we investigated the sensitivity of the predicted muscle stretch to 5|SD variations in the inclination of the plane containing bilateral pairs of muscle bands: Variations were less than 0.25 stretch ratios for the lower iliococcygeal, pubococcygeal and puborectal muscles (PR1 to IC13) between 6.4- and 7.9-cm fetal head descent; and less than a 0.09 value of the stretch ratio between 9.1- and 9.9-cm head descent. For the posterior iliococcygeal muscles (IC15 to IC24), variations were less than 0.04 stretch ratios between 2.9-and 4.7-cm head descent; and less than 0.06 stretch ratios between 6.4- and 9.9-cm head descent.
DISCUSSION
The maximum pubococcygeal (PC2) muscle stretch ratio of 3.26 found in this study exceeds by 217% the largest noninjurious stretch (1.5 stretch ratio, upper limit of shaded region, Figure 4) observed in nongravida passive striated appendicular muscle.7 If injury could be caused by fiber stretch exceeding a maximal permissible value, we conclude that the medialmost pubococcygeus muscle is at a greater risk for injury than any other levator ani muscle during the second stage of labor. The fact that abnormalities are indeed observed in this very part of the levator ani muscle several months postpartum8 (Figures 6 and 7) supports the hypothesis of a stretch-related injury mechanism, although we cannot exclude the possibility of other injury modes. It also provides validation of model results relative to clinical observations.
Figure 6.
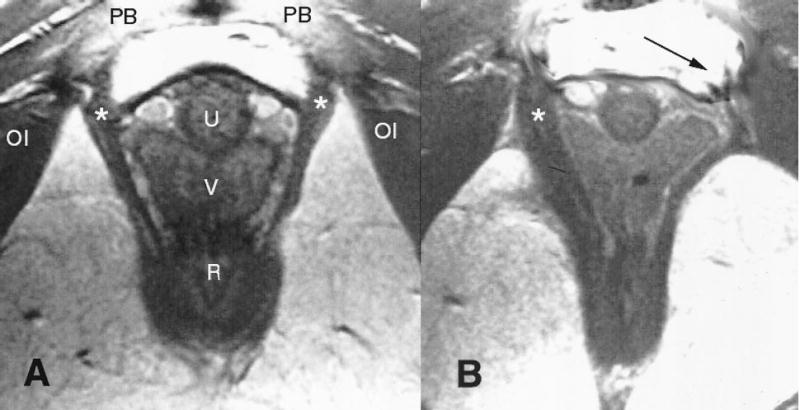
(A) Normal anatomy in an axial midurethra proton density magnetic resonance image showing the pubovisceral muscle (*) (see Figure 1 for orientation). (B) Woman who has lost a part of the left pubovisceral muscle (displayed on the right side of the image, according to standard medical imaging convention) with lateral displacement of the vagina into the area normally occupied by the muscle. The arrow points to the expected location of the missing muscle. The puborectalis is left intact bilaterally. OI = obturator internus; PB = pubic bone; U = urethra; V = vagina; R = rectum.
Lien. Muscle Stretch During Birth. Obstet Gynecol 2004.
Figure 7.

Axial, midurethral section through the arch of the pubic bone (see PS, top) and the model levator ani muscles (shown earlier in Figures 1 and 2) corresponding to those from the patients shown in the Figure 6 cross sections. Intact muscles are shown in dark gray. Simulated PC2 muscle atrophy is illustrated by the light gray shading of the left-side PC2 muscle. This location is shown to correspond with the location of muscle atrophy demonstrated in Figure 6. PS = pubic symphysis; U = urethra; V= vagina; R = rectum.
Lien. Muscle Stretch During Birth. Obstet Gynecol 2004.
The medialmost portion (PC2) of the pubococcygeal muscle attaches to the connective tissue of the perineal body. At this point in time, we cannot be certain whether the stretch occurs solely in the pubococcygeal muscle itself, solely in the passive tissues of the perineal body to which it connects caudally, or in both structures in similar or differing proportions. But irrespective of the stretch distribution within the medial pubococcygeus–perineal body complex, the total stretch ratio of the combined structures must reach 3.26 for the fetal head to be delivered. Our findings underline the need to clarify the mechanisms by which the levator ani muscles accommodate these remarkable levels of tissue stretch without injury in the majority of women.
Our graphical analysis circumvents the limitations of current analytical approaches (eg, finite element analysis), which can reliably predict tissue mechanical behavior up to stretch ratios of approximately 1.3, as long as the constitutive relationships between tissue stress, strain, and velocity are known. However, because these relationships are not yet known in the nongravid state, let alone during the second stage of labor, the reliable use of such methods is precluded at the present time. The initial lengths of the model pubococcygeal and iliococcygeal muscles are consistent with experimentally determined values.10 Although our estimates of muscle stretch ratios would depend on the number of muscle bands in the model, where too few bands have been used, our use of 24 muscle bands is consistent with the 22 bands used earlier to measure levator ani muscle fiber lengths.10
We acknowledge several methodological limitations. First, we did not consider time- or stretch-dependent material property effects on tissue stretch; although these may affect the tissue stresses, they will not affect our estimates of the maximum average tissue stretch because they do not affect the inherent geometric difference between the sizes of the prelabor urogenital hiatus and fetal head. Second, for an average cephalic index of 0.83 (the cephalic index is the ratio of the biparietal diameter to the occipital–frontal diameter20), the perimeter of a corresponding ellipse differs by 1% from a sphere, a negligible amount. But variations in maternal pelvic shape, fetal head shape, the degree of molding during delivery, symphyseal diastasis, types of episiotomies, and presenting orientation may undoubtedly affect the maximum muscle stretch ratios; although worth investigating, these effects are beyond the scope of this report. Third, stretch is not necessarily uniform along the tissue band, as assumed; it can vary locally along and across a muscle band,22 especially if thickness varies.23 Fourth, the association between magnitude of pelvic muscle stretch, muscle architecture and tissue properties, and the risk of injury is unknown, particularly given the possibility for modulation by hormonal mechanisms. For example, pennate muscle architecture is known to allow a greater degree of elongation to failure than parallel-fibered muscles24 such as the levator ani.10 Last, this analysis has focused on the average longitudinal stretch in the muscle bands. During fetal head descent, however, the bands also had to separate from one another in a direction orthogonal to their longitudinal fiber direction, parallel with the curve of Carus, as they were progressively engaged and stretched downward by fetal head descent. This effect resulted in a biaxial stretch state in the muscle bands. However, nowhere did stretch orthogonal to muscle fiber direction exceed the 1.73 value found in the iliococcygeus muscle.
This model can be extended to examine the effects of variations in the following parameters on tissue stretch ratios: maternal pelvic floor geometry, fetal head geometry and presenting orientation, cephalopelvic disproportion, racial differences,25 interspecies comparisons, and, after adding tissue properties, the time history of uterine contractions.
The ischial spines, critical pelvic floor attachment points, protrude prominently into the birth canal, where they often obstruct labor.26 Insights are also needed into why that lateral pelvic floor attachment can rupture from the ischial spine during labor, causing a paravaginal defect in need of surgical repair.27 A logical next step, therefore, would be to study the effects of cephalopelvic disproportion on soft tissue stretch ratios.
This computer model offers a structural paradigm for analyzing how obstetrical factors and interventions might influence levator ani injury risk, because experimental measurements of levator stretch in laboring women are not currently feasible for many clinical and technical reasons. For example, the model can be used to examine the degree to which an episiotomy can ameliorate muscle stretch by temporarily detaching the ends of the muscle band most at risk. In addition, the effect of variations in episiotomy location, depth, and direction may be studied. After the addition of realistic head shapes, it can be used to study the effect of forceps delivery, as well as the effect of malposition, such as occipitoposterior position, on the degree of muscle stretch during delivery.
Acknowledgments
The authors acknowledge the financial support of Public Health Service Grants P60 AG 08808 and DK 51405.
References
- 1.Wilson L, Brown JS, Shin GP, Luc KO, Subak LL. Annual direct cost of urinary incontinence. Obstet Gynecol. 2001;98:398–406. doi: 10.1016/s0029-7844(01)01464-8. [DOI] [PubMed] [Google Scholar]
- 2.Olsen AL, Smith VJ, Bergstrom JO, Colling JC, Clark AL. Epidemiology of surgically managed pelvic organ prolapse and urinary incontinence. Obstet Gynecol. 1997;89:501–6. doi: 10.1016/S0029-7844(97)00058-6. [DOI] [PubMed] [Google Scholar]
- 3.Foldspang A, Mommsen S, Lam GW, Elving L. Parity as a correlate of adult female urinary incontinence prevalence. J Epidemiol Community Health. 1992;46:595–600. doi: 10.1136/jech.46.6.595. [DOI] [PMC free article] [PubMed] [Google Scholar]
- 4.Mant J, Painter R, Vessey M. Epidemiology of genital prolapse: Observations from the Oxford Family Planning Association Study. Br J Obstet Gynaecol. 1997;104:579–85. doi: 10.1111/j.1471-0528.1997.tb11536.x. [DOI] [PubMed] [Google Scholar]
- 5.Ricci JV. The genealogy of gynaecology. Philadelphia: Blakiston, 1943:9–16.
- 6.National Center for Health Statistics. Births: Final data for 1999. National vital statistics reports, Vol 49, No. 1. Atlanta: Centers for Disease Control and Prevention, 2001. [PubMed]
- 7.Brooks SV, Zerba E, Faulkner JA. Injury to muscle fibres after single stretches of passive and maximally stimulated muscles in mice. J Physiol. 1995;488(Pt 2):459–69. doi: 10.1113/jphysiol.1995.sp020980. [DOI] [PMC free article] [PubMed] [Google Scholar]
- 8.DeLancey JOL, Kearney R, Chou Q, Speights S, Binno S. The appearance of levator ani muscle abnormalities in magnetic resonance images after vaginal delivery. Obstet Gynecol. 2003;101:46–53. doi: 10.1016/s0029-7844(02)02465-1. [DOI] [PMC free article] [PubMed] [Google Scholar]
- 9.Hoyte L, Schierlitz L, Zou K, Flesh G, Fielding JR. Two-and 3-dimensional MRI comparison of levator ani structure, volume and integrity in women with stress incontinence and prolapse. Am J Obstet Gynecol. 2001;185:13–9. doi: 10.1067/mob.2001.116365. [DOI] [PubMed] [Google Scholar]
- 10.Janda S, van der Helm FCT, deBlok SB. Measuring morphological parameters of the pelvic floor for finite element modeling purposes. J Biomech. 2003;36:749–57. doi: 10.1016/s0021-9290(03)00008-3. [DOI] [PubMed] [Google Scholar]
- 11.Chitty LS, Altman DG, Henderson A, Campbell S. Charts of fetal size. 2. Head measurements. Br J Obstet Gynaecol. 1994;101:35–43. doi: 10.1111/j.1471-0528.1994.tb13007.x. [DOI] [PubMed] [Google Scholar]
- 12.DeLancey JOL, Hurd WW. Size of the urogenital hiatus in the levator ani muscles in normal women and women with pelvic organ prolapse. Obstet Gynecol. 1998;91:364–8. doi: 10.1016/s0029-7844(97)00682-0. [DOI] [PubMed] [Google Scholar]
- 13.Noyes FR, DeLuca JL, Torvik PJ. Biomechanics of anterior criuciate ligament failure: An analysis of strain-rate sensitivity and mechanisms of failure in primates. J Bone Joint Surg. 1974;54A:236–53. [PubMed] [Google Scholar]
- 14.Strohbehn K, Ellis JH, Ashton-Miller JA, DeLancey JOL. Magnetic resonance imaging of the levator ani with anatomic correlation. Obstet Gynecol. 1996;87:277–85. doi: 10.1016/0029-7844(95)00410-6. [DOI] [PubMed] [Google Scholar]
- 15.Lawson JO. Pelvic anatomy. I. Pelvic floor muscles. Ann R Coll Surg Engl. 1974;54:244–52. [PMC free article] [PubMed] [Google Scholar]
- 16.Roberts WH, Harrison CW, Mitchell DA, Fischer HF. The levator ani muscle and the nerve supply to the puborectalis muscle. Clin Anat. 1988;1:256–88. [Google Scholar]
- 17.DeLancey JOL. Structural support of the urethra as it relates to stress urinary incontinence: The hammock hypothesis. Am J Obstet Gynecol. 1994;170:1713–20. doi: 10.1016/s0002-9378(94)70346-9. [DOI] [PubMed] [Google Scholar]
- 18.Terminologia anatomica. Stuttgart: Thieme, 1998:39–40.
- 19.Critchley HOD, Dixon JS, Gosling JA. Comparative study of the periurethral and perianal parts of the human levator ani muscle. Urol Int. 1980;35:226–32. doi: 10.1159/000280326. [DOI] [PubMed] [Google Scholar]
- 20.Carlan SJ, Wyble L, Lense J, Mastrogiannis DS, Parsons MT. Fetal head molding: Diagnosis by ultrasound and a review of the literature. J Perinatol. 1991;11:105–11. [PubMed] [Google Scholar]
- 21.Dickinson RL. The time-element in saving the perineum. N Y Med J. 1890;51:371–4. [Google Scholar]
- 22.Best TM, McElhaney JH, Garrett WE, Myers BS. Axial strain measurements in skeletal muscle at various strain rates. J Biomech Eng. 1995;117:262–5. doi: 10.1115/1.2794179. [DOI] [PubMed] [Google Scholar]
- 23.Bernstein I, Juul N, Gronvall S, Bonde B, Klarskov P. Pelvic floor muscle thickness measured by perineal ultrasonography. Scand J Urol Nephrol. 1991;137(Suppl):131–3. [PubMed] [Google Scholar]
- 24.Garrett WE, Nikolaou PK, Ribbeck BM, Glisson RR, Seaber AV. The effect of fiber architecture on the biomechanical failure properties of skeletal muscle under passive extension. Am J Sports Med. 1988;16:7–17. doi: 10.1177/036354658801600102. [DOI] [PubMed] [Google Scholar]
- 25.Baragi RW, DeLancey JOL, Caspari R, Howard DH, Ashton-Miller JA. Differences in pelvic floor area between African American and European American women. Am J Obstet Gynecol. 2002;187:111–5. doi: 10.1067/mob.2002.125703. [DOI] [PubMed] [Google Scholar]
- 26.Abitbol MM. Evolution of the ischial spine and of the pelvic floor in the Hominoidea. Am J Phys Anthropol. 1988;75:53–67. doi: 10.1002/ajpa.1330750107. [DOI] [PubMed] [Google Scholar]
- 27.Richardson AC, Edmonds PB, Williams NL. Treatment of stress urinary incontinence due to paravaginal fascial defect. Obstet Gynecol. 1981;57:357–62. [PubMed] [Google Scholar]