

Abstract
Cell expansion in petals plays a crucial role in flower opening and final size in rose (Rosa hybrida), which largely determines its market value. While cell expansion is known to be closely associated with gibberellins (GAs), the underlying molecular mechanism remains elusive. Here, we measured the levels of GAs during flower opening and demonstrated that GA3 treatment significantly increases petal size. Moreover, we identified RhMYB70, an R2R3 MYB transcription factor, whose expression was inhibited by GA3 treatment. RhMYB70 silencing resulted in larger petals and petal cell size than those of TRV control. Through transcriptome analysis and biochemical identification, RhMYB70 could directly bind to the promoter of the cellulose synthase gene RhCESA8 and repress its transcription, thereby resulting in decreased cellulose content of petals and final size. In addition, we also identified the GA biosynthesis gene RhGA3ox3 as an RhMYB70 target and demonstrated that RhMYB70 directly binds to and inhibits the promoter activity of RhGA3ox3, leading to decreased cellulose content of petals and petal size. Besides, knocking down RhMYB70 expression not only resulted in increasing GA1 and GA3 levels in petals compared to TRV but also elevated cellulose content. Together, our findings reveal that the feedback regulation of GAs and RhMYB70 signaling fine-tunes cell expansion and petal size by modulating cellulose content of rose petals, providing genetic targets for improving rose flower quality.
Introduction
Rose (Rosa hybrida) is one of the most valuable ornamental plants worldwide, widely used to produce cut flowers, as potted plants, and for landscaping and home gardens. The value of rose plants is highly susceptible to fluctuations in quality, with flower size being a key factor. Many studies have demonstrated that flower opening largely depends on the extent of petal expansion [1, 2]. Therefore, the mechanisms of flower opening, particularly petal expansion and its precise regulation, have remained a focal point for flower product quality control and an important topic for floral research.
Petal growth in rose is governed by the coordinated regulation of cell division and cell expansion. Cell expansion in plants involves cell wall degradation and resynthesis, changes in cell turgor, and cytoskeletal rearrangement [3]. Cellulose, a major component of the cell wall, forms the primary framework supporting the basic structure of the cell wall, providing plant cells with the ability to resist turgor pressure. Cellulose plays critical roles in cell division and differentiation, maintaining cell size and shape, and other aspects of plant development [4]. Deficiencies in the biosynthesis of cellulose or its components can lead to abnormal cell expansion [5]. Cellulose synthase (CESA) genes encode enzymes that are crucial for cellulose biosynthesis [4, 6, 7]. AtCESA1, AtCESA,3, and AtCESA6 regulate cellulose biosynthesis in primary cell walls, whereas AtCESA4, AtCESA7, and AtCESA8 are involved in secondary cell wall biosynthesis [8–10]. Silencing of PhCESA3 in petunia (Petunia hybrida) leads to a reduction in cell size in the abaxial and adaxial epidermis of leaves and petals, accompanied by the expansion of internal cells [11]. Silencing of RhCesA2 in rose petals also results in inhibited subepidermal cell expansion in petals [2].
GAs (gibberellins) are a phytohormone that promotes cell proliferation and expansion and regulates seed germination, leaf expansion, floral transition, stem and petiole elongation, and the development of flowers and fruits [12–16]. Among bioactive GAs, GA1, GA3, GA4, and GA7 play prominent roles. GA3 is a naturally occurring tetracyclic diterpene plant hormone and is the most widely used plant growth regulator, acting as a key regulator of various aspects of plant growth and development [13, 14]. The homeostasis of GAs in plants is regulated by multiple enzymes, with GA oxidases catalyzing both the biosynthetic and catabolic pathways. GA20ox and GA3ox are key rate-limiting enzymes in the GA biosynthetic pathway, while GA2ox plays a crucial role in the degradation of bioactive GAs. Together, these enzymes control the levels of GAs within the plant [17]. A deficiency of (or insensitivity to) GA results in dwarf phenotypes, while increased endogenous GA levels promote cell expansion and increase plant height [12, 18, 19]. When the extracellular GA concentration increases, active GA binds to GID1, and the receptor protein GID1 undergoes structural changes, allowing it to bind to DELLA protein and form GA/GID1/DELLA complex, promoting the degradation of DELLA protein by activated SCF, and ultimately releases the GA signal to exert physiological effects [15, 17]. In R. hybrida, silencing of the GA signaling gene RhGAI1 enhances petal cell expansion, while silencing RhNF-YC9 reduces GA content, leading to a decreased petal expansion rate [20, 21]. Overexpressing GhWIP2 in Gerbera hybrida significantly reduces GA content, resulting in dwarf plants, smaller petals, and shorter sepals and petioles than in wild-type plants [22]. Despite these advances, however, the regulatory network underlying the role of GA in petal cell expansion remains unclear.
The MYB family of transcription factors constitutes one of the most extensive groups within the plant. The R2R3-MYB subfamily is the most prevalent. These proteins are characterized by two highly conserved MYB-DNA binding domains [23].
The R2R3-MYB family exhibits functional diversity and plays critical roles in plant growth and development, as well as regulating specific physiological processes. The R2R3-MYB transcription factor MYB56 influences seed size by regulating endosperm cell size in Arabidopsis [24]. Meanwhile, the MYB-like transcription factor DRMY1 regulates reproductive organ growth and size by modulating cell proliferation [25]. Overexpressing PtMYB055 in transgenic poplar upregulates lignin biosynthesis genes, leading to an increase in secondary cell wall thickness [26]. The Arabidopsis MYB44, MYB70, MYB73, and MYB77, which share structural similarity and belong to the R2R3-MYB subfamily 22, have been extensively reported to be involved in the regulation of plant stress responses and phytohormone signaling pathways, including those of ABA, JA, and SA [19, 27]. In tomato, SlMYB70 has been shown to negatively regulate fruit ripening by directly repressing the transcription of ethylene biosynthesis genes [28]. MYB70 modulates root system development and seed germination in Arabidopsis by regulating the ABA and auxin signaling pathways, the balance of H2O2/O2, and suberization [29]. However, the role of MYB70 in the regulation of petal growth and development is still not fully understood.
In this study, we used data from a previous transcriptome analysis of rose petals treated with various phytohormones to determine that the R2R3-MYB subfamily gene RhMYB70 is repressed by GA3 treatment. We elucidated the RhMYB70 vital roles in regulating cell expansion and petal size by affecting the GA levels and cellulose content of rose petals. Our findings reveal the role of the GAs–RhMYB70 feedback loop in the development of rose flowers, providing a robust theoretical foundation for precisely controlling rose petal size using plant growth regulators, with significant theoretical and practical implications.
Results
GA3 promotes cell expansion in rose petals
The size of petals are determined by the coordination between cell proliferation and cell expansion [1, 30]. The initiation of cell expansion in rose petals occurs at Stage 1, and Stage 1–3 is a period of rapid cell expansion, whereas Stage 3–5 primarily encompass significant alterations in petal angle [31]. As established in previous studies, GAs play a pivotal role in regulating petal cell expansion in rose (R. hybrida) [20, 26]. To characterize their dynamic involvement, we monitored the GA levels at different stages of flower opening, and found that GA1 and GA3 exhibited a sharp increase from Stage 1 to Stage 3, but significant decrease from Stage 3 to Stage 5 (Fig. 1A and B). However, the GA4 was not detected at Stage 3 and Stage 5. To further explore how GA regulates petal and flower size, we applied GA3 exogenously at Stage 1. GA3 significantly increased flower diameter (8.57 ± 0.41 cm for GA3 treatment vs 7.13 ± 0.51 cm for the Mock) and petal size (13.24 ± 1.20 cm2 for GA3 treatment and 9.67 ± 0.75 cm2 for Mock) (Fig. 1D, E, G, and H). Measurements of abaxial epidermal cell size revealed that these cells were significantly larger under GA3 treatment (800.99 ± 73.57 μm2) than under Mock treatment (518.77 ± 31.73 μm2) (Fig. 1F and I). However, there was no significant difference in cell number at the fully open stage between Mock and GA3 treatments (Fig. 1J). These results indicate that GA might promote the cell expansion of petal cells.
Figure 1.

GA3 treatment increased petal size by promoting the cell expansion. C. Quantification of endogenous bioactive gibberellins (GAs) within petals at various developmental Stages. Different letters above the bars indicate significant differences according to Duncan’s multiple range test (P < 0.05), ND in C means not detected. D. Opening progression of rose flower treated with Mock and GA3. E. Phenotypes of the outermost layer petals in Mock and GA3-treated flower at Stage 5. F–J. Traces of abaxial subepidermis (AbsE) cells in the petal middle regions (F), flower diameters (G), petal size (H), average single AbsE cell areas (I), and cell number (J) in petals treated with Mock and GA3. Scale bars in D, E, and F represent 2 cm, 1 cm, and 20 μm, respectively. Data are presented as means ± SD (n = 3 in A–C; n = 5 in G, H, J; n = 10 in I). Statistical significance was determined using Student’s t-test, **P < 0.01 and ***P < 0.001. No significant difference is denoted by ns.
GA3 inhibits the transcription of RhMYB70
Based on previously reported transcriptome sequencing data [32], we determined that the expression of RchiOBHmChr6g0255341 was significantly repressed by GA3 (Supplementary Fig. S1). Reverse transcription-quantitative polymerase chain reaction (RT-qPCR) further confirmed that RchiOBHmChr6g0255341 expression was inhibited by GA3 and its expression levels decreased from Stages 1 to 3 (Fig. 2A). Phylogenetic examination coupled with conserved domain alignment indicated that the protein produced by the RchiOBHmChr6g0255341 gene is a member of the R2R3-MYB family subgroup 22, which is involved in response to both biotic and abiotic stresses [33], and is closely related to Arabidopsis MYB70 (AT2G23290) (Supplementary Fig. S2 and Fig. 2B). We thus named this protein RhMYB70. The fusion vector of RhMYB70 protein emits fluorescence exclusively in the nucleus, indicating that it functions within this cellular compartment (Fig. 2B). A transcriptional activity assay revealed that RhMYB70 is a transcriptional repressor (Fig. 2D–F).
Figure 2.

The characteristic analysis of RhMYB70. A. RT-qPCR analysis of RhMYB70 transcript levels in petals treated with Mock and GA3 at Stage 1, Stage 3, Stage 5. RhUBI2 was used as an internal control. B. Multiple sequence alignment of amino acid sequence of RhMYB70 protein with other six species MYB proteins. C. Subcellular localization of RhMYB70 in N. benthamiana leaves by using NF-YA4-mCherry as the nuclear marker. Scale bars represent 50 μm. D–F. Transcriptional repressor activity of RhMYB70. Schematic representation of the reporter and effector constructs was shown in D; live imaging of N. benthamiana leaves of RhMYB70 transcriptional activity in E; quantitative analysis of RhMYB70 transcriptional repressor activity was in F. Data are shown as means ± SD (n = 3 in A and F). Different lowercase letters (F) indicate significant differences according to one-way ANOVA with Duncan’s multiple comparisons test (P < 0.05). Asterisks (in A) indicate statistically significant differences (**P < 0.05; **P < 0.01) by two-sided Student’s t-test.
RhMYB70 directly represses RhCESA8 expression and reduced cellulose content of rose petals
To elucidate the function of RhMYB70 in the expansion of petal cells, we silenced RhMYB70 using virus-induced gene silencing (VIGS). Notably, RhMYB70 silencing led to a larger flower diameter (7.93 ± 0.38 cm) and petal size (11.30 ± 0.38 cm2) than those in the TRV control (flower diameter, 6.41 ± 0.50 cm; petal size, 8.92 ± 1.01 cm2) (Fig. 3A–E). The cell size in petals from the RhMYB70-silenced lines (646.91 ± 69.55 μm2) was larger than that in petals from the TRV lines (464.66 ± 27.92 μm2) (Fig. 3F–G). These results suggested that RhMYB70 might regulate cell expansion and petal size in a GA-dependent manner.
Figure 3.

RhMYB70 regulates cell expansion and petal size by modulating cellulose content of rose petals. A. Flower phenotypes of TRV control and TRV-RhMYB70 plants. B. RT-qPCR showing the RhMYB70 expression in TRV control and RhMYB70-silenced plants. C–H. Flower diameter (C), petal size data (D) and photos (E), traces of AbsE cell outlines in the middle regions of petals (F), average single AbsE cell areas (G), and cell number (H) of petals in TRV and TRV-RhMYB70 flower at Stage 5. Scale bars represent 1 cm in A & E, 20 μm in F. Mean values ± SD are shown (n = 5 in B, C, and D; n = 10 in G; and n = 5 in H). Asterisks, significant differences by using two-sided Student’s t-test (**P < 0.01; ***P < 0.001; ****P < 0.0001; ns, no significant difference).
To better investigate the possible regulatory network of petal growth involving RhMYB70, we performed RNA-sequencing analysis (RNA-seq) of TRV and TRV-RhMYB70. We identified 841 differentially expressed genes (DEGs), comprising 378 upregulated genes and 463 downregulated genes (Fig. 4A). Several DEGs were enriched in the Gene Ontology (GO) terms ‘cell wall biogenesis’, ‘secondary metabolite biosynthetic process’, ‘metabolic process’, and ‘negative regulation of growth’ (Fig. 4C, Supplementary Table S1). Cell wall biogenesis is closely related to cell expansion [2, 20, 21, 31]. Indeed, we identified seven DEGs (RchiOBHmChr7g0187451, RchiOBHmChr3g0462711, RchiOBHmChr2g0106281, RchiOBHmChr6g0300381, RchiOBHmChr3g0468931, RchiOBHmChr5g0011441, and RchiOBHmChr2g0165161) enriched in this term among the DEGs (Supplementary Table S1). We measured the expression of the cell wall biogenesis genes in TRV and TRV-RhMYB70 petals by RT-qPCR. Seven genes were significantly upregulated in TRV-RhMYB70 petals compared to the TRV (Fig. 4D).
Figure 4.

RhMYB70 influences expression of genes related to cell wall biogenesis in rose petals. A. The number of upregulated genes and downregulated genes. B. Scatterplots of gene expression in RhMYB70-silenced petals relative to the TRV control. Blue and red dots represent downregulated and upregulated genes, respectively. C. Significantly enriched GO enrichment analysis between TRV-RhMYB70 and TRV control. D. qRT-PCR analysis of DEGs involved in cell wall biogenesis terms in TRV control and TRV-RhMYB70 flower at Stage 5. Asterisks, significant differences by using two-sided Student’s t-test (**P < 0.01; ***P < 0.001; ****P < 0.0001; ns, no significant difference).
To investigate whether RhMYB70 directly binds to these gene promoters to regulate their expression, we conducted several experiments. Moreover, yeast one-hybrid (Y1H) assays further indicated that RhMYB70 binds to the promoter of RchiOBHmChr5g0011441 but not to those of the other genes examined (Fig. 5D, Supplementary Fig. S4). We analyzed the transcriptome data of roses treated with GA3 and determined that GA3 treatment significantly increases RchiOBHmChr5g0011441 transcript levels (Supplementary Fig. S3A). Phylogenetic analysis and conserved domain alignment showed that RchiOBHmChr5g0011441 encodes a cellulose synthase, which is closely related to Arabidopsis CESA8 (AT4G18780). We therefore named this protein RhCESA8 (Supplementary Fig. S3B). Dual-luciferase assays and chromatin immunoprecipitation qPCR (ChIP-qPCR) demonstrated that RhMYB70 binds to the P2 and P6 regions of the RhCESA8 promoter and represses its transcriptional activity (Fig. 5A, B, C, E).
Figure 5.
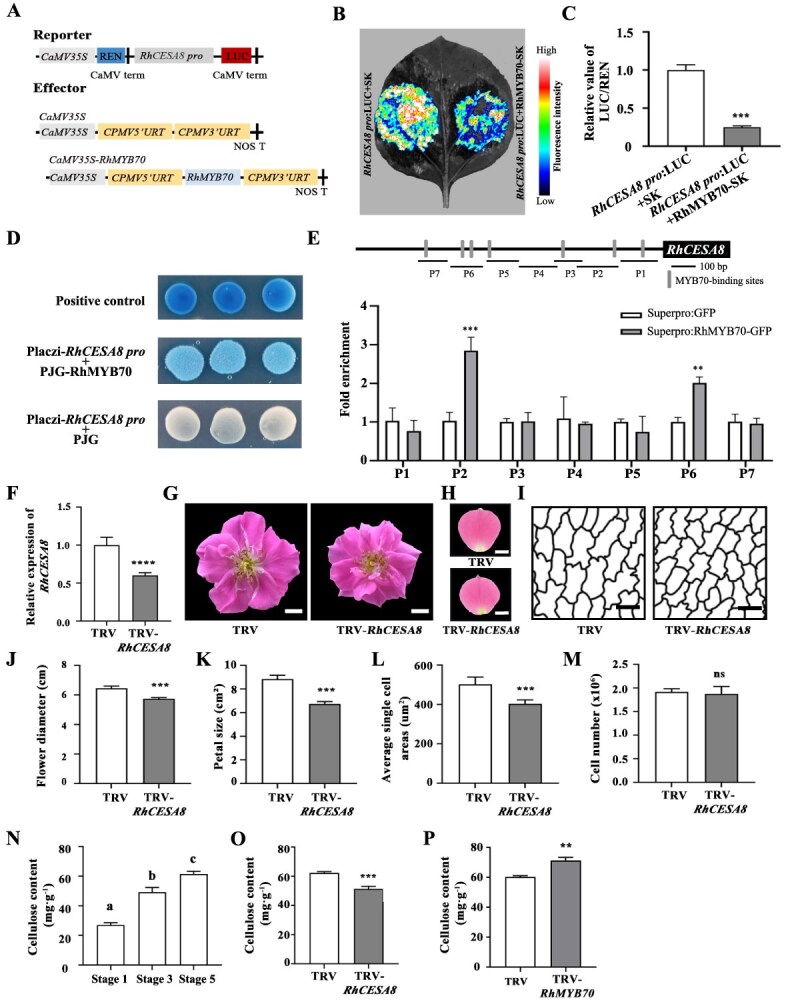
RhMYB70 directly binds to the RhCESA8 promoter and represses its transcriptional activity. A–C. Effect of RhMYB70 on RhCESA8 promoter. Effector and reporter constructs (A); imaging of luciferase activity in N. benthamiana leaves (B); quantitative analysis of LUC/REN of RhMYB70 on RhCESA8 promoter (C). D. Y1H assay showing the binding of RhMYB70 to the RhCESA8 promoter. E. ChIP-qPCR analysis of RhMYB70 binding to P2 and p6 fragments of the RhCESA8 promoter. F. RT-qPCR showing the expression of RhCESA8 in TRV control and RhCESA8-silenced plants. G. The flowers in TRV and TRV-RhCESA8 plants at the fully opened Stage 5. Scale bars, 1 cm. H. The petals in TRV and TRV-RhCESA8 plants at the fully opened Stage 5. Scale bars, 1 cm. I. Traces of AbsE cell outlines of TRV control and RhCESA8-silenced plants in the middle regions of petals at Stage 5. Scale bars, 20 μm. J & K. Flower diameter (J) and petal size (K) of TRV control and RhCESA8-silenced plants at Stage 5. L & M. Average single AbsE cell areas (L) and cell number (M) of TRV control and RhCESA8-silenced petals at Stage 5. N. The cellulose content at Stage 1, Stage 3, and Stage 5.0. The cellulose content of TRV control and RhMYB70-silenced plants at Stage 5. P. The cellulose content of TRV control and RhCESA8-silenced plants at Stage 5. Mean values ± SD are shown (n = 5 in C, E, F, J, K, M, N, O, and P; n = 3 in F; n = 10 in L;) Asterisks represent statistically significant differences by using two-sided Student’s t-test (**P < 0.01; ***P < 0.001; ****P < 0.0001).
Furthermore, silencing of RhCESA8 resulted in smaller flower diameter (5.74 ± 0.09 cm), petal size (6.74 ± 0.17 cm2), and cell size (403.66 ± 18.41 μm2) than those of TRV control (flower diameter, 6.47 ± 0.15 cm; petal size, 8.84 ± 0.75 cm2; cell size, 502.09 ± 35.29 μm2) (Fig. 5F–M). As RhCESA8 role as a key enzyme for cellulose biosynthesis, we first detected the dynamic changes of cellulose and found the accumulation levels of cellulose gradually increased during flower opening, implying that it is closely related to cell expansion (Fig. 5N). We further revealed that the cellulose content in RhCESA8-silenced petals was significantly less than that of TRV (Fig. 5O). Besides, the cellulose content in RhMYB70-silenced petals increased significantly compared to the TRV, with a 20.30% rise (Fig. 5P). Taken together, these results demonstrated that GAs regulated cell expansion and petal size by repressing RhMYB70 expression, thereby activating RhCESA8 expression and raising the cellulose content of rose petals.
RhMYB70 also represses RhGA3ox3 expression and regulates GA biosynthesis in rose petals
Notably, function annotation analysis of the DEGs identified RchiOBHmChr1g0355231, which is involved in GA biosynthetic and catabolic processes (Supplementary Table S2, Supplementary Fig. S5); this gene is annotated as RhGA3ox3. To examine whether RhMYB70 directly regulates RhGA3ox3 expression, we conducted a Y1H assay and determined that RhMYB70 could bind to the RhGA3ox3 promoter (Fig. 6A). ChIP-qPCR and dual-luciferase reporter assays suggested that RhMYB70 binds to P3 and P6 regions of the RhGA3ox3 promoter and inhibits its transcriptional activity (Fig. 6B–E). Moreover, silencing of RhMYB70 significantly increased RhGA3ox3 transcript levels, as revealed by RT-qPCR (Fig. 6F). As RhGA3ox3 is an important GA biosynthesis gene, we also examined the GA levels in TRV and TRV-RhMYB70 petals. GA1 and GA3 levels were higher in RhMYB70-silenced petals than in TRV controls (Fig. 6G and H). We further discovered that the cellulose content in GA3-treated rose petals was higher than that in the control group (Fig. 6I).
Figure 6.

RhMYB70 represses RhGA3ox3 expression by directly binding to its promoter. A. Y1H analysis indicated that RhMYB70 directly binds to the RhGA3ox3 promoter. B. ChIP-qPCR analysis of RhMYB70 binding to P2 and p6 fragments of the RhGA3ox3 promoter. C–E. Effect of RhMYB70 on RhGA3ox3 promoter. Effector and reporter constructs (C); imaging of luciferase activity in N. benthamiana leaves (D); quantitative analysis of LUC/REN of RhMYB70 on RhGA3ox3 promoter (E). F. RT-qPCR analysis of RhGA3ox3 expression in TRV control and RhMYB70-silenced flower petals. G and H. GA1 and GA3 contents of TRV and TRV-RhMYB70 petals. I. The cellulose content in Mock and GA3-treated petals at Stage 5. J. RT-qPCR showing the expression of RhGA3ox3 in TRV control and RhGA3ox3-silenced plants. K. The flowers in TRV and TRV-RhGA3ox3 plants at the fully opened Stage 5. Scale bars, 1 cm. L. The petals in TRV and TRV-RhGA3ox3 plants at the fully opened Stage 5. Scale bars, 1 cm. M. Traces of AbsE cells outlines of TRV control and RhGA3ox3-silenced plants in the middle regions of petals at Stage 5. Scale bars, 20 μm. N and O. Flower diameter (N) and petal size (O) of TRV control and RhGA3ox3-silenced plants at Stage 5. P and Q. Average single AbsE cell areas (Q) and cell number (R) of TRV control and RhGA3ox3-silenced petals at Stage 5. R. The cellulose content of TRV control and RhGA3ox3-silenced plants at Stage 5. Data are shown as means ± SD (n = 3 in B, G–J, N, Q, and R; n = 5 in E and F; n = 10 in P). Asterisks represent statistically significant differences by using two-sided Student’s t-test (*P < 0.05; **P < 0.01; ***P < 0.001; ****P < 0.0001).
Furthermore, silencing of RhGA3ox3 also resulted in smaller flower diameter (5.80 ± 0.18 cm), petal size (6.85 ± 0.16 cm2), and cell size (412.19 ± 26.91 μm2) than those of the TRV control (flower diameter, 6.65 ± 0.23 cm; petal size, 8.92 ± 0.27 cm2; cell size, 520.06 ± 32.92 μm2) (Fig. 6R). Based on these findings, the feedback loop of GA and RhMYB70 signaling fine-tunes RhCESA8 expression and cellulose content, ultimately determining petal and flower size in rose (Fig. 7). Our findings provide important insights into the GA-mediated network regulating cell expansion and organ size in rose.
Figure 7.

The assumed model of feedback loop of GAs and RhMYB70 in rose petals. We hypothesize that during the early flower opening process (Stage 1–3), higher levels of GAs significantly inhibit RhMYB70 expression, which acts as a negative regulator of cell expansion and petal size. Decreasing RhMYB70 abundance enhances RhCESA8 expression, thereby increasing the cellulose content of petals and promoting cell expansion. In addition, slightly elevated RhMYB70 abundance at Stage 5 represses the transcriptional level of RhGA3ox3, thus maintaining relatively lower GA content at later opening stages. The feedback loop between GAs and RhMYB70 fine-tunes both RhCESA8 expression and the cellulose content of petals, ultimately determining the sizes of petals and flowers in rose plants.
Discussion
GAs are crucial in various aspects of plant growth and development. They significantly influence processes such as seed germination, the formation of root structures, elongation of stems, development of flower organs, and the expansion of fruit [16, 34–36]. Many studies have revealed the critical roles of GA in regulating petal cell expansion in rose. Silencing of the DELLA gene RhGAI1 promotes petal cell expansion: RhGAI1 interacts directly with the promoter region of the cellulose synthase gene RhCESA2, thereby repressing its transcription and consequently limiting petal cell enlargement [20]. The transcription factor gene RhNF-YC9 is repressed by ethylene, and silencing of RhNF-YC9 reduces the expression of the GA biosynthesis gene RhGA20ox and increases the expression of the GA inactivation gene RhGA2ox, leading to reduced active GA levels and ultimately slowing cell expansion and petal growth rates [21]. In this study, exogenous application of GA3 treatment during flower Stage 1 can induce petal cell enlargement, resulting in an increase in the final petal area, and the obtained data are consistent with previous studies. Previous studies have demonstrated that GA promotes petal cell expansion and flower opening in roses by regulating the expression of genes related to cell turgor modulation (like PIP1;1/2;1), cell wall loosening (CesA2/3, EXPA1/8, XTH2/6/30), and cytoskeleton remodeling (TOR3/4) [20, 21]. However, our study specifically revealed that GA3 accelerates rose flower opening through the MYB-CESA module. We proposed that the role of GAs on flower opening may be more vigorous than the impact of RhMYB70 silencing alone, resulting in flowers treated with GA3 opening 1 day earlier than those treated with TRV or the Mock.
The R2R3-MYB class of transcription factors constitutes a vast and ubiquitous family of regulatory proteins in the plant kingdom [23]. These factors are crucial in a spectrum of physiological activities, such as secondary metabolism, phytohormone signaling, and responses to environmental stress [37, 38]. RhMYB108 orchestrates signals from ethylene and jasmonic acid during petal aging [39], whereas RhMYB1 is engaged in the biosynthesis of fragrance and pigments in R. hybrida [40]. RhMYB123 and RhMYB17 have been implicated in cold-mediated floral organ development [41, 42] and RhMYB73 regulates cytokinin levels, influencing the transition from cell division to cell expansion, thereby affecting the shift from cell proliferation to expansion [30]. Plant R2R3-MYB transcription factors are known to bind to specific cis-regulatory elements, which are the MYB core sequence ‘YNGTTR’ and the AC element ‘ACCWAMY’ [43, 44]. Based on this, we predicted the binding elements in the promoters of RhCESA8 and RhGA3ox3. Through ChIP-qPCR validation, we confirmed that the RhMYB70 protein can directly bind to the promoters of RhCESA8 and RhGA3ox3. This finding is consistent with the reported MYB70-binding sites in the promoter regions of downstream genes GH3.3 and PER57 in Arabidopsis [29]. To date, research on the MYB70 gene, a member of the R2R3-MYB subfamily 22, remains limited. In the present study, we uncover a novel feedback regulatory module involving GAs and RhMYB70 signaling that fine-tunes cell expansion and petal size in rose. Our findings demonstrate that RhMYB70 expression is inhibited by GA₃. Silencing of RhMYB70 results in increased GA levels in petals, enhanced expansion of abaxial epidermal cells, and larger petal size. These results suggest that RhMYB70 may act as a key regulator within the GA signaling pathway that modulates petal expansion.
Cell division and expansion during plant growth are closely associated with the biosynthesis of cell wall components. This enlargement is facilitated by the cell wall’s loosening, which allows for a swift increase in size due to turgor pressure, a mechanism that is contingent upon the relaxation of the cell wall, alterations in turgor pressure, and the restructuring of the cytoskeleton [3]. A number of R2R3-MYB transcription factors have been identified to modulate the formation of the secondary cell wall, either directly or indirectly, in Arabidopsis [23, 45]. Kim et al. have shown that MYB46 has a direct influence on the expression of cellulose synthase genes CESA4, CESA7, and CESA8, which results in the abnormal accumulation of secondary cell walls [46, 47]. NST1 and SND1 are known to enhance the activity of cellulose synthase genes IRX3/CESA7 and CESA8 [48, 49]. Furthermore, the overexpression of SND1-related genes PtrWND2B and PtrWND6B in poplar (Populus trichocarpa) triggers the expression of CESA4, CESA7, and CESA8, leading to the abnormal accumulation of secondary cell walls [50]. In cotton (Gossypium hirsutum), GhCESA8 has been recognized as a pivotal element in the biosynthesis of cellulose within secondary cell walls, potentially impacting the cellulose content and the strength of the fibers [51]. Similarly, in our study, it was clearly demonstrated that the silencing of RhCESA8 significantly reduced the cellulose content in petals, leading to petals become smaller.
Gibberellins modulate petal size by regulating the expansion of petal cells. Cell expansion is a dynamic process that necessitates continuous remodeling of the cell wall to accommodate the increasing cell volume [52]. Cellulose, a major component of the cell wall, provides structural support and stability during cell expansion and collaborates with other cell wall components to maintain the dynamic equilibrium of the cell wall [52]. In Arabidopsis, GA-related mutants exhibit significant alterations in the expression of CESA genes and in cellulose synthesis [53]. The CESA genes from Arabidopsis are upregulated in response to GA induction, and their promoter regions contain at least one GAMYB element [54]. The GAMYB transcription factors, which belong to a distinct subclass of the MYB superfamily, are widely present in plant species and many members of this subclass play regulatory roles in cell wall biosynthesis [55–57]. In this study, we identified a GAMYB transcription factor, RhMYB70. Our results show that both GA3 treatment and the suppression of RhMYB70 lead to a marked increase in the transcriptional level of the cellulose synthase gene RhCESA8, thereby elevating cellulose content. Biochemical assays further confirmed that RhMYB70 directly interacts with the promoter region of RhCESA8 to regulate its expression. Additionally, in rose petals with silenced RhGA3ox3, cellulose content is significantly reduced, resulting in smaller petals. While our study has shown that RhMYB70 directly influences the expression of a gene involved in GA biosynthesis (RhGA3ox3) and a gene related to cell wall restructuring (RhCESA8), thereby affecting GA concentrations and cell wall composition. However, further investigation is needed to understand the precise mechanisms by which GAs and RhMYB70 coordinate the cell wall’s loosening and the expansion of petals in rose plants.
Materials and methods
Plant materials and growth conditions
The acquisition and culture of sterile seedlings of R. hybrida ‘Samantha’ were described previously [30]. Vigorous shoots of rose seedlings with bud points were used as explants and subjected to disinfection treatment. Stems containing a single node were cultured on propagation medium containing 4.4 g/l MS salts supplemented with 30 g/l sucrose, 1.0 mg/l 6-benzylaminopurine (6-BA), 0.05 mg/l naphthaleneacetic acid (NAA), 3.0 mg/l GA3, pH 5.9, and 6 g/l agar. After 30 days, the plantlets were transferred to rooting medium containing the same concentration of MS salts, 30 g/l sucrose, 0.1 mg/l NAA, pH 5.9, and 7 g/l agar. After 30 more days of growth, the rooted plantlets were transplanted into 9-cm-diameter pots filled with a 1:1 (v/v) mixture of peat soil and vermiculite.
Plants were cultivated in a greenhouse with stringent environmental parameters: a 16-h light/8-h dark cycle, temperatures maintained at 22 ± 1°C, and a humidity level of 50%. The lighting was supplied by 16 W fluorescent lamps, providing an intensity of 100 μmol m−2 s−1. Nicotiana benthamiana was grown under identical environmental conditions as the rose seedlings.
Exogenous GA3 treatment
GA3 treatment was performed as described previously [30]. Briefly, the rose flower buds at Stage 1 (unopened bud with visible petals) were treated with a 100 μM GA3 solution, applied every 48 h, continuing until the flowers reached full blooming; for comparison, control blossoms used an equivalent volume of water solution.
Quantification of endogenous GA levels
A 50-mg petal sample was extracted with a MeOH/H2O/formic acid mixture (15:4:1 v/v/v), vortexed, and centrifuged. The supernatant was evaporated, and the residue was treated with formic acid, water, and ethyl acetate, then reextracted with ethyl acetate. The combined fractions were evaporated, reconstituted in ACN, and treated with triethylamine and 3-bromopropyltrimmethylammonium bromide. After incubation and evaporation, the sample was redissolved in ACN/H2O, filtered, and analyzed by LC–MS/MS (Liquid Chromatography Tandem Mass Spectrometry ) using the AB Sciex QTRAP® 6500+ platform.
Microscopic observation and cell counting
When a flower reached Stage 5, the flower’s petals become fully expanded, facilitating the measurement of the flower diameter with a digital caliper. Petal images were captured digitally using a flatbed scanner to measure total petal area with ImageJ software (National Institutes of Health, USA). The outer petals were meticulously excised and preserved in formaldehyde-acetic acid (FAA) solution. The fixed petals were decolorized using a series of ethanol treatments.
For microscopic analysis, the adaxial epidermal cells were observed under an optical microscope. Specific cells were chosen from the central region of the petal for detailed examination and photography. Statistics on the number and size of petal cells were executed in accordance with the procedure detailed by Jing, Jin & Gong et al [30, 58–60].
Virus-induced gene silencing
The VIGS technique was executed following the previously outlined protocol [61]. Gene-specific fragments for RhMYB70 (412 bp), RhCESA8 (355 bp), and RhGA3ox3 (252 bp) were amplified and inserted into the pTRV2 vector to obtain pTRV2::RhMYB70, pTRV2::RhCESA8, pTRV2::RhGA3ox3. pTRV1, pTRV2, pTRV2::RhMYB70, pTRV2::RhCESA8, and pTRV2::RhGA3ox3 were introduced into the Agrobacterium tumefaciens GV3101 strain. These were then cultured in an LB medium supplemented with kanamycin and rifampicin. The Agrobacterium cells, after being cultured, underwent centrifugation and were subsequently resuspended in a buffer solution. The OD600 of the resuspended bacterial solution was adjusted to 1.0, and the resuspended pTRV2, pTRV2-RhMYB70, pTRV2-RhCESA8, and pTRV2-RhGA3ox3 bacterial solutions were mixed with pTRV1 bacterial solution at equal volumes. The mixed bacterial solution was incubated in a dark environment for 3–5 h.
In vitro-grown rose seedlings showing comparable growth were submerged in the Agrobacterium suspension and subjected to vacuum infiltration. Following infiltration, the seedlings were incubated in a dark environment at a low temperature of 8°C for 3 days. Post-incubation, seedlings were placed in pots with a 1:1 peat-vermiculite mix and grown in the cultivation room. The developmental progression of the rose flower was meticulously recorded with photographs at the stages of flowering. The primers employed in the VIGS assay are detailed in Supplementary Table S3.
Subcellular localization
The RhMYB70 coding sequence was fused with GFP (Green Fluorescent Protein ) in the pSuper::RhMYB70 vector, with NF-YA4-mCherry as a nuclear marker [62]. Constructs were introduced into A. tumefaciens GV3101, mixed, and co-infiltrated into N. benthamiana leaves. After 3 days, leaves were analyzed with an Olympus FV3000 confocal microscope, using 488 nm for GFP and 561 nm for mCherry excitation.
RNA-Seq
High-quality RNA was extracted from rose petals, both from pTRV2- and RhMYB70-silenced samples, utilizing the hot borate method to ensure suitability for sequencing [1]. For each sample, cDNA libraries were synthesized from 1 μg of total RNA. These libraries were prepared in accordance with established protocols and sequenced using an Illumina sequencing platform. The bioinformatics analyses encompassed sequencing, data processing, assembly, and annotation. The RNA-seq reads were aligned to the reference genome of Rosa chinensis ‘Old Blush’ (GenBank ID 8255808) and the data was archived in the NCBI BioProject database with the accession number PRJNA1162946.
Differential gene expression was analyzed with log2(fc) ≥ 1.5 or ≤ −1.5 and P-value ≤ 0.05. Differentially expressed genes underwent GO and KEGG (Kyoto Encyclopedia of Genes and Genomes) analyses. Each sample had three biological replicates.
RNA extraction and RT-qPCR
The process of isolating total RNA from rose petals was accomplished through the application of the hot borate extraction method [1]. Following this, the synthesis of cDNA was initiated using 1 μg of the extracted RNA, strictly following the protocol outlined in the HiScript III All-in-one RT SuperMix kit documentation (Vazyme, Nanjing, China). The cDNA that was generated served as the foundational template for the subsequent RT-qPCR procedure. This RT-qPCR was executed utilizing the M5 HiPer Real-time PCR Super mix (Mei5 Biotech, Beijing, China). In order to normalize the levels of gene expression across the samples, the housekeeping gene RhUBI2 was selected as an internal control. The quantification and analysis of gene expression data were meticulously carried out using the 2−ΔΔCt methodological approach. To ensure the highest degree of accuracy in the results, each sample was subjected to testing in three distinct biological replicates, as well as three separate technical replicates. The specific primers that were employed for the RT-qPCR are comprehensively listed in Supplementary Table S3D.
Yeast one-hybrid assay
The promoters of RhGA3ox3, RhCESA8, and RchiOBHmChr7g0187451, RchiOBHmChr3g0462711, RchiOBHmChr2g0106281, RchiOBHmChr6g0300381, RchiOBHmChr3g0468931, RchiOBHmChr2g016516 were inserted into pLacZ. RhMYB70 was cloned into pB42AD, and the resulting plasmid was co-transformed with pLacZ into yeast EGY48. Yeast grown on SD/−Trp/−Ura medium, and then transformants were subsequently transferred to SD plates supplemented with galactose, raffinose, and X-β-gal. pB42AD-RhMYB70 was co-transformed with empty pLacZ vectors to serve as negative controls. The combination of pB42AD-RhHB1 and pLacZ-proRhGA20ox1 served as a positive control in the experiment [63]. Primer sequences are in Supplementary Table S3.
Dual-luciferase reporter assay
The dual-luciferase assay adhered to the methodology outlined by Jing & Jin et al [30, 59]. A dual-luciferase reporter assay was utilized to assess the transcriptional activity of the RhMYB70. For the effector construct, the coding sequence of RhMYB70 was amplified and inserted into the pBD vector. The empty pBD vector served as a negative control, whereas pBD-VP16 was employed as a positive control.
To generate reporter constructs for evaluating transactivation activity via a dual-luciferase reporter assay, the promoters of RhGA3ox3 and RhCESA8 were amplified and inserted upstream of the firefly luciferase (LUC) gene in the pGreenII 0800-LUC vector. Simultaneously, the coding sequence of RhMYB70 was amplified and introduced into the pGreenII 62-SK vector.
The resultant effector and reporter constructs were introduced into the Agrobacterium strain GV3101, which contained the pSoup plasmid. Agrobacterium cultures carrying the effector and reporter constructs were mixed in equal volumes and co-infiltrated into the leaves of N. benthamiana plants. Three days postinfiltration, the leaves were harvested and luciferase activity was measured. The ratio of LUC activity to Renilla luciferase (REN) activity was computed using a Dual-Luciferase Reporter Assay System (Promega). Luminescence was quantified with a luminometer, and images illustrating the patterns of luciferase activity were captured using a CCD camera. The primer sequences used in the assay are provided in Supplementary Table S3.
Chromatin immunoprecipitation-quantitative PCR
ChIP-qPCR was executed following the protocol detailed by Gong et al. [60]. Petals of roses that had been transiently overexpressing GFP-tagged proteins were cross-linked with a 1% (w/v) formaldehyde solution, which was then neutralized by the addition of glycine to a concentration of 0.125 M. Sonication was used to break the cross-linked chromatin, yielding DNA fragments between 400 and 750 bp in length. The GFP-tagged protein–DNA complexes were precipitated using GFP-Trap® A at a dilution of 1:1000 (Chromotek, gtma-20). After an incubation period of 4°C overnight with the antibody, magnetic beads were applied to collect the complexes. The beads were washed extensively, and the DNA was extracted. The crosslinks were reversed by a 65°C incubation for 6 h, followed by DNA purification using a PCR purification kit. The purified DNA was subsequently assessed by qPCR with primers specific to various genomic regions. A list of the qPCR primers can be found in Supplementary Table S3.
Cellulose content
Employing the Cellulose Content Assay Kit (BC4280, Solarbio Life Science Co., Ltd., Beijing, China), we quantified the cellulose in rose petals following the vendors’ specified procedures. We gathered petal samples from the natural states Stage 1, Stage 3, and Stage 5, as well as samples from various treatments at Stage 5: mock, GA3-treated, TRV and TRV-RhMYB70, TRV and TRV-RhCESA8, and TRV and TRV-RhGA3ox3. Prior to measurement, these samples underwent dehydration at 180°C to reach a consistent weight, followed by grinding into a fine powder. Precisely, 0.3 g of rose petal material was employed for the assay. Following the provided protocol, the spectrophotometer was set to a wavelength of 620 nm, using distilled water to calibrate the instrument to an absorbance baseline of 0 nm.
Phylogenetic analysis
Amino acid sequence alignment was achieved using DNAMAN software. For phylogenetic studies, MEGA-X was employed to construct phylogenetic trees. The trees were bolstered by 1000 bootstrap replications to ensure the robustness of the phylogenetic inferences.
Statistical analysis
All experimental procedures included a minimum of triplicate biological replications. The Student’s t-test was used for comparing two groups in the data analysis, while the Duncan’s test was utilized for comparisons among more than two groups. Significance was assigned to variations with a P-value < 0.05, indicating statistical relevance.
Supplementary Material
Acknowledgements
This work was supported by the National Natural Science Foundation of China (Grant number 32202530), Talent Introduction and Training Project of Yunnan Academy of Agricultural Sciences (Grant number 2024RCYP-09), Yunnan Province Agricultural Joint Key Project (Grant number 202401BD070001-016), and Fundamental Research Project (Grant number 202401CF070046), and Xingdian Talent Support Program (Grant number XDYC-QNRC-2023-0457).
Contributor Information
Feifei Gong, Beijing Key Laboratory of Development and Quality Control of Ornamental Crops, Department of Ornamental Horticulture, College of Horticulture, China Agricultural University, No. 2 Yuanmingyuan West Road, Haidian District, Beijing 100193, China.
Xiaoyu Wang, Flower Research Institute of Yunnan Academy of Agricultural Sciences, No. 2238 Beijing Road, Panlong District, Kunming, Yunnan 650205, China.
Qingcui Zhao, Beijing Key Laboratory of Development and Quality Control of Ornamental Crops, Department of Ornamental Horticulture, College of Horticulture, China Agricultural University, No. 2 Yuanmingyuan West Road, Haidian District, Beijing 100193, China.
Dan Wang, Flower Research Institute of Yunnan Academy of Agricultural Sciences, No. 2238 Beijing Road, Panlong District, Kunming, Yunnan 650205, China.
Huijun Yan, Flower Research Institute of Yunnan Academy of Agricultural Sciences, No. 2238 Beijing Road, Panlong District, Kunming, Yunnan 650205, China.
Qigang Wang, Flower Research Institute of Yunnan Academy of Agricultural Sciences, No. 2238 Beijing Road, Panlong District, Kunming, Yunnan 650205, China.
Yiping Zhang, Flower Research Institute of Yunnan Academy of Agricultural Sciences, No. 2238 Beijing Road, Panlong District, Kunming, Yunnan 650205, China.
Yixin Zhang, Flower Research Institute of Yunnan Academy of Agricultural Sciences, No. 2238 Beijing Road, Panlong District, Kunming, Yunnan 650205, China.
Hongying Jian, Flower Research Institute of Yunnan Academy of Agricultural Sciences, No. 2238 Beijing Road, Panlong District, Kunming, Yunnan 650205, China.
Xianqin Qiu, Flower Research Institute of Yunnan Academy of Agricultural Sciences, No. 2238 Beijing Road, Panlong District, Kunming, Yunnan 650205, China.
Kaixue Tang, Flower Research Institute of Yunnan Academy of Agricultural Sciences, No. 2238 Beijing Road, Panlong District, Kunming, Yunnan 650205, China.
Hao Zhang, Flower Research Institute of Yunnan Academy of Agricultural Sciences, No. 2238 Beijing Road, Panlong District, Kunming, Yunnan 650205, China.
Weikun Jing, Flower Research Institute of Yunnan Academy of Agricultural Sciences, No. 2238 Beijing Road, Panlong District, Kunming, Yunnan 650205, China.
Author contributions
W.J. designed the research plans, F.G. X.W., and Q.Z. performed the experiments. J.W., Q.W., D.W., X.Q., H.J., Y.Z., and H.W. provided technical support. Q.W., D.W., and H.J. provided conceptual advice. W.J., F.G., and Q.Z. performed data analysis. W.J. and F.G. wrote the manuscript.
Data availability
The transcriptome data were deposited in the NCBI Sequence Read Archive database under accession numbers PRJNA1162946. All data supporting the findings of this study are available within the paper and within its supplementary data published online.
Conflict of interest statement
The authors declare no conflict of interest.
Supplementary data
Supplementary data is available at Horticulture Research online.
References
- 1. Ma N, Xue J, Li Y. et al. Rh-PIP2;1, a rose aquaporin gene, is involved in ethylene-regulated petal expansion. Plant Physiol. 2008;148:894–907 [DOI] [PMC free article] [PubMed] [Google Scholar]
- 2. Pei H, Ma N, Tian J. et al. An NAC transcription factor controls ethylene-regulated cell expansion in flower petals. Plant Physiol. 2013;163:775–91 [DOI] [PMC free article] [PubMed] [Google Scholar]
- 3. Cosgrove DJ. Structure and growth of plant cell walls. Nat Rev Mol Cell Biol. 2024;25:340–58 [DOI] [PubMed] [Google Scholar]
- 4. McFarlane HE, Döring A, Persson S. The cell biology of cellulose synthesis. Annu Rev Plant Biol. 2014;65:69–94 [DOI] [PubMed] [Google Scholar]
- 5. Chen S, Ehrhardt DW, Somerville CR. Mutations of cellulose synthase (CESA1) phosphorylation sites modulate anisotropic cell expansion and bidirectional mobility of cellulose synthase. Proc Natl Acad Sci USA. 2010;107:17188–93 [DOI] [PMC free article] [PubMed] [Google Scholar]
- 6. Doi RH, Kosugi A. Cellulosomes: plant-cell-wall-degrading enzyme complexes. Nat Rev Microbiol. 2004;2:541-551. [DOI] [PubMed] [Google Scholar]
- 7. Zhang Y, Yu J, Wang X. et al. Molecular insights into the complex mechanics of plant epidermal cell walls. Science. 2021;372:706–11 [DOI] [PubMed] [Google Scholar]
- 8. Taylor NG, Laurie S, Turner SR. Multiple cellulose synthase catalytic subunits are required for cellulose synthesis in Arabidopsis. Plant Cell. 2000;12:2529–39 [DOI] [PMC free article] [PubMed] [Google Scholar]
- 9. Beeckman T, Przemeck GKH, Stamatiou G. et al. Genetic complexity of cellulose synthase A gene function in Arabidopsis embryogenesis. Plant Physiol. 2002;130:1883–93 [DOI] [PMC free article] [PubMed] [Google Scholar]
- 10. Pedersen GB, Blaschek L, Frandsen KEH. et al. Cellulose synthesis in land plants. Mol Plant. 2023;16:206–31 [DOI] [PubMed] [Google Scholar]
- 11. Yang W, Cai Y, Hu L. et al. PhCESA3 silencing inhibits elongation and stimulates radial expansion in petunia. Sci Rep. 2017;7:41471 [DOI] [PMC free article] [PubMed] [Google Scholar]
- 12. Fujioka S, Yamane H, Spray CR. et al. The dominant non-gibberellin-responding dwarf mutant (D8) of maize accumulates native gibberellins (GC-MS/internal standards/quantification/Zea mays). Proc Natl Acad Sci USA. 1988;85:9031–5 [DOI] [PMC free article] [PubMed] [Google Scholar]
- 13. Yamaguchi S. Gibberellin metabolism and its regulation. Annu Rev Plant Biol. 2008;59:225–51 [DOI] [PubMed] [Google Scholar]
- 14. Pimenta Lange MJ, Lange T. Gibberellin biosynthesis and the regulation of plant development. Plant Biol. 2006;8:281–90 [DOI] [PubMed] [Google Scholar]
- 15. Davière JM, Achard P. Gibberellin signaling in plants. Development. 2013;140:1147–51 [DOI] [PubMed] [Google Scholar]
- 16. He J, Xin P, Ma X. et al. Gibberellin metabolism in flowering plants: an update and perspectives. Front Plant Sci. 2020;11:532 [DOI] [PMC free article] [PubMed] [Google Scholar]
- 17. Olszewski N, Sun TP, Gubler F. Gibberellin signaling: biosynthesis, catabolism, and response pathways. Plant Cell. 2002;14:S61–80 [DOI] [PMC free article] [PubMed] [Google Scholar]
- 18. Otani M, Meguro S, Gondaira H. et al. Overexpression of the gibberellin 2-oxidase gene from Torenia fournieri induces dwarf phenotypes in the liliaceous monocotyledon Tricyrtis sp. J Plant Physiol. 2013;170:1416–23 [DOI] [PubMed] [Google Scholar]
- 19. Yang Y, Zhang L, Chen P. et al. UV-B photoreceptor UVR8 interacts with MYB73/MYB77 to regulate auxin responses and lateral root development. EMBO J. 2020;39:e101928 [DOI] [PMC free article] [PubMed] [Google Scholar]
- 20. Luo J, Ma N, Pei H. et al. A della gene, RhGAI1, is a direct target of EIN3 and mediates ethylene-regulated rose petal cell expansion via repressing the expression of RhCesA2. J Exp Bot. 2013;64:5075–84 [DOI] [PMC free article] [PubMed] [Google Scholar]
- 21. Chen C, Hussain N, Wang Y. et al. An ethylene-inhibited NF-YC transcription factor RhNF-YC9 regulates petal expansion in rose. Hortic Plant J. 2020;6:419–27 [Google Scholar]
- 22. Ren G, Li L, Huang Y. et al. GhWIP2, a WIP zinc finger protein, suppresses cell expansion in Gerbera hybrida by mediating crosstalk between gibberellin, abscisic acid, and auxin. New Phytol. 2018;219:728–42 [DOI] [PubMed] [Google Scholar]
- 23. Dubos C, Stracke R, Grotewold E. et al. MYB transcription factors in Arabidopsis. Trends Plant Sci. 2010;15:573–81 [DOI] [PubMed] [Google Scholar]
- 24. Zhang Y, Liang W, Shi J. et al. MYB56 encoding a R2R3 MYB transcription factor regulates seed size in Arabidopsis thaliana. J Integr Plant Biol. 2013;55:1166–78 [DOI] [PubMed] [Google Scholar]
- 25. Wu P, Peng M, Li Z. et al. DRMY1, a Myb-like protein, regulates cell expansion and seed production in Arabidopsis thaliana. Plant Cell Physiol. 2019;60:285–302 [DOI] [PubMed] [Google Scholar]
- 26. Sun X, Qin M, Yu Q. et al. Molecular understanding of postharvest flower opening and senescence. Mol Hortic. 2021;1:7. [DOI] [PMC free article] [PubMed] [Google Scholar]
- 27. Jung C, Seo JS, Han SW. et al. Overexpression of AtMYB44 enhances stomatal closure to confer abiotic stress tolerance intransgenic Arabidopsis. Plant Physiol. 2008;146:623–35 [DOI] [PMC free article] [PubMed] [Google Scholar]
- 28. Cao H, Chen J, Yue M. et al. Tomato transcriptional repressor MYB70 directly regulates ethylene-dependent fruit ripening. Plant J. 2020;104:1568–81 [DOI] [PubMed] [Google Scholar]
- 29. Wan J, Wang R, Zhang P. et al. MYB70 modulates seed germination and root system development in Arabidopsis. iScience. 2021;24:103228 [DOI] [PMC free article] [PubMed] [Google Scholar]
- 30. Jing W, Gong F, Liu G. et al. Petal size is controlled by the MYB73/TPL/HDA19-miR159-CKX6 module regulating cytokinin catabolism in Rosa hybrida. Nat Commun. 2023;14:7106. [DOI] [PMC free article] [PubMed] [Google Scholar]
- 31. Chen C, Hussain N, Ma Y. et al. The ARF2-MYB6 module mediates auxin-regulated petal expansion in rose (Rosa hybrida). J Exp Bot. 2023;74:4489–502 [DOI] [PubMed] [Google Scholar]
- 32. Liu X, Wu J, Ji F. et al. Transcriptomic profiling of rose flower under treatment of various phytohormones and plant growth regulators. Sci Data. 2022;9:669. [DOI] [PMC free article] [PubMed] [Google Scholar]
- 33. Han Y, Yu J, Zhao T. et al. Dissecting the genome-wide evolution and function of R2R3-MYB transcription factor family in Rosa chinensis. Genes (Basel). 2019;10:823. [DOI] [PMC free article] [PubMed] [Google Scholar]
- 34. Salazar-Cerezo S, Martínez-Montiel N, García-Sánchez J. et al. Gibberellin biosynthesis and metabolism: a convergent route for plants, fungi and bacteria. Microbiol Res. 2018;208:85–98 [DOI] [PubMed] [Google Scholar]
- 35. Xie Y, Chen L. Epigenetic regulation of gibberellin metabolism and signaling. Plant Cell Physiol. 2020;61:1912–8 [DOI] [PubMed] [Google Scholar]
- 36. Ueguchi-Tanaka M. Gibberellin metabolism and signaling. Biosci Biotechnol Biochem. 2023;87:1093–101 [DOI] [PubMed] [Google Scholar]
- 37. Cao Y, Li K, Li Y. et al. MYB transcription factors as regulators of secondary metabolism in plants. Biology (Basel). 2020;9: [DOI] [PMC free article] [PubMed] [Google Scholar]
- 38. Naing AH, Kim CK. Roles of R2R3-MYB transcription factors in transcriptional regulation of anthocyanin biosynthesis in horticultural plants. Plant Mol Biol. 2018;98:1–18 [DOI] [PubMed] [Google Scholar]
- 39. Zhang S, Zhao Q, Zeng D. et al. RhMYB108, an R2R3-MYB transcription factor, is involved in ethylene- and JA-induced petal senescence in rose plants. Hortic Res. 2019;6: [DOI] [PMC free article] [PubMed] [Google Scholar]
- 40. He G, Zhang R, Jiang S. et al. The MYB transcription factor RcMYB1 plays a central role in rose anthocyanin biosynthesis. Hortic Res. 2023;10:10. [DOI] [PMC free article] [PubMed] [Google Scholar]
- 41. Li K, Li Y, Wang Y. et al. Disruption of transcription factor RhMYB123 causes the transformation of stamen to malformed petal in rose (Rosa hybrida). Plant Cell Rep. 2022;41:2293–303 [DOI] [PubMed] [Google Scholar]
- 42. Yang T, Wang Y, Li Y. et al. The transcription factor RhMYB17 regulates the homeotic transformation of floral organs in rose (Rosa hybrida) under cold stress. J Exp Bot. 2024;75:2965–81 [DOI] [PMC free article] [PubMed] [Google Scholar]
- 43. Kelemen Z, Sebastian A, Xu W. et al. Analysis of the DNA-binding activities of the Arabidopsis R2R3-MYB transcription factor family by one-hybrid experiments in yeast. PLoS One. 2015;10:e0141044 [DOI] [PMC free article] [PubMed] [Google Scholar]
- 44. Millard PS, Kragelund BB, Burow M. R2R3 MYB transcription factors-functions outside the DNA-binding domain. Trends Plant Sci. 2019;24:934–46 [DOI] [PubMed] [Google Scholar]
- 45. Ohtani M, Demura T. The quest for transcriptional hubs of lignin biosynthesis: beyond the NAC-MYB-gene regulatory network model. Curr Opin Biotechnol. 2019;56:82–7 [DOI] [PubMed] [Google Scholar]
- 46. Kim WC, Kim JY, Ko JH. et al. Transcription factor MYB46 is an obligate component of the transcriptional regulatory complex for functional expression of secondary wall-associated cellulose synthases in Arabidopsis thaliana. Plant Physiol. 2013;170:1374–8 [DOI] [PubMed] [Google Scholar]
- 47. Kim WC, Ko JH, Kim JY. et al. MYB46 directly regulates the gene expression of secondary wall-associated cellulose synthases in Arabidopsis. Plant J. 2013;73:26–36 [DOI] [PubMed] [Google Scholar]
- 48. Mitsuda N, Seki M, Shinozaki K. et al. The NAC transcription factors NST1 and NST2 of Arabidopsis regulate secondary wall thickenings and are required for anther dehiscence. Plant Cell. 2005;17:2993–3006 [DOI] [PMC free article] [PubMed] [Google Scholar]
- 49. Zhong R, Demura T, Ye ZH. SND1, a NAC domain transcription factor, is a key regulator of secondary wall synthesis in fibers of Arabidopsis. Plant Cell. 2006;18:3158–70 [DOI] [PMC free article] [PubMed] [Google Scholar]
- 50. Zhong R, Lee C, Ye ZH. Functional characterization of poplar wood-associated NAC domain transcription factors. Plant Physiol. 2010;152:1044–55 [DOI] [PMC free article] [PubMed] [Google Scholar]
- 51. Li A, Xia T, Xu W. et al. An integrative analysis of four CESA isoforms specific for fiber cellulose production between Gossypium hirsutum and Gossypium barbadense. Planta. 2013;237:1585–97 [DOI] [PubMed] [Google Scholar]
- 52. Cosgrove DJ. Growth of the plant cell wall. Nat Rev Mol Cell Biol. 2005;6:850–61 [DOI] [PubMed] [Google Scholar]
- 53. Huang D, Wang S, Zhang B. et al. A gibberellin-mediated DELLA-NAC signaling cascade regulates cellulose synthesis in rice. Plant Cell. 2015;27:1681–96 [DOI] [PMC free article] [PubMed] [Google Scholar]
- 54. Teshome S, Kebede M. Analysis of regulatory elements in GA2ox, GA3ox and GA20ox gene families in Arabidopsis thaliana: an important trait. Biotechnol Biotechnol Equip. 2021;35:1603–12 [Google Scholar]
- 55. Woodger FJ, Millar A, Murray F. et al. The role of GAMYB transcription factors in GA-regulated gene expression. J Plant Growth Regul. 2003;22:176–84 [Google Scholar]
- 56. Zhong R, Richardson EA, Ye ZH. The MYB46 transcription factor is a direct target of SND1 and regulates secondary wall biosynthesis in Arabidopsis. Plant Cell. 2007;19:2776–92 [DOI] [PMC free article] [PubMed] [Google Scholar]
- 57. Noda S, Koshiba T, Hattori T. et al. The expression of a rice secondary wall-specific cellulose synthase gene, OsCesA7, is directly regulated by a rice transcription factor, OsMYB58/63. Planta. 2015;242:589–600 [DOI] [PubMed] [Google Scholar]
- 58. Yamada K, Norikoshi R, Suzuki K. et al. Cell division and expansion growth during rose petal development. J Jpn Soc Hortic Sci. 2009;78:356–62 [Google Scholar]
- 59. Jin W, Gong F, Zhang Y. et al. Cytokinin-responsive RhRR1-RhSCL28 transcription factor module positively regulates petal size by promoting cell division in rose. J Exp Bot. 2025;76:381–92 [DOI] [PubMed] [Google Scholar]
- 60. Gong F, Jing W, Jin W. et al. RhMYC2 controls petal size through synergistic regulation of jasmonic acid and cytokinin signaling in rose. Plant J. 2024;120:459–72 [DOI] [PubMed] [Google Scholar]
- 61. Tian J, Pei H, Zhang S. et al. TRV-GFP: a modified tobacco rattle virus vector for efficient and visualizable analysis of gene function. J Exp Bot. 2014;65:311–22 [DOI] [PMC free article] [PubMed] [Google Scholar]
- 62. Jiang C, Liang Y, Deng S. et al. The RhLOL1-RhILR3 module mediates cytokinin-induced petal abscission in rose. New Phytol. 2023;237:483–96 [DOI] [PubMed] [Google Scholar]
- 63. Lu P, Zhang C, Liu J. et al. RhHB1 mediates the antagonism of gibberellins to ABA and ethylene during rose (Rosa hybrida) petal senescence. Plant J. 2014;78:578–90 [DOI] [PubMed] [Google Scholar]
Associated Data
This section collects any data citations, data availability statements, or supplementary materials included in this article.
Supplementary Materials
Data Availability Statement
The transcriptome data were deposited in the NCBI Sequence Read Archive database under accession numbers PRJNA1162946. All data supporting the findings of this study are available within the paper and within its supplementary data published online.