Abstract
The multiple bonding between multinuclear zinc(II)–1,4,7,10-tetraazacyclododecane (cyclen, a 12-membered tetraamine) complexes and multidentate ligands is an effective method for constructing supramolecular complexes having well defined and distinct structures in aqueous solution. Herein we present examples of supramolecular D3h prisms formed by self-assembly of linearly dimeric or trimeric zinc(II)–cyclen complexes with a potentially trianionic C3 subunit trithiocyanuric acid (TCA3−), wherein Zn2+—S− or Zn2+—N− coordination bonds and hydrogen bonds are responsible for stability of the multicomponent architectures in aqueous solution at neutral pH.
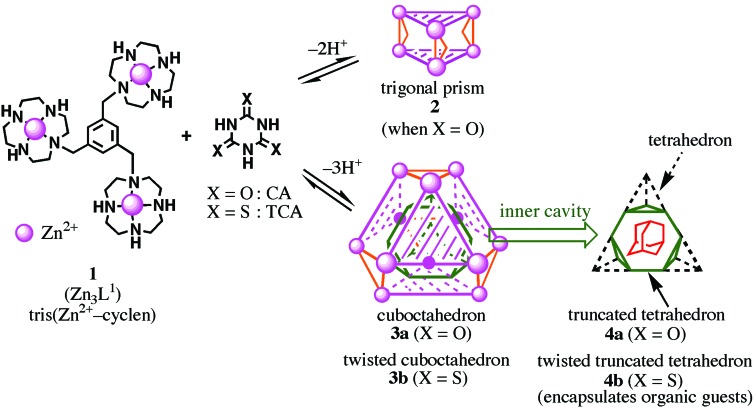
Artificial supramolecular hosts with stable and well defined structures formed by spontaneous self-assembly of molecular building blocks in organic solvents have shown great potential for inclusion phenomena, molecular recognition, or catalysis (1–12). However, supramolecular complexes that operate in aqueous solution are rare (10–14). While working on molecular recognition of imide functions by zinc(II) complexes of 12-membered tetraamine [Zn2+–1,4,7,10-tetraazacyclododecane (cyclen)] in aqueous solution (15–28), we tested interaction of cyanuric acid (CA) containing C3-symmetric three-imide functions with a C3-symmetric trinuclear zinc(II)–cyclen, Tris(Zn2+–cyclen) 1 [Zn3L1; L1 = 1,3,5-Tris(1,4,7,10-tetraazacyclododecan-1-ylmethyl)benzene]. We have discovered quantitative formation of a 2:3 1–dianionic CA (CA2−) complex at neutral pH that is represented schematically as a trigonal prism 2 (Fig. 1; ref. 29). More interestingly, we accidentally isolated a 4:4 assembly [(Zn3L1)4–(CA3−)4] from basic aqueous solution. The x-ray crystal structure showed four sets of completely deprotonated CA (CA3−) binding to three Zn2+–cyclen units from three different Zn3L1 at each N− rim (29). Its outer shape may be viewed as a cuboctahedron 3a with 12 vertices occupied by Zn2+ and its inner shell as a truncated tetrahedron 4a. It was unfortunate, however, to find that this 4:4 cuboctahedral complex collapsed in neutral H2O, possibly because of the extremely high pKa value of the third imide proton of CA. More recently (30), this problem was overcome by replacing CA for TCA, the thioimide functions of which possess lower pKa values [5.12 (pK1), 8.24 (pK2), and 11.69 (pK3)] than those of CA [6.85 (pK1), 10.91 (pK2), and >12 (pK3)]. As anticipated, TCA acted as a tridentate donor for three Zn3L1 at neutral pH to yield a similar type of the 4:4 self-assembling supercomplex 3b, in which the deprotonated TCA3− in an aromatic 1,3,5-triazine bound to 1 through Zn2+—S− (exocyclic) coordination bonds, and thus the 4:4 assembly is a chiral, twisted cuboctahedron. More interestingly, 3b [(Zn3L1)4–(TCA3−)4] encapsulates various size-matched and hydrophobic guest molecules such as adamantane in its inner cavity, which is represented as a twisted, truncated tetrahedron 4b. Thus, we discovered an approach to design various supramolecular structures in aqueous solution.
Figure 1.
Supramolecular self-assemblies to trigonal prism and cuboctahedral complexes from Tris(Zn2+–cyclen) 1 and CA and trithiocyanuric acid (TCA) in aqueous solution.
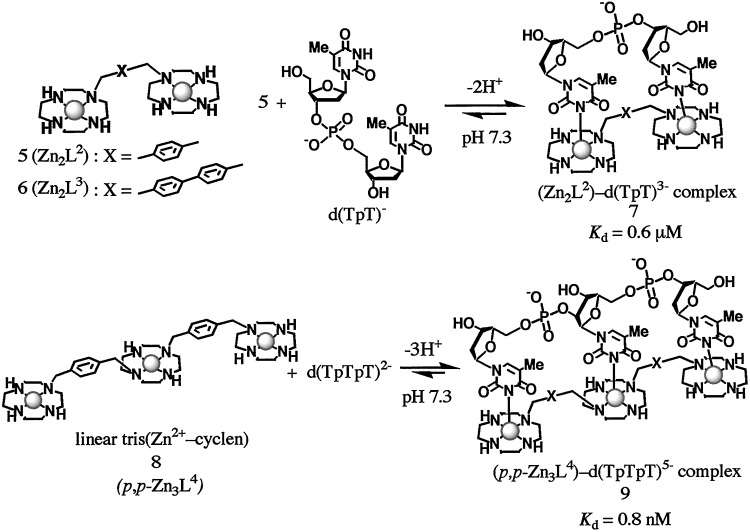
Meanwhile, we had designed a linearly trimeric zinc(II) complex 8 (abbreviated here as p,p-Zn3L4), which has three (Zn2+–cyclen) units connected by two p-xylyl units, to examine selective and efficient recognition of three linear imide functions, i.e., thymidilyl(3′-5′)thymidilyl(3′-5′)thymidine [d(TpTpT)2−] (Fig. 2; ref. 31). As anticipated, extremely efficient association was found with the dissociation constant (Kd) of 0.8 nM for p,p-Zn3L4–[d(TpTpT)5−] complex 9 in aqueous solution at neutral pH, which was 1,000 times smaller than that (0.6 μM) for a dimeric Zn2+–cyclen 5–[d(TpT)3−] complex 7 (31–33).
Figure 2.
Selective and efficient recognition of d(TpT) and d(TpTpT) by bis(Zn2+–cyclen) 5 and linear Tris(Zn2+–cyclen) 8 in aqueous solution at neutral pH.
In the present work, we extended our previous principles to construct spherical supermolecules having a distinct structure by using TCA and various linear multi(Zn2+–cyclen) complexes as building blocks. We have succeeded in synthesizing supramolecular trigonal prisms 10a and 10b from Zn2L2 5 and Zn2L3 6, and another prism 11 from p,p-Zn3L4 8 with TCA3− in aqueous solution at neutral pH (Fig. 3).
Figure 3.
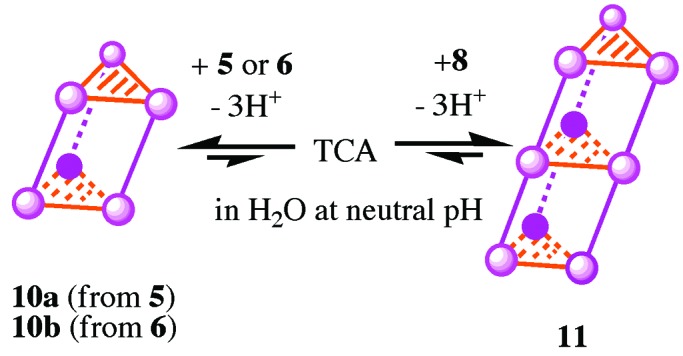
Schematic presentation of trigonal prisms (D3h) 10 and 11 formed by self-assembly of TCA with a bis(Zn2+–cyclen) (5 or 6) and a linear Tris(Zn2+–cyclen) 8 in aqueous solution at neutral pH.
Materials and Methods
All aqueous solutions were prepared by using deionized and redistilled water. Complexes 5 and 8 were prepared according to our previous papers (28, 31, 32). The Hepes {2-[4-(2-hydroxyethyl)-1-piperazinyl]ethanesulfonic acid, pKa = 7.6 at 25°C} buffer was purchased from Dojindo Laboratories (Kumamoto, Japan) and used without further purification. Melting points were measured on Yanaco Melting Point apparatus and listed without correlation. IR spectra were recorded on a Horiba Fourier transform infrared spectrometer FT-710. 1H and 13C NMR spectra were recorded on a JEOL Alpha 400-MHz or Lambda 500-MHz spectrometer. 3-(Trimethylsilyl)propionionic–2,2,3,3-d4 acid sodium salt (TSP) in D2O or 1,4-dioxane were used as external references of 1H NMR and 13C NMR experiments, respectively. The pD values in D2O were corrected for a deuterium isotope effect by using pD = (pH − meter reading) + 0.40. Elemental analysis was performed on a Perkin–Elmer CHN Analyzer 2400.
Isolation of 10a⋅6NO3⋅6H2O.
5⋅4(NO3−)⋅2H2O (124 mg, 0.14 mmol; refs. 26 and 30), TCA (18 mg, 0.10 mmol), and NaNO3 (0.84 g, 9.9 mmol) were dissolved in H2O (50 ml), and the pH was adjusted to 8.0 ± 0.1 by the addition of aqueous NaOH. The whole mixture was filtered and concentrated slowly in vacuo for 1 week, and colorless prisms of 10a⋅6(NO3−)⋅6H2O (80 mg, 67% yield) were obtained. mp > 250°C. IR (KBr): 3,450, 3,234, 2,924, 2,876, 2,361, 1,652, 1,428, 1,384, 1,230, 1,093, 970, 844 cm−1. 1H NMR (400 MHz, D2O/external TSP): δ 3.03–3.07 (96H, m, CH2 of cyclen), 3.55 (12H, brs, ArCH2), 6.82 (12H, brs, ArH). 13C NMR (100 MHz, D2O): δ 42.00, 43.60, 44.08, 48.24, 54.41, 130.23, 130.69, 183.36. Elemental analysis: calculated for C78H150N36O24S6Zn6, C, 36.58; H, 5.90; N, 19.69; Found: C, 36.86; H, 5.84; N, 19.53.
Isolation of 10b⋅6NO3⋅10H2O.
6⋅2(SO )⋅4H2O
(123 mg, 0.13 mmol, for synthesis, see Synthesis of
6⋅2(SO
 )⋅4H2O,
which is published as supporting information on the PNAS web
site, www.pnas.org), TCA (16 mg, 0.09 mmol), and
NaNO3 (0.11 g, 1.29 mmol) were dissolved in
H2O (50 ml), and the pH was adjusted to 8.0
± 0.1 by the addition of aqueous NaOH. The whole mixture was filtered
and concentrated slowly in vacuo for 1 week, and colorless
powders of
10b⋅6(NO
 )⋅10H2O
(110 mg, 86% yield) were obtained. mp > 250°C. IR (KBr):
3,432, 3,220, 2,922, 2,875, 1,628, 1,429, 1,383, 1,231, 1,092, 968
cm−1. 1H NMR (400 MHz,
D2O/external TSP): δ 2.65–2.74 (12H, m,
CH2 of cyclen), 2.76–2.98 (48H, m,
CH2 of cyclen), 3.04–3.17 (24H, m,
CH2 of cyclen), 3.23–3.36 (12H, m,
CH2 of cyclen), 3.88 (12H, brs,
ArCH2), 6.89 (12H, d,
J = 8.4 Hz, ArH), 7.04 (12H, d,
J = 8.4 Hz, ArH). 13C
NMR (125 MHz, DMSO-d6): δ 46.11,
17.79, 48.05, 52.31, 58.90, 129.88, 134.53, 134.82, 142.53, 187.56.
Elemental analysis: calculated for
C96H170N36O28S6Zn6,
C, 40.60; H, 5.99; N, 17.62; Found: C, 40.59; H, 5.81; N, 17.56.
Isolation of 11⋅9NO3⋅21.5H2O.
8⋅6(NO3−)⋅6H2O
(68 mg, 0.05 mmol; ref. 29), TCA (9 mg, 0.05 mmol), and
NaNO3 (0.38 g, 4.4 mmol) were dissolved in
H2O (50 ml), and the pH was adjusted to 8.0
± 0.1 by the addition of aqueous NaOH. The whole mixture was filtered
and concentrated slowly in vacuo for 1 week, and colorless
prisms of
11⋅9(NO )⋅21.5H2O
(42 mg, 60% yield) were obtained. mp > 250°C. IR (KBr): 2,924,
2,876, 1,456, 1,433, 1,384, 1,231, 1,094 cm−1.
1H NMR (400 MHz,
D2O/external TSP): δ 2.60–2.95 (36H, m,
CH2 of cyclen), 3.05–3.41 (108H, m,
CH2 of cyclen), 3.72 (12H, brs,
ArCH2), 3.88 (12H, brs,
ArCH2), 6.91 (12H, d,
J = 8.0 Hz, ArH), 7.02 (12H, d,
J = 8.0 Hz, ArH). 13C
NMR (125 MHz,
DMSO-d6/D2O):
δ 42.73, 43.03, 43.58, 44.37, 44.47, 45.08, 49.39, 49.61, 55.41,
56.02, 129.21, 130.74, 131.39, 131.87, 132.64, 184.44, 184.90.
Elemental analysis: calculated for
C129H259N54O48.5S9Zn9,
C, 36.72; H, 6.19; N, 17.92; Found: C, 36.81; H, 6.00; N, 17.65.
Selected X-Ray Structural Analysis Data for 11⋅9NO3⋅21.5H2O.
Formula C129H259N54O48.5S9Zn9, molecular weight = 4,219.76, crystal dimension 0.30 × 0.20 × 0.15, space group P1 (No. 2), a = 15.465(2) Å, b = 21.438(2) Å, c = 29.380(3) Å, α = 92.417(2)°, β = 94.281(1)°, γ = 95.367(3)°, V = 9,659(2) Å3, Z = 2, Dcalcd = 1.45 g⋅cm−3, μ(Mo Kα) = 15.41 cm−1, λ(Mo Kα) = 0.71069 Å; unique reflection collected (completeness = 0.83) on a Rigaku RAXIS-RAPID imaging plate diffractometer at 123.2 K; 2θmin = 10.0°, 2θmax = 51.0°, R = 0.14 for reflections with I > 2σ(I), R = 0.22 for all reflections; number of variables, 1,369. For CIF1 for 11⋅9NO3⋅21⋅5H2O, see Table 1, which is published as supporting information on the PNAS web site. Crystallographic data (excluding structure factors) for 11⋅9NO3⋅21.5H2O have been deposited with the Cambridge Crystallographic Data Centre as supplementary publication no. CCDC-174993 (copies of the data can be obtained free of charge on application to the CCDC, 12 Union Road, Cambridge CB21EZ, U.K.).
Potentiometric pH Titrations.
Potentiometric pH titrations were carried out with I =
0.10 (NaNO3) at 25.0 ± 0.1°C (0.1 N NaOH
was used as a base) as described earlier (19–26, 28–32), and at least
two independent titrations were performed. Deprotonation constants of
Zn2+-bound water
K ( =
[HO−-bound
species][H+]/[H2O-bound
species]) and apparent affinity constants
Kapp (defined by Eqs.
1–4 were determined by means of the program
BEST (34). The species distribution values (%)
against pH ( = −log[H+] + 0.084) were obtained
by using the program SPE (34).
UV Spectrophotometric Titrations and Fluorescence Titrations.
UV spectra and fluorescence (excitation and emission) spectra were recorded on a Hitachi U-3500 spectrophotometer and a Hitachi F-4500 fluorescence spectrophotometer, respectively, at 25.0 ± 0.1°C. The obtained data of UV titrations (decreases in ɛ values at a given wavelength) and fluorescence titrations (decreases in fluorescence emission intensity at a given wavelength) were analyzed for apparent complexation constants, Kapp, by using the program BIND WORKS (Calorimetry Sciences, Provo, UT). Quantum yield (Φ) of fluorescence was determined by comparison of the integrated corrected emission spectrum of a standard anthracene, the quantum yield of which in EtOH was assumed to be 0.30 ([anthracene] = 10 μM, excitation at 260 nm; ref. 35).
Electrospray Ionization (ESI) MS of 10a, 10b, and 11 Complexes.
ESI mass spectra were recorded on an LCT (reflectron time-of-flight MS) mass spectrometer (Micromass, Mancheser, U.K.). Aqueous solutions (100–200 ng/μl) of given complexes were analyzed by direct infusion at 10 μl/min. In the positive-ion mode the following conditions were used: ES capillary, 2.8 kV; cone, 10–15 V; flight time, 55 μsec; source block temperature, 20°C; desolvation temperature, 40°C. Mass spectra were scanned in the m/z range of 100–2,000 at 1 sec/scan with an interscan delay of 0.1 sec. Data were processed by using the spectrometer software (MASSLYNX). Theoretical distribution for the 2+ to 6+ species for 10 and 3+ to 9+ species for 11 with mass-to-charge ratios (m/z) were calculated by using the program MASSLYNX.
Results and Discussion
Isolation of Supramolecular Trigonal Prisms.
Mixing Zn2L (5 or 6) and TCA in a 3:2 ratio at pH 8.0 in aqueous solution and slow evaporation yielded colorless prisms. Their elemental analyses (C, H, N) were consistent with a formula [Zn2L2 (or Zn2L3)]3–(TCA3−)2, 10. From a 1:1 mixture of p,p-Zn3L4 (8) and TCA, fine colorless crystals of a 3:3 complex, (p,p-Zn3L4)3–(TCA3−)3 11 were isolated. The 3:3 structure of 11 was identified by x-ray crystallographic analysis (Fig. 4). Crystal data are presented in Materials and Methods. In Fig. 4A (top view) and 4B (side view), three molecules of 8 are colored in green-blue, green, and blue, and three TCA units are colored in orange with yellow sulfur atoms. Its exterior may be represented schematically as a trigonal prism 11 as shown in Fig. 3, the total prism length of which is ≈2.9 nm. The distance between two adjacent TCA3− is ≈1.2 nm. Of the three TCA3− units, the two terminal TCA3− units bind all to Zn2+ ions through S−—Zn2+ coordination bonds (2.31 Å in average), whereby the TCA3− takes an aromatic triazine form (Fig. 4C). Very interestingly, the central TCA3− unit has a lesser aromatic structure with the anion localizing more on the imide Ns, which are major donors to Zn2+ (Zn2+—N− distance is 2.07 Å in average) and supplementary Zn2+—S coordination (2.88 Å in average) bonds (ref. 36; Fig. 4D). As shown in Fig. 4E, three phenyl groups from three molecules of 8 are assembled very closely to each other. We assign the Zn2+—S− binding structures to the first trigonal prisms 10, as studied by the UV spectrophotometric titrations (vide infra).
Figure 4.
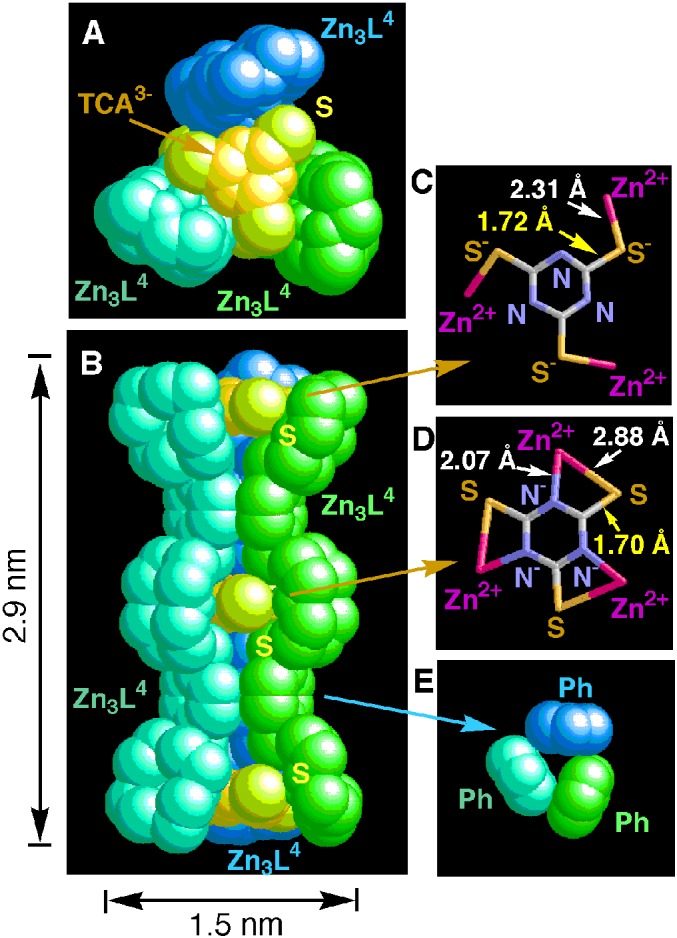
X-Ray crystal structure of 11⋅9NO3⋅21.5H2O (A, top view; B, side view). Nitrate anions and water molecules are omitted. Three molecules of 8 are colored in green, blue-green, and blue. TCA3− units are orange, and sulfur atoms are yellow. (C) Two TCA3− parts at edges bind to 8 through Zn2+—S− (2.31 Å in average) coordination bonds. (D) The TCA3− part at the middle bind to 8 through Zn2+—N− (2.07 Å in average) and Zn2+—S (2.88 Å in average) coordination bonds. (E) Three phenyl groups from three 8 units.
1H NMR Spectral Changes in Formation of the Supramolecular Complexes in D2O at pD 7.0.
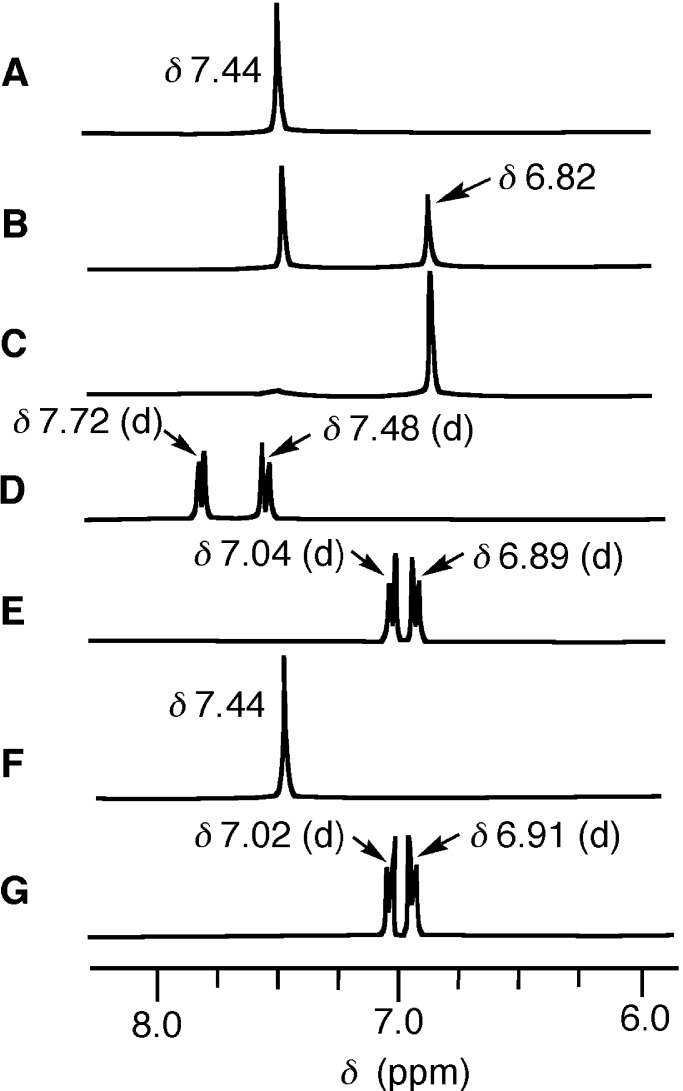
We followed the binding of 5, 6, and 8 with TCA by 1H NMR spectral changes in D2O at pD 7.0 ± 0.2 and 35°C. Fig. 5A shows a broad singlet of aromatic protons of 5 (all equivalent; 3 mM) at δ 7.44 against an external reference, TSP. As we added TCA (1 and 2 mM) to 5, Fig. 5 B and C were obtained. The final broad singlet appearing at δ 6.82 indicates that a single product species is formed by assembly of 5 with TCA in a 3:2 ratio to yield 10a in D2O. A fact that two independent signals are observed for 5 and the 5–TCA complex indicates that the 5–TCA complex is not only thermodynamically but also kinetically stable on the NMR time scale (28–32). Similarly, another Zn2L3 6 (1.5 mM) with two doublets at δ 7.48 and 7.72 showed upfield shifts to δ 6.89 and 7.04 after mixing with TCA (1.0 mM) under the same conditions (Fig. 5 D and E), indicating the formation of a similar 3:2 supramolecular prism 10b.
Figure 5.
The 1H NMR spectral change of 5, 6, and 8 (aromatic regions) after the addition of TCA in D2O at pD 7.0 ± 0.2 and 35°C: A, 3.0 mM 5; B, 3.0 mM 5 + 1.0 mM TCA; C, 3.0 mM 5 + 2.0 mM TCA; D, 0.5 mM 6; E, 0.6 mM 6 + 0.4 mM TCA; F, 0.5 mM 8; and G, 0.5 mM 8 + 0.5 mM TCA.
When
p,p-Zn3L4
8 (2 mM) with a broad singlet at δ 7.44 (Fig.
5F) was mixed with TCA (2 mM), two distinct doublets at δ
6.91 and 7.02 replaced them, as shown in Fig. 5G. This fact
supports the structure of the 3:3 supramolecular complex 11,
in which the benzene protons near the middle TCA and terminal TCA are
in a different environment because of the different
TCA—Zn2+ binding modes (Fig. 4). The addition
of 10–50 equivalents of F−,
Cl−, Br−,
I−,
ClO ,
N
,
N , and
SO
 caused negligible change
of the 1H NMR spectra of 11
(PF
 caused precipitation).
Potentiometric pH Titrations for the 3:3 (8/TCA) and 3:2 (5/TCA) Assemblies in Aqueous Solution.
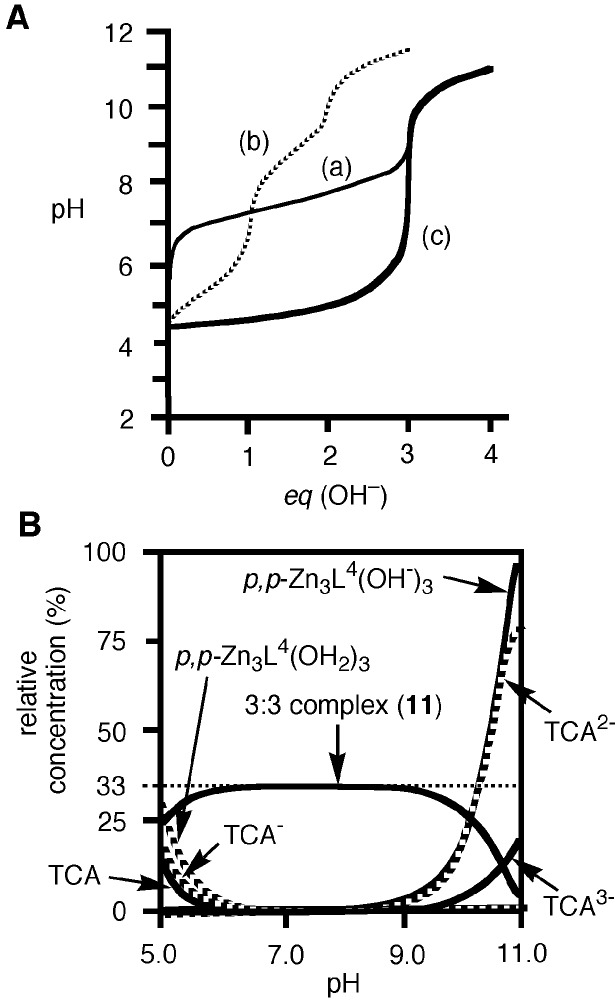
Fig. 6A shows typical pH titration curves for 0.5 mM 8 (curve a, pKa values of three Zn2+-bound waters of 8 are 6.98, 7.41, and 8.02; ref. 31), 0.5 mM TCA (curve b), and 0.5 mM 8 + 0.5 mM TCA (curve c). The curve c with a distinct break at eq(OH−) = 3 supports that the three protons of all TCA are deprotonated to bind with all the Zn2+–cyclen units under pH 6.5. Analysis of the pH titration curves by the program BEST (34) was in good agreement with the formation of a 3:3 complex 11. Fig. 6B is a speciation diagram of seven possible species, p,p-Zn3L4(H2O)3, p,p-Zn3L4(OH−)3, TCA, TCA−, TCA2−, TCA3−, and [(p,p-Zn3L4)3–(TCA3−)3 (11)], for the 0.5 mM 8 + 0.5 mM TCA mixture as a function of pH at 25°C with I = 0.1 (NaNO3). The nearly quantitative population of the 3:3 complex 11 is apparent at 6.4 < pH < 8.8. The apparent 3:3 complexation constant for 11, log Kapp (defined by Eqs. 1–3 at pH 7.0) was calculated to be 30.6 ± 2.0. A similar potentiometric pH titration of 0.75 mM 5 + 0.5 mM TCA gave the apparent 3:2 complexation constant for 10a, log Kapp (defined by Eq. 4) of 26.3 ± 1.0 at pH 8.0 and a similar speciation diagram showing >95% formation of 10a at 7.2 < pH < 8.2.
 |
1 |
 |
 |
2 |
 |
 |
3 |
 |
4 |
Figure 6.
(A) Typical pH titration curves of 0.5 mM 8 (a), 0.5 mM TCA (b), and 0.5 mM 8 + 0.5 mM TCA (c) in aqueous solution with I = 0.1 (NaNO3) at 25°C, where eq(OH−) is the number of equivalents of base (NaOH) added. (B) Speciation diagram for the 8 and TCA species in a 0.5 mM 8/0.5 mM TCA mixture as a function of pH at 25°C with I = 0.10 (NaNO3). For clarity, the species less than 5% are omitted.
UV Spectrophotometric Titrations of the Supramolecular Complexes 10a and 11 and Fluorescence Titration of 10b.
From UV spectrophotometric titration of TCA (30 μM) with 5 and 8 in 50 mM Hepes (pH 7.0) with I = 0.1 (NaNO3; see Fig. 8, which is published as supporting information on the PNAS web site, www.pnas.org), almost quantitative 2:3 and 3:3 complexation to 10a and 11, respectively, has been established. Understandingly from the result of the x-ray crystal structure analysis, considerable differences were observed for the UV spectra of TCAs in 10a and 11. The uncomplexed TCA has absorption maxima (λmax) at 283 nm [ɛ 4.1 × 10⁴ (M−1⋅cm−1)] and 323 nm [ɛ 2.8 × 10⁴ (M−1⋅cm−1)] at pH 7.0 (where [TCA]: [TCA−-]:[TCA2−]:[TCA3−] distribution is estimated to be 1:93:6:0). In the 2:3 complex 10a, the two TCA took aromatic TCA3− forms, and the UV absorption maximum shifted to λmax at 268 nm with ɛ 4.1 × 10⁴ (M−1⋅cm−1) per TCA unit, which was almost the same value as that [ɛ 4.1 × 10⁴ (M−1⋅cm−1) at λmax of 268 nm] for the aromatic TCA3− moiety in the cuboctahedron 3b (30). On the other hand, in the 3:3 complex 11 having the two aromatic TCA3− at terminals and the one less aromatic TCA3− at the central prism, absorption maximum shifted to 278 nm with ɛ 3.1 × 10⁴ (M-1⋅cm−1) per TCA, which corresponds to 76% of the ɛ268 value for the aromatic TCA3− unit in 10a (see Fig. 9, which is published as supporting information on the PNAS web site). This fact, although qualitative, supports that the middle TCA3− in 11 indeed is not fully aromatic but rather in a thioketo form in aqueous solution.
The changes of fluorescence excitation and emission of 6 [10 μM; quantum yield (Φ) = 0.23] in interaction with TCA are noteworthy. Fluorescence emission of 6 was quenched quantitatively after the addition of 0.66 equivalents of TCA against 6 in 10 mM Hepes [pH 7.0 with I = 0.1(NaNO3) (emission at 260 nm)] at 25°C (see Fig. 10, which is published as supporting information on the PNAS web site), a fact suggesting that three biphenyl units may be assembled somewhat specifically in 10b.
ESI MS of Supramolecular Assemblies.
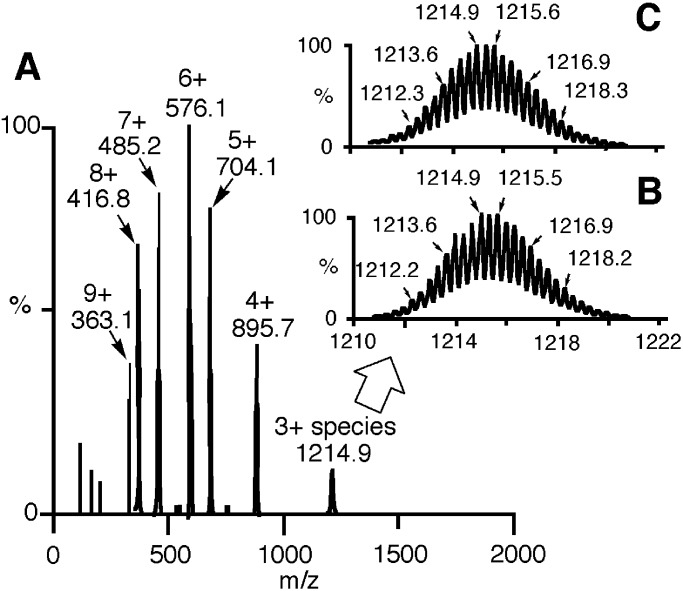
We measured ESI MS of 10a, 10b, and 11 in H2O (pH 7.5 ± 0.1) to confirm the supramolecular 2:3 and 3:3 structures. The 2+, 3+, 4+, 5+, and 6+ species for 10a and 10b and 2+–9+ species for 11 with mass-to-charge ratios (m/z) were observed. Fig. 7A shows the ESI/time-of-flight mass spectra for 11 (0–2,000 m/z) along with observed peaks for 3+ species (Fig. 7B), which matched to the theoretical distribution (Fig. 7C). For the spectra for 10a and 10b, see Figs. 11 and 12, which are published as supporting information on the PNAS web site).
Figure 7.
(A) ESI mass spectra of 11. Observed peaks (B) and theoretical distribution (C) for 3+ species of 11 ([11⋅6(NO3)]3+) are shown.
Conclusion
We have discovered a way of building supramolecular trigonal prisms, 10a, 10b, and 11, by quantitative self-assembly of bis(Zn2+–cyclen)s, 5 and 6, and linear Tris(Zn2+–cyclen) 8 with TCA. The supramolecular products were characterized by x-ray crystal analysis, potentiometric pH titrations, UV spectrophotometric titrations, fluorescence titrations, and 1H NMR titrations, and ESI MS and were found to be stable thermodynamically and kinetically (on the NMR time scale) in aqueous solution at neutral pH. Their stability mostly comes from the stable Zn2+—S− and Zn2+—N−(imide) coordinations, presumably aided by hydrophobic and/or C—H—π interaction between three phenyl rings from the Zn2+–cyclen components. Although functions such as encapsulation of organic and inorganic guest molecules in 10 and 11 remain to be seen, these supramolecular motifs should set a design of new supramolecular complexes in aqueous solution and may have wide applications.
Supplementary Material
Acknowledgments
We thank Ms. Sanae Furusho, JASCO International (Myojin-cho 11-10, Tokyo) for ESI MS. We also thank the Research Center for Molecular Medicine at Hiroshima University for NMR instruments (a JEOL Alpha 400-MHz spectrometer). This work was supported by Ministry of Education, Science, and Culture (Tokyo) Grants 08249103 and 12470479 (to E.K.) and 12033237, 12771355, and 13557195 (to S.A.). S.A. is also thankful to Nissan Science Foundation (Tokyo), Uehara Memorial Foundation (Tokyo), Asahi Glass Foundation (Tokyo), and the Research Foundation for Pharmaceutical Sciences (Tokyo).
Abbreviations
- cyclen
1,4,7,10-tetraazacyclododecane
- CA
cyanuric acid
- TCA
trithiocyanuric acid
- TSP
3-(trimethylsilyl)propionionic–2,2,3,3-d4 acid sodium salt
- ESI
electrospray ionization
Footnotes
This paper was submitted directly (Track II) to the PNAS office.
Data deposition: The atomic coordinates have been deposited in the Cambridge Structural Database, Cambridge Crystallographic Data Centre, Cambridge CB2 1EZ, United Kingdom (CSD reference no. 174993).
References
- 1.Cram D J, Cram J M. Container Molecules and Their Guests. Cambridge, U.K.: R. Soc. Chem.; 1994. [Google Scholar]
- 2.Lehn J-M. Supramolecular Chemistry: Concepts and Perspectives. New York: VCH; 1995. [Google Scholar]
- 3.Whitesides G M, Shimanek E E, Mathias J P, Seto C T, Chin D N, Mammen M, Gordon D M. Acc Chem Res. 1995;28:37–44. [Google Scholar]
- 4.Philip D, Stoddart J F. Angew Chem Int Ed Engl. 1996;35:1155–1196. [Google Scholar]
- 5.Conn M M, Rebek J., Jr Chem Rev (Washington, DC) 1997;97:1647–1668. doi: 10.1021/cr9603800. [DOI] [PubMed] [Google Scholar]
- 6.Linton B, Hamilton A D. Chem Rev (Washington, DC) 1997;97:1669–1680. doi: 10.1021/cr960375w. [DOI] [PubMed] [Google Scholar]
- 7.MacGillivray L R, Awood J L. Angew Chem Int Ed Engl. 1999;38:1018–1033. doi: 10.1002/(SICI)1521-3773(19990419)38:8<1018::AID-ANIE1018>3.0.CO;2-G. [DOI] [PubMed] [Google Scholar]
- 8.Leininger S, Olenyuk B, Stang P J. Chem Rev (Washington, DC) 2000;100:853–908. doi: 10.1021/cr9601324. [DOI] [PubMed] [Google Scholar]
- 9.Greig L M, Philip D. Chem Soc Rev. 2001;30:287–302. [Google Scholar]
- 10.Fujita M. Molecular Self-Assembly Organic Versus Inorganic Approaches. Berlin: Springer; 2000. [Google Scholar]
- 11. Fujita, M., Umemoto, K., Yoshizawa, M., Fujita, N., Kusukawa, T. & Biradha, K. (2000) J. Chem. Soc. Chem. Commun. 509–518.
- 12. Caulder, D. L. & Raymond, K. N. (1999) J. Chem. Soc. Dalton Trans. 1185–1200.
- 13. Shivanyuk, A. & Rebek, J., Jr. (2001) J. Chem. Soc. Chem. Commun. 2374–2375. [DOI] [PubMed]
- 14. Atwood, J. L., Barbour, L. J. & Jerga, A. (2001) J. Chem. Soc. Chem. Commun. 2376–2377. [DOI] [PubMed]
- 15.Kimura E. In: Progress in Inorganic Chemistry. Karlin K D, editor. Vol. 41. New York: Wiley; 1994. pp. 443–491. [Google Scholar]
- 16.Kimura E, Koike T, Shionoya M. In: Structure and Bonding: Metal Site in Proteins and Models. Sadler P J, editor. Vol. 89. Berlin: Springer; 1997. pp. 1–28. [Google Scholar]
- 17. Kimura, E. & Koike, T. (1998) J. Chem. Soc. Chem. Commun. 1495–1500.
- 18.Kimura E. Acc Chem Res. 2001;34:171–179. doi: 10.1021/ar000001w. [DOI] [PubMed] [Google Scholar]
- 19.Shionoya M, Kimura E, Shiro M. J Am Chem Soc. 1993;115:6730–6737. [Google Scholar]
- 20.Shionoya M, Ikeda T, Kimura E, Shiro M. J Am Chem Soc. 1994;116:3848–3859. [Google Scholar]
- 21.Koike T, Takashige M, Kimura E, Fujioka H, Shiro M. Chem Eur J. 1996;2:617–623. [Google Scholar]
- 22.Fujioka H, Koike T, Yamada N, Kimura E. Heterocycles. 1996;42:775–787. [Google Scholar]
- 23.Kimura E, Aoki S, Koike T, Shiro M. J Am Chem Soc. 1997;119:3068–3076. [Google Scholar]
- 24.Koike T, Gotoh T, Aoki S, Kimura E. Inorg Chim Acta. 1998;270:424–432. [Google Scholar]
- 25.Kimura E, Ikeda T, Aoki S, Shionoya M. J Biol Inorg Chem. 1998;3:259–267. [Google Scholar]
- 26.Aoki S, Honda Y, Kimura E. J Am Chem Soc. 1998;120:10018–10026. [Google Scholar]
- 27.Kikuta E, Murata M, Katsube N, Koike T, Kimura E. J Am Chem Soc. 1999;121:5426–5436. [Google Scholar]
- 28.Aoki S, Kimura E. J Am Chem Soc. 2000;122:4542–4548. [Google Scholar]
- 29.Aoki S, Shiro M, Koike T, Kimura E. J Am Chem Soc. 2000;122:576–584. [Google Scholar]
- 30.Aoki S, Shiro M, Kimura E. Chem Eur J. 2002;8:929–939. doi: 10.1002/1521-3765(20020215)8:4<929::aid-chem929>3.0.co;2-q. [DOI] [PubMed] [Google Scholar]
- 31.Kimura E, Kikuchi M, Kitamura H, Koike T. Chem Eur J. 1999;5:3113–3123. [Google Scholar]
- 32.Aoki S, Sugimura C, Kimura E. J Am Chem Soc. 1998;120:10094–10102. [Google Scholar]
- 33.Kikuta E, Aoki S, Kimura E. J Am Chem Soc. 2001;123:7911–7912. doi: 10.1021/ja0108335. [DOI] [PubMed] [Google Scholar]
- 34.Martell A E, Motekaitis R J. Determination and Use of Stability Constants. 2nd Ed. New York: VCH; 1992. [Google Scholar]
- 35.Murov S L, Carmichael I, Hug G L. Handbook of Photochemistry. 2nd Ed. New York: Dekker; 1993. [Google Scholar]
- 36.Clegg W, Davies J E, Elsegood M R J, Lamb E, Longridge J J, Rawson J J, Snaith R, Wheatley A E H. Inorg Chem Commun. 1998;1:58–60. [Google Scholar]
Associated Data
This section collects any data citations, data availability statements, or supplementary materials included in this article.


