Abstract
The recent series of anthrax attacks has reinforced the importance of biosurveillance systems for the timely detection of epidemics. This paper describes a statistical framework for monitoring grocery data to detect a large-scale but localized bioterrorism attack. Our system illustrates the potential of data sources that may be more timely than traditional medical and public health data. The system includes several layers, each customized to grocery data and tuned to finding footprints of an epidemic. We also propose an evaluation methodology that is suitable in the absence of data on large-scale bioterrorist attacks and disease outbreaks.
Keywords: biosurveillance‖time series analysis‖grocery data
We describe a statistical system designed for biosurveillance that is part of a larger project investigating ways to use information technology to improve clinical preparedness for bioterrorism (1). Our goal is evaluating the possible use of non-public health data, and in particular grocery sales, for the early detection of a bioterrorism attack. The potential of these data for timely detection lies in the earlier manifestation of an attack in grocery and over-the-counter (OTC) medication sales, and in their high level of detail.
We begin in the next section by providing background and a characterization of an outbreak of a bioagent, focusing on anthrax. Then we describe traditional data collected from medical and public health sources and their ability to detect attacks in a timely fashion, before turning to grocery data and the detection system that we developed. We also introduce a method for evaluating the detection system in the absence of a bioagent footprint in the data, and for tuning the system to the input data. We end with some observations on the usefulness of our approach.
Historical and Current Biological Outbreaks
Various bioagents have been identified as possible weapons in biological warfare. Here, we focus on anthrax to illustrate how a detection system that tracks OTC medication sales can provide more timely signals than traditional systems that track medical and public health data. The statistical framework is general, however, and can be applied for the detection of other agents.
Inhalational anthrax results from inhaling an aerosol of anthrax spores into the respiratory tract, is invariably fatal, and is considered the most likely weapon in biological warfare. Since 1998, U.S. military personnel have been immunized against anthrax on a regular basis (2). Given the large number of other bioagents that could be used during a biological war, the possibility of vaccinating the entire population against all strains of bioagents is very low. The fact that early treatment of infected people increases their likelihood of survival has reinforced the broad agreement among scientists that the best defense against biological attack is an early warning system. Thus, early detection biosurveillance systems are essential if public health and other officials are to react quickly when an epidemic is beginning.
Even though the Biological Weapon and Toxins Convention prohibits research on or production of offensive biological weapons, and has been signed by most countries, several countries and autonomous terrorist groups are believed to have such programs. It is especially difficult to predict, detect, or prevent a bioterrorism attack (3).
Known outbreaks of inhalational anthrax include the recent October 2001 mail-delivered anthrax envelopes in Florida, New York, Washington, DC, and New Jersey; the 1979 Sverdlovsk, Russia accident; the 1995 releases in a Tokyo subway by the terrorist group Aum Shinrikyo (3); and the 1959 outbreak in New Hampshire. From these incidents, we have learned about the fatal results and the importance of timely detection and treatment in cases of bioterrorism attacks.
The 1979 Sverdlovsk outbreak is believed to have been caused by an accidental release of Bacillus anthracis spores from a military microbiology facility nearby to where the victims lived and worked (4). This release resulted in at least 79 cases of anthrax infection and 68 documented deaths (3, 5). According to the pathologists who made the diagnosis for 42 autopsies, healthy people died within 1–4 days from contracting the bacteria (6).
An earlier outbreak occurred during a study conducted at the Arms Textile Mill in Manchester, NH in 1959. After the deaths of several workers between 1957–1959 from cutaneous anthrax, a controlled experiment was conducted at the Arms Textile Mill and at three other mills in the northeastern states. The experimental group was vaccinated against anthrax, whereas the control group received a placebo. Several months after the study began an outbreak of inhalational anthrax occurred, and because the vaccination proved to be effective, all workers were vaccinated and the experiment was terminated (2, 7).
In 1993, the U.S. Congressional Office of Technology Assessment estimated that up to 3 million deaths could follow a release of 100 kg of anthrax spores upwind of the Washington, DC area, and an economic model developed by the Centers for Disease Control and Prevention suggested a cost of $26.2 billion per 100,000 people exposed (3).
Medical and Public Health Data
Early diagnosis of inhalational anthrax would be difficult and would require a high index of suspicion (3). For this reason, the use of nontraditional data sources, such as grocery and pharmacy data, school attendance records, uses of web sources, etc., could improve the chances of detection. In the wake of the attacks on the World Trade Center and the Pentagon on September 11, 2001, the diagnosis of subsequent anthrax attacks was very quick, and the public, as well as the public health system, governmental organizations, and the U.S. postal service were especially sensitive to suspicious powder-like substances and anthrax-related symptoms. If anthrax or a different bioagent were released without a heightened public alert, the effects would be harder to detect and diagnose quickly (8).
Inhalational anthrax has been described as a two-stage illness. The first stage, which can take a few hours to a few days, includes a spectrum of nonspecific symptoms such as fever, sweat, fatigue, malaise, cough, sore throat, shortness of breath, chest discomfort, nausea, vomiting, diarrhea, and headache (2, 9). Infected people might not seek emergency medical services, but rather purchase OTC medication, look for symptoms on the web, etc. If the infection is detected at this stage, then rapid treatment with antibiotics and other medical procedures can improve survival, whereas a delay even by hours may lessen chances of survival. In this case as in other lethal, rapidly developing diseases (e.g., gastrointestinal anthrax) that are hard to diagnose early, tracking OTC medications and other sources of early warning data might improve the chances of timely detection and treatment.
The second stage of inhalational anthrax develops rapidly, and patients exhibit much more extreme symptoms. Death may occur in as little as 2–48 h (3). Unlike what we observed in the fall of 2001, when the country was on heightened alert and small numbers of people were exposed (i.e., only 11 cases spread geographically), diagnosis of large-scale inhalational anthrax exposure based on medical and public health facilities would more likely occur after a large number of patients seeking medical treatment in some geographical area with an acute-onset flu-like illness and case fatality rate of 80% or more, usually within 24–48 h. In addition, blood tests would provide only a preliminary diagnosis 6–24 h later and could possibly go unidentified if the lab had not been alerted to the possibility of anthrax, whereas rapid diagnostic tests are available only at national reference laboratories (3).
For less severe bioagents, such as cutaneous anthrax (e.g., the 12 cases that have been detected on the East Coast during September and October 2001 (9)), death is rare if antibiotic treatment is given on time. Without antibiotic therapy however, the mortality rate has been reported to be as high as 20% (3). In such cases, a timely detection could mean the difference between complete recovery and a high probability of death.
Tracking Grocery Data
Grocery and OTC medication sales have three main advantages for the detection of an outbreak: First, these datasets are typically very large and rich, including information on each purchased item and in many cases include customer information (e.g., address). They are also available on a more frequent scale, such as daily and even hourly basis, and do not include delays in reporting as compared with medical and public health sources which are typically collected weekly or even less frequently, and might contain delays. Second, the outbreak footprint would probably exist in these data earlier than in medical or public health data, because of self treatment that people usually pursue before seeking medical assistance. Third, although grocery and OTC sales do not measure illness directly, we might infer specific symptoms experienced by purchasers at a relatively early stage of the onset of the disease.
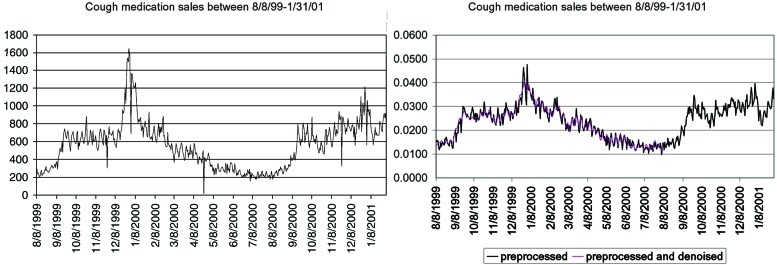
The main problem with grocery and OTC medication sales is their noisy nature. Fig. 1 Left illustrates a series of daily sales of cough medication at a major retailer with many branches in the Allegheny County, PA area, between August 8, 1999 and January 31, 2001.§ We monitored this series because cough is a major symptom of inhalational anthrax.
Figure 1.
Sales of cough OTC medication between 8/8/99 and 1/31/01: raw data (Left) and after preprocessing and de-noising (Right).
There are two main causes that influence the sales of cough medication other than an anthrax attack: general patterns of sales at grocery stores, and outbreaks of diseases such as influenza, where cough is a major symptom as well.
Fortunately, during this 1999–2001 period, there was no known anthrax outbreak in this area. Nonetheless, the sales of cough medication have widely varied patterns: a seasonal effect, with winter sales higher and more chaotic than summer sales, a weekly effect showing higher sales during weekends, peak sales on holidays, and low sales on days when many stores are closed (e.g., Easter on April, 24, 2000).
Our proposed detection system consists of several layers (A.G., G.S., and R.A.C., unpublished results). The first layer preprocesses the data by accounting for store level sales. The second layer puts the preprocessed data through a denoising filter. We use the discrete cosine transform (10, 11), which decomposes the series into cosine waves, and our filter retains only those that have a large magnitude. We chose the number of retained cosine waves to capture the main features of the series but also to avoid overfitting (A.G., G.S., and R.A.C., unpublished results).
Fig. 1 Right describes the output of the detection system for the cough medication sales after the first two layers. In contrast with the raw data (Fig. 1 Left), the preprocessed data are scaled relative to the total sales of all medications, and counts of zero (e.g., on days when the stores were closed) were replaced with interpolated values. The denoised series, which is a result of the third layer, yields a smoother series that is easier to forecast.
The third layer of the system forecasts the next day sales given all of the previous sales. Although the data are now denoised, simple time-series models (e.g., autoregressive moving average models) do not perform well because of the non-stationarity of the series, i.e., the changes in their behavior over time cannot be characterized by simple time-series models. Instead, we use a two-stage prediction method suitable for non-stationary data that can be easily automated and yields more accurate predictions.
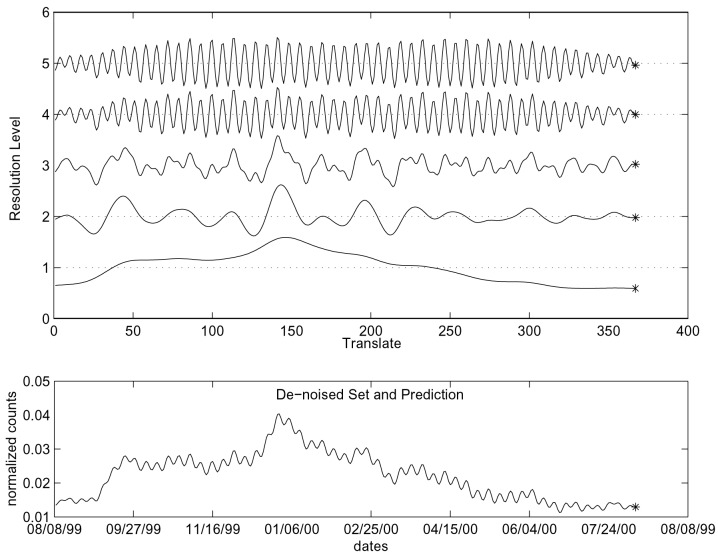
First, we decompose the denoised series into several “resolutions” by using a discrete (redundant) wavelet transform (ref. 12; cf. the continuous version of wavelets in ref. 13). Each resolution describes a different frequency of the series, but, unlike other transforms (e.g., the cosine and Fourier transform), it retains information on the time that each frequency is present. The resulting series for each resolution are more regular, and thus we use a simple autoregressive model (where the sales at time t are taken to be a weighted average of previous sales) for predicting each resolution separately. We then add the predictions to create the forecast of the next day sales. Fig. 2 shows the decomposition of the (preprocessed and denoised) series into five resolutions. For each resolution, we use an autoregressive model for forecasting the next point. Finally, we add the forecasts to obtain the next point in the series, i.e., Fig. 2 also includes the combined forecast of the next day (denoised) sales.
Figure 2.
Third layer: decomposing the series into five resolutions (Upper), predicting the next point for each resolution, and recombining the resolutions to obtain the next day sales forecast (Lower).
The final layer of the detection system includes the computation of an upper threshold for the next day forecasts. This threshold is based on the forecast made in the previous step, plus a margin of error. When the actual next day sales become available, they are compared with the threshold. If they exceed the threshold, the system flags an alarm, indicating that the new daily sales are higher than expected. The threshold is based on the distribution of the differences between the forecasts and the real sales, and is in fact three standard deviations of the differences above the denoised series. This last step is based on a methodology used in statistical quality control, called control charts, where a process is monitored by using a chart that flags when a change occurs, while taking into account natural variation of the series (14). Fig. 3 illustrates the threshold for the cough OTC medication data. The threshold follows the series, creating a “security band,” which, if exceeded, is an indication that the sales are higher than expected. For example, sales for 8/7/00 are higher than the prediction. They do not exceed the threshold, however, and thus we do not take them to indicate an abnormal increase in sales.
Figure 3.
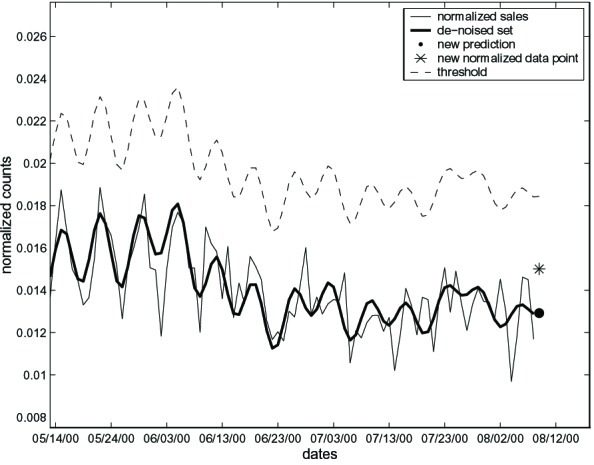
Comparing the sales on 8/7/00 with the threshold. Although sales are higher than the predicted in layer 4, they do not exceed the threshold.
Evaluating the Detection System
To evaluate the usefulness of the detection system, we need to know how well and how fast it detects an anthrax footprint. We can't use traditional measures to evaluate our system because there has not been a large-scale release of inhalational anthrax except for the Sverdlovsk case in 1979. Thus, information on the time course of inhalational anthrax in humans is limited. Thus, we devised a statistical simulation approach.
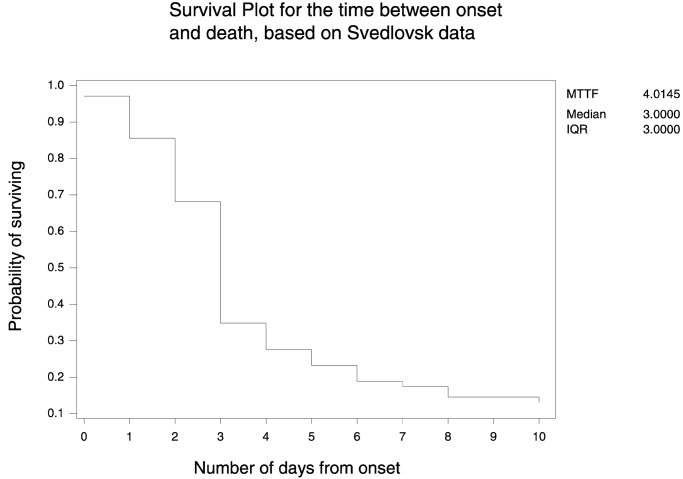
We used data from the Sverdlovsk anthrax outbreak (5) to construct a footprint of anthrax in grocery data. The data document the onset of the disease for 77 people. Given that the anthrax release occurred on April 1, 1979 (5), the onset of symptoms for the first two cases was only on April 4. Fig. 4 gives the survival plot for the 66 (of the 68) people who died and the 11 people who survived.¶ The plot shows the probability of surviving for the number of days since onset. There is a significant drop after 3 days from the onset, where the probability of survival decreases from 0.68 to 0.35 (the median survival time is also 3 days). We assumed that the medication sales for specific anthrax symptoms (e.g., cough and cold medication) will increase steadily over the first 3 days, as more people begin to exhibit symptoms, i.e., a plausible anthrax footprint in OTC medication sales is a three-spike linearly increasing pattern.
Figure 4.
The estimated probability of surviving as a function of the days since onset of symptoms, based on data from Sverdlovsk anthrax outbreak in 1979.
Next, we added the simulated footprint to the daily sales series on each day, and ran the detection system to see whether and when it detected the footprint. By assuming that the simulated footprint is close to a real footprint, adding it directly to the data, and then trying out different variations of the simulated footprint, we can learn about the speed and detection ability of the system. We can also try different configurations of the system and gain information on the types of sales patterns that make detection of an anthrax footprint harder or easier (e.g., it is harder to detect an outbreak when sales are decreasing). To illustrate this simulation approach, we added a footprint of three consecutive spikes that increase linearly (slope 1/3) and where the height of the first spike varies in size. We measured the spike detection ratio (SDR; A.G., G.S., and R.A.C., unpublished results), i.e., the number of footprints detected, divided by the number of footprints added to the dataset. If all of the added footprints are detected, then SDR = 1. Fig. 5 shows the SDR as a function of the height of the footprint (i.e., the amount added to daily sales). The footprint values were scaled so that the largest height corresponds to double the range of the daily counts, and the smallest corresponds to the range × 2−24 (in this case, the scaled range is 0.00476–0.00097, corresponding to the range of the raw counts, 400 − 11 = 389). If the scale of the footprint increases sales by a factor of 1.36 or more, the system detects 100% of the footprints within the first 3 crucial days.
Figure 5.
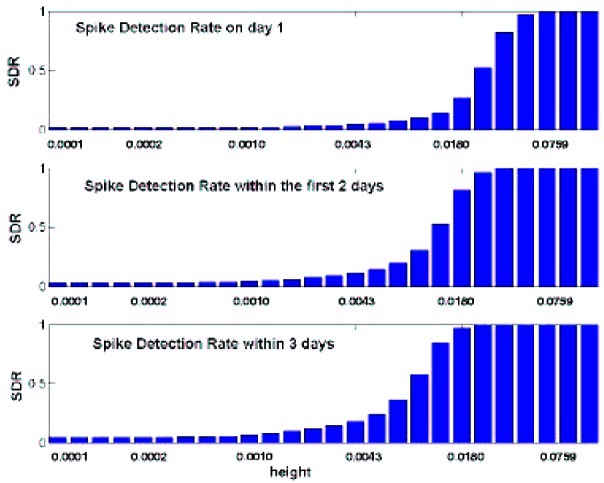
The ratio of detected footprints with slope 1/3 of the total footprints added (SDR) as a function of the height of the footprint, within the first day, first 2 days, and first 3 days.
We also attempted to use these data and tools to detect the onset of the local influenza epidemic during the period in question. The onset turned out to coincide with a holiday and thus was not easily distinguishable from sales patterns. An anthrax footprint that coincided with such a disguised peak in sales might pose difficulties for detection unless the exposure rate was very large.
Concluding Remarks
OTC medication sales are a useful source of data for early detection of bioterrorist attacks. Symptoms of bioagents such as anthrax are similar to those of ordinary diseases such as influenza, and people may self-treat the symptoms before they turn to medical sources. Even then, it is often hard to detect and correctly diagnose the presence of a bioagent, and verifying tests can take several days.
We designed a modular detection system, composed of several layers, where each layer applies a statistical tool to an OTC sales series. The specific choice of tools clearly should depend on the characteristics of the data being used. From experimentation with various OTC medications, we found that different configurations of the system are more efficient for different input series. Because our goal is the early detection of a bioterrorism attack, we prefer a system that can be tuned and tailored to detect a specific disease footprint. We would also expect more sensitive detection from analyses of sales of multiple OTC products with variations in their temporal shifts. False alarms can still occur for various reasons, but the purpose of such systems is early warning and they require careful followup with medical assessment and other information on possible exposure to a bioagent.
Although information on the course of inhalational anthrax for the 11 recent cases (e.g., see ref. 15) should be of value (e.g., see refs. 15 and 16), it may not provide major insights into the detection of a large-scale attack because the bioagent was targeted at individuals and office areas. It is clearly harder to detect a small number of cases in a large city or region, but also easier to detect 500 or even thousands of cases resulting from exposure at a public event, the focus of our system. Closer attention to geographic detail is thus important in the control of excessive false alarms.
The next generation of biosurveillance systems will incorporate information from multiple sources, including public-health and nontraditional data. Such integrated systems may provide early alerts to the public health and medical communities on possible attacks. The output from these systems ultimately needs to be integrated into the clinical evaluation and diagnosis process for a suspected epidemic caused by a bioagent.
Acknowledgments
We thank David Deerfield and the biomedical group from the Pittsburgh Supercomputing Center for the grocery data we used, and Michael Wagner and the biomedical informatics group from the University of Pittsburgh for public health background and information. This research was supported in part by Grant U90/CCU 318753-01 from the Centers for Disease Control and Prevention and Contract 290-00-0009 from the Agency for Healthcare Research and Quality.
Abbreviations
- OTC
over-the-counter
- SDR
spike detection ratio
Footnotes
These data have been extracted from an extremely large database for that period that included all other OTC medication sales and other products.
For cases where onset date was unknown, we subtracted 3 days from the date of death, as in ref. 5.
References
- 1.Wagner M M, Tsui F C, Espino J U, Dato V M, Sittig D F, Caruana R A, McGinnis L F, Deerfield D W, Druzdzel M J, Fridsma D B. J Public Health Manage Pract. 2001;7:51–59. doi: 10.1097/00124784-200107060-00006. [DOI] [PubMed] [Google Scholar]
- 2.Friedlander A M, Pittman P R, Parker G W. J Am Med Assoc. 1999;282:2104–2106. doi: 10.1001/jama.282.22.2104. [DOI] [PubMed] [Google Scholar]
- 3.Inglesby T V, Henderson D A, Bartlett J G, Ascher M S, Eitzen E, Friedlander A M, Hauer J, McDade J, Osterholm M T, O'Toole T, et al. J Am Med Assoc. 1999;281:1735–1963. doi: 10.1001/jama.281.18.1735. [DOI] [PubMed] [Google Scholar]
- 4.Jackson P J, Hugh-Jones M E, Adair D M, Green G, Hill K K, Kuske C R, Grinberg L M, Abramova F F, Keim P. Proc Natl Acad Sci USA. 1998;95:1224–1229. doi: 10.1073/pnas.95.3.1224. [DOI] [PMC free article] [PubMed] [Google Scholar]
- 5.Meselson M, Guillemin J, Hugh-Jones M, Langmuir A, Popova I, Shelokov A, Yampolskaya O. Science. 1994;266:1202–1208. doi: 10.1126/science.7973702. [DOI] [PubMed] [Google Scholar]
- 6.Abramova F A, Grinberg L M, Yampolskaya O V, Walker D H. Proc Natl Acad Sci USA. 1993;90:2291–2294. doi: 10.1073/pnas.90.6.2291. [DOI] [PMC free article] [PubMed] [Google Scholar]
- 7.Brachman P S, Gold H, Plotkin S A, Fekety F R, Werrin M, Ingraham N R. Am J Public Health. 1962;56:632–645. doi: 10.2105/ajph.52.4.632. [DOI] [PMC free article] [PubMed] [Google Scholar]
- 8.Gerberding J L, Hughes J M, Koplan J P. J Am Med Assoc. 2002;287:898–900. [Google Scholar]
- 9.Centers for Disease Control and Prevention. Morbidity and Mortality Weekly Report November 2, 2001. Vol. 50. Atlanta: Centers Dis. Control Prevent.; 2001. pp. 941–948. [Google Scholar]
- 10.Jain A K. Fundamentals of Digital Image Processing. Englewood Cliffs, NJ: Prentice–Hall; 1989. [Google Scholar]
- 11.Pennebaker W B, Mitchell J L. JPEG Still Image Data Compression Standard. New York: Van Nostrand Reinhold; 1993. , Chapter 4. [Google Scholar]
- 12.Nason G P, Silverman B W. In: Wavelets and Statistics: Lecture Notes in Statistics 103. Antoniadis A, Oppenheim G, editors. New York: Springer; 1995. pp. 281–300. [Google Scholar]
- 13.Torrence C, Compo G P. Bull Am Meteorol Soc. 1998;79:61–78. [Google Scholar]
- 14.Montgomery D C. Introduction to Statistical Quality Control. 4th Ed. New York: Wiley; 2001. [Google Scholar]
- 15.Jernigan J A, Stephens D S, Ashford D A, Omenaca C, Topiel M S, Galbraith M, Tapper M, Fisk T L, Zaki S, Popovic T, et al. Emerging Infect Dis. 2001;7:933–944. doi: 10.3201/eid0706.010604. [DOI] [PMC free article] [PubMed] [Google Scholar]
- 16.Mina B, Dym J P, Kuepper F, Tso R, Arrastia C, Kaplounova I, Faraj H, Kwapniewski A, Krol C M, Grosser M, et al. J Am Med Assoc. 2002;287:858–862. doi: 10.1001/jama.287.7.858. [DOI] [PubMed] [Google Scholar]


