

Abstract
Understanding the mechanism and specificity of substrate binding in the cytochrome P450 (P450) superfamily is an important step toward explaining its key role in drug metabolism, toxicity, xenobiotic degradation, and several biosynthetic pathways. Here we investigate the ligand exit pathways and mechanisms of P450cam (CYP101), P450BM-3 (CYP102), and P450eryF (CYP107A1) by using random expulsion molecular dynamics and classical molecular dynamics simulations. Although several different pathways are found for each protein, one pathway is common to all three. The mechanism of ligand exit along this pathway is, however, quite different in the three different proteins. For P450cam, small backbone conformational changes, in combination with aromatic side chain rotation, allow for the passage of the rather rigid, compact, and hydrophobic substrate, camphor. In P450BM-3, larger transient backbone changes are observed on ligand exit. R47, situated at the entrance to the channel, appears important in guiding negatively charged fatty acid substrates in and out of the active site. In P450eryF, an isolated buried arginine, R185, stabilized by four hydrogen bonds to backbone carbonyl oxygen atoms, is located in the exit channel and is identified as having a particularly unusual functionality, dynamically gating channel opening. The results for these three P450s suggest that the channel opening mechanisms are adjusted to the physico-chemical properties of the substrate and can kinetically modulate protein-substrate specificity.
Cytochromes P450 (P450) are heme monooxygenases important in biosynthesis and xenobiotic degradation (1). They are key contributors to drug–drug interaction problems and to variations in individual responses to therapeutic drugs (2). Further, they are targets for exploitation for large-scale biocatalysis (3). About ten P450s have had their crystal structures determined and all of them show the same structural fold despite their diverse origins (bacterial, fungal and mammalian) and their low sequence identity [as low as 10% (4)]. The active site is buried at the center of the P450 fold, and shows variation in size and physico-chemical properties. In some of the P450 crystal structures, the active site is isolated from the protein surface (5–9), whereas in others, one or more channels exist between the active site and the protein exterior (10–13). It is at present unclear whether P450s use similar topological channels and also whether any given P450 uses the same channel for substrate access and product egress. The mechanisms of channel opening and closure when a ligand passes to or from the active site are also unclear. An understanding of these questions would ultimately help to explain how the P450 superfamily achieves such a broad diversity of substrates and such a wide variation in degree of specificity.
Consequently, we have explored the possible access/exit channels and channel opening mechanisms of three P450s that come from different organisms and display very different substrate specificity. We have used both random expulsion molecular dynamics (REMD) (14), and classical molecular dynamics (MD) combined with an essential dynamics analysis (15). REMD accelerates the speed of ligand egress by applying a randomly oriented force to the ligand, whereas classical MD allows a more natural examination of a protein's dynamics. The nature of the random force in REMD requires the probing of ligand exit pathways. In the rest of the manuscript we assume that the exit channel is also the substrate access channel. This is very likely to be the case for many P450s (e.g., refs. 10 and 14), including those studied here, but is not expected to be the case for others (e.g., ref. 13).
Of particular interest is the relation between enzyme specificity and the ligand access/egress mechanism. Results for P450BM-3 and P450cam have been described (14, 16). In the current paper, we report results obtained for P450eryF and compare them to those for P450BM-3 and P450cam. While REMD simulations permitted identification of several possible exit/entrance routes in each enzyme, one route is common to all three proteins studied here. Although this pathway, which we refer to as pathway 2a (pw2a), is shared by all three proteins, the mechanism of ligand entrance/exit is different and apparently adapted to the physico-chemical properties of the substrate. Thus, the physico-chemical and steric characteristics of the P450 active sites may not be the only determinant of substrate specificity; the access channel properties may play a key role, dynamically modulating substrate binding.
Methods
The simulations of P450eryF were based on the crystal structure with the substrate 6-deoxyerythronolide B (DEB) bound (PDB ID code 1oxa) (8). All simulations were carried out using the CHARMm22 force field (17), with a modified version of the ARGOS program (18) and, unless otherwise noted, were performed at 300 K and 1 bar (1 bar = 100 kPa).
The 7 MD and 10 REMD simulations are discussed here. Further details of the simulation protocols are given in the supporting text, which is published as supporting information on the PNAS web site, www.pnas.org, and in Tables 1 and 2.
Table 1.
Summary of MD simulations of P450eryF
| Name | Duration, ps | Brief description |
|---|---|---|
| MD-WILD | 2,000 | Wild-type protein with substrate |
| MD-R185M | 1,440 | R185M mutant with substrate |
| MD-R185M2 | 1,640 | MD-R185M plus 5 ps further equilibration* |
| MD-SOLV | 1,960 | Solvated active site, no substrate |
| MD-ROT | 960 | R185 rotated to be juxtaposed to E173 |
| MD-WILD2 | 1,760 | Na+ ion near E173 was swapped with a water near D396 |
| MD-WILD3 | 1,760 | MD-WILD plus 5 ps further equilibration* |
Atomic velocities were reassigned from a Gaussian distribution (300 K) every 0.2 ps for an additional 5 ps. See supporting information for further details.
Table 2.
Expulsion parameters, routes, and structural changes for the REMD pathways in P450eryF
| Traj # | Pw # | k*, kJ/mol⋅nm | Traj length, ps | Global RMSD†, Å | Max. CαRMSF‡, Å | Res #§ |
|---|---|---|---|---|---|---|
| 1 | 2a | 800 | 590 | 3.2 (3.0) | 2.7 (74) | 35, 37, 59, 72, 73, 177, 292, 391 |
| 2 | 850 | 2.8 (2.7) | 2.6 (74) | 35, 74, 75, 76, 174, 175, 177 | ||
| 3 | 1,190 | 4.4 (4.3) | 4.9 (179) | 72, 73, 86, 174, 176, 177, 185, 292 | ||
| 4 | 510 | 3.1 (2.9) | 2.8 (75) | 37, 73, 74, 75, 78, 83, 86, 174, 292, 391, 392 | ||
| 5 | 700 | 700 | 2.8 (2.6) | 3.1 (77) | 74, 75, 76, 77, 78, 174, 175, 177, 182, 185, 389 | |
| 6 | 2b | 600 | 1,440 | 2.9 (2.7) | 2.4 (72) | 34, 37, 68, 72, 73, 75, 78, 86, 288, 292, 391 |
| 7 | 2e | 800 | 550 | 2.2 (2.1) | 2.1 (76) | 58, 59, 64, 72, 75, 84, 91, 92, 292 |
| 8 | 730 | 2.5 (2.2) | 2.5 (66) | 64, 69, 70, 71, 72, 80, 83, 86, 87, 292 | ||
| 9 | 220 | 2.3 (2.1) | 4.0 (74) | 59, 69, 72, 74, 75, 76, 174, 175 | ||
| 10 | 3 | 700 | 570 | 2.7 (2.7) | 5.7 (193) | 78, 83, 86, 170, 174, 188, 192, 193, 195, 290, 292, 391 |
k is the force constant of the random expulsion force acting on the center of mass of the ligand. The other parameters defining this expulsion force were constant for all trajectories (rmin = 0.03 Å, N = 300).
The maximum global rms deviation of nonhydrogen atoms from their crystal structure positions and (in parentheses) from their positions in the initial structure of the trajectory.
The number of the residue with the highest Cα RMSF is given in brackets.
Residues lining the expulsion trajectories are calculated as described in ref. 14, table 3. The five residues with the highest RMSF (averaged over the whole REMD trajectory) are given in bold type.
Results and Discussion
Pathways of Ligand Egress from the Active Sites.
The exit trajectories determined by REMD were clustered into pathways defined by the secondary structure elements lining them. Representative trajectories for each pathway found in the 3 P450s are shown in Fig. 1 (and in stereo in Fig. 7, which is published as supporting information on the PNAS web site) and the main features of these trajectories are summarized in Table 5, which is published as supporting information on the PNAS web site. The pathway nomenclature has been described previously along with details of the results of the P450cam and P450BM-3 simulations (14). Details of all P450eryF trajectories are given in Table 2.
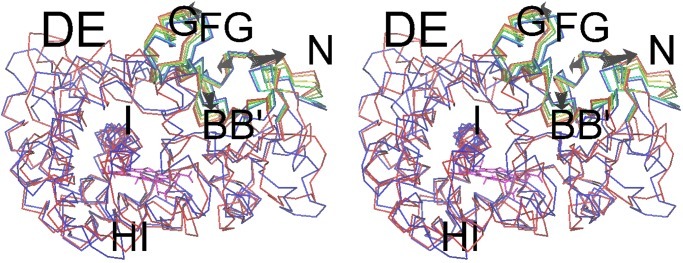
Figure 1.

Location of the REMD ligand exit pathways in P450cam (1, 2a, 2b, 2c, 3), P450BM-3 (2a, 2d), and P450eryF (2a, 2b, 2e, 3). The protein backbone is represented by a ribbon, the heme by ball and stick, and the ligand by CPK spheres. The protein is viewed along the I-helix and this view is retained for all figures. The F- and G-helices and joining loop are shown in blue (the G-helix is the helix closest to the viewer), the B/B′ loop and B′ helix in yellow, and the β1-sheet in pink. For each pathway, the trajectory of the center of mass of the ligand during a representative REMD simulation is shown by a colored tube. The common pathway in all three structures (pw2a) is colored red. A stereo representation of this figure is provided in the supporting information (Fig. 7).
There is one pathway, pw2a, that is common to all three proteins. This is located between the F/G loop (secondary structure is labeled as in ref. 4), the β1 sheet, and either the B′ helix (P450cam, P450BM-3) or the B/B′ loop (P450eryF). (In P450eryF, the B′ helix is oriented perpendicular to the heme plane and the B/B′ loop, instead of the B′ helix, makes contact with the substrate. This allows a much larger active site.) For P450cam and P450BM-3, steered MD, REMD, and adiabatic mapping suggest that this pathway is the most probable for the substrate (19). In P450eryF, it also seems that it is the most likely pathway because it is the most frequently observed REMD exit pathway (the trajectories are distributed 5:1:3:1 for pw2a:pw2b:pw2e:pw3, respectively) and it is also the only pathway seen to begin opening during MD simulations (see below). This paper thus proceeds with an analysis of pw2a in P450eryF, followed by a comparison of this with pw2a in P450cam and P450BM-3.
Features of P450eryF Ligand Egress.
The interaction between the extremely long B/B′ loop (26 residues compared with other P450s, which have about 10 residues) and a buried arginine, R185 on the G helix, (Figs. 1, 2c, and 3) appears to be key to the P450eryF ligand egress mechanism. The buried R185 is stabilized in the crystal structure by hydrogen bonds to four backbone carbonyl atoms of residues A74 and L76 on the B/B′ loop and I174 and V176 on the F/G loop. It sits in an otherwise unfavorable hydrophobic environment in the access channel. Less than 1% of the side chain of R185 is solvent accessible according to computations with the NACCESS program, using default parameters (20). Its four coordinating carbonyl oxygens are also completely solvent inaccessible and the residues to which they belong are mostly buried, with side-chain solvent accessibilities of 8–34% (see Table 6, which is published as supporting information on the PNAS web site).
Figure 2.

Substrate exit mechanisms along pw2a. The crystal structure and a snapshot taken after ligand exit in a REMD simulation are shown for (a) P450cam, (b) P450BM-3, and (c) P450eryF. The ligand exit channel in all three proteins is situated in the same region of the protein, but each protein has an exit mechanism that is appropriate to the physicochemical properties of its natural substrate, as described in the main text. The color scheme is the same as for Fig. 1, except that the ligand is colored by atom type. In P450cam, the H-bonds of the salt-link tetrad formed by residues D251, K178, R186, and D182, and the salt link between D97 and K197, are shown by dashed lines. During REMD, comparatively small changes in the backbone conformation are observed together with a change in the side-chain torsions of F87 and F193. The salt links are transiently perturbed, with χ1 of D251 changing by 180°, but after expulsion all H-bonds of the salt tetrad are reformed. Throughout the course of the P450BM-3 simulation, palmitoleic acid (PAM) forms a salt link with R47 on the β1-sheet (26). Further details of P450cam and P450BM-3 mechanisms are given in the text and elsewhere (14, 19). In P450eryF, the buried R185, stabilized by four hydrogen bonds (dashed lines) with residues I174 and V176 on the F/G loop, and L76 and A74 on the B/B′ loop, assists in keeping the exit channel closed (also see Fig. 3). The four hydrogen bonds to R185 are broken during ligand expulsion as R185 rotates to point outwards and the F/G and B/B′ loops undergo a conformational rearrangement. These snapshots were taken from traj#5 (see Table 2), which is the same trajectory used for the analysis in Fig. 8, which is published as supporting information on the PNAS web site.
Figure 3.

The hydrogen bonding interactions of R185 and the potential positions of the R185 guanidinium group as found by using the rotamer search module (dgrota) of the whatif software (27). The dashed black lines represent the hydrogen-bond interactions to R185, as found in the crystal structure 1oxa. The residue positions found in 1oxa are colored by atom type, with the residues involved in the R185 crystal hydrogen bonds represented by thicker sticks. The monochrome side chains are a summary of the 79 matches obtained by searching PDB crystal structures for pentapeptide subsequences with a central R and a similar backbone conformation to that around R185. The guanidinium positions of these hits were manually assigned to one of four clusters. The side chain shown in red (PDB ID code 1B4V, residue R28) represents a cluster of four guanidinium groups that fit approximately into a pocket between the F- and G-helices and interact with E173; this is the rotamer used for the MD-ROT simulations. The dark blue (1A6G:R31) side chain represents a cluster consisting of 9 guanidinium groups. The magenta (2ERL:R25) and yellow (1LKK:R139) side chains are representative of the largest cluster, consisting of 51 guanidinium groups. This latter cluster points toward the external solvent, and thus suggests that, on probability, the native R185 is more likely to rotate into the solvent than deeper into the protein environment.
A dynamic interchange of hydrogen bonds between R185 on the F/G loop and the backbone carbonyl atoms on the B/B′ loop seems to be central to ligand egress (Table 3). This hydrogen bond interchange allows increased motion of the B/B′ loop, as compared with the crystal structure (Fig. 4), and also a change in the rotamer of R185 (Table 3, Fig. 2c). The ligand leaves the active site either by passing “through” R185, interacting with it as it changes rotamer, or via the extra freedom generated in the B/B′ loop (Table 2 and Fig. 8, which is published as supporting information on the PNAS web site).
Table 3.
Dynamic features of R185 observed in the REMD trajectories of P450eryF
| Traj #* | R185
χ†
|
Residues H-bonding to
R185‡
|
||||||||||||
|---|---|---|---|---|---|---|---|---|---|---|---|---|---|---|
| χ1 | χ2 | χ3 | 74 | 75 | 76 | 77 | 173 | 174 | 175 | 176 | 177 | 178 | 182 | |
| Crystal | t | t | t | X | X | X | X | |||||||
| 1 | t | t | t | b | F | b | f | f | b | B | ||||
| 2 | g− | t | t | B | b | f | B | B | f | f | f | |||
| 3 | t | t | g+ | B | f | b | f | b | f | B | ||||
| 4 | g+ | t | g+ | B | X | F | B | B | f | f | F | |||
| 5 | g+ | t | g+ | B | F | b | F | f | B | B | f | f | F | |
Trajectories are numbered as in Table 2.
The dihedral angles of the R185 sidechain are defined as in ref. 28, and for the REMD trajectories are those found immediately after the expulsion event. With the exception of traj #1, the conformation of R185 in all REMD trajectories is more solvent exposed after ligand exit.
H-bond formation to R185 during the simulations is represented as: X, crystallographic; b, crystallographic H-bond breaks and reforms several times during the simulation; B, crystallographic H-bond is broken for most of the simulation; f, noncrystal H-bond transiently forms and breaks several times during the simulation; F, noncrystal H-bond forms for an extended period of simulation.
Figure 4.

Comparison of the dynamics [residue-wise root mean square fluctuation (RMSF)] of P450eryF for the crystal structure (red) and MD simulations of the wild-type protein (black) and the R185M mutant (blue). The green lines on the x axis indicate residues A74, L76, I174, V176, and R185. The locations of the peaks in RMSF of the residues in the channel region are similar in all three curves. The four hydrogen bonds to R185 locally reduce the RMSFs in all three curves but the effect is clearly the smallest for the R185M mutant. After partial breaking or rearrangement of these H-bonds, considerable conformational freedom is expected in the B/B′ and F/G loop regions, thus allowing channel opening. In the R185M simulation the N-terminal residues also show greater flexibility, which is required for channel opening.
The hydrogen bond interchange process is seen in both REMD and MD simulations. Simulation MD-SOLV (see Table 1), in which the active site lacks substrate but is solvated, shows that the hydrophobic environment of R185 restricts its solvent access and thus provides its four hydrogen bonds with kinetic stability. F78, L76, I174, L175, and M177 form a hydrophobic cage around R185, and mutation of these to hydrophilic residues (particularly L76 and M177, which are the barrier to bulk solvent) is likely to affect enzyme functionality. In MD-SOLV, solvent molecules do eventually penetrate the R185-B/B′ interaction and one passes into the active site. This causes a change of the R185-B/B′ hydrogen bonding pairs (Fig. 5), and results in R185 becoming more exposed to external solvent and less exposed to internal solvent. In REMD simulations, there is also initial stability in the R185-B/B′ interactions, but this is disrupted by the two mechanisms described in the next two paragraphs.
Figure 5.

Interchange of hydrogen bonds to R185 in P450eryf, as observed during simulation MD-SOLV. The hydrophobic environment around R185 restricts its solvent interactions for over 1 ns. However solvent interactions with R185 do become more frequent, and eventually lead to an external water molecule penetrating through to the active site. During this penetration process there is breakage/rearrangement of the hydrogen bond interactions of R185. This process can be seen in the figure to occur between 1.1 and 1.3 ns. The overall change of structure by the end of the simulation is one where R185 has moved slightly toward the bulk solvent, has a greater interaction with the bulk solvent through NH1, and has slightly weaker hydrogen bonding to the B/B′ loop. This is similar to the sorts of changes seen in REMD and may indicate how channel opening could start in the unliganded protein (Fig. 8 contains a similar plot for a REMD trajectory).
Collisions between the substrate and residues around R185 (notably A74 and Y75) lead eventually to backbone changes in the B/B′ loop, flipping carbonyl groups and thus catalyzing the hydrogen bond exchange process (see details in Fig. 8). Interestingly, in a recent crystal structure (21) of P450eryF with ketoconazole (an inhibitor with three linearly connected heterocycles and two benzene rings), the side chain of F72 is rotated (as compared with the structure with DEB) and this change propagates to residues of the B/B′ loop, causing a backbone shift of 2.1 Å.
Direct interaction between the polar atoms of the substrate (DEB) and R185 also provides a mechanism for disrupting the hydrogen bonding pattern around R185 (Fig. 8). DEB's amphipathic nature means that it can interact with the hydrophobic side chains of the exit channel, and the polar R185 and its coordinating backbone carbonyl atoms. Thus, DEB can access R185 and promote hydrogen bond interchange, and thus disrupt R185's local stability.
Another consideration with regard to channel opening is the natural tendency of pw2a to open, as seen in the long time-scale dynamics of simulations MD-WILD, MD-WILD2, and MD-WILD3 for P450eryF in the presence of DEB. The first essential dynamics eigenvector shows the F/G loop and the β1 sheet moving in an anticorrelated way, but the B/B′ and F/G loops moving in a correlated way. Further, in the absence of R185, the channel appears to open more readily. In the simulation MD-R185M (R185 was replaced with methionine, a hydrophobic residue of similar size), hydrophobic interactions initially hold pw2a closed. However, in the later stages the channel opens far wider than in any of the simulations of the wild-type protein (see Figs. 4 and 6). [The R185:Cα (G helix) to G77:Cα (B′ helix) distance is 10 Å, compared with 6–7 Å for the later stages of the wild-type simulations; the L76:Cα (B′ helix) to E8:Cα (N-terminal strand) distance is 18 Å, compared with ≈15 Å at the end of the wild-type simulations.] A similar effect is seen in the simulation MD-ROT, where the R185-B/B′ loop hydrogen bonds were broken before the simulation by rotating the R185 side chain to interact with E173 (see Fig. 3 and the description at end of Simulation Protocols in the supporting information). In MD-R185M, the first essential dynamics eigenvector shows the F/G loop moving anticorrelated to both the β1 sheet and the B/B′ loop. Opening of pw2a is also correlated to motion of the flexible N terminus of the F-helix, which may act as some sort of hinge for F/G loop motion. Indeed, the F-helix shows unwinding toward the end of this simulation, and this is not unreasonable considering that calculations based on helix–coil transition theory (22) show that the F-helix of P450eryF has low intrinsic helicity (as does the F-helix in P450cam, but not the F-helix in P450BM-3).
Figure 6.
The motion in simulation MD-R185M of the R185M mutant protein in the presence of substrate is shown along the first eigenvector obtained from essential dynamics analysis. The seven snapshots, at equidistant times along the trajectory, are color coded from blue (start of simulation) to red (end of simulation), and the arrows also indicate the direction of change with time. Secondary structure elements are labeled with single letters for α-helices and double letters for helix to helix loops. In addition to the elements shown to move around pw2a, there is also a similar magnitude of motion at the C terminus, the D/E and E/F loops, and the F-helix (particularly its N terminus).
All of the above simulations suggest that the channel has a tendency to open, as part of the protein's natural breathing motion, but that R185 damps this motion. This damping motion, caused by the tethering action of R185, is confirmed by the crystallographic B factors (Fig. 4). R185, its four hydrogen bonding partners (A74, L76, I174, and V176), and their immediate primary sequence neighbors are all considerably less mobile than other nearby residues. It thus appears that the behavior of R185 is important for the gating of P450eryF.
Do Any Other Proteins Have a Similar Functional Arginine?
Buried arginines are not unusual (23, 24); however, stabilization of buried arginines by backbone carbonyl hydrogen-bonding interactions alone is unusual. In a detailed search of 19 protein structures containing 209 arginine residues, Borders et al. (23) found four such “structural” arginines. Using data kindly provided by Gunner from a study of charged residues in 305 proteins (24), we could only find the same four examples. The buried arginines in these examples are primarily structural, although they may assist functionality via electrostatic steering (see refs. 23 and 25 and references therein). The buried, isolated R185 of P450eryF, on the other hand, is particularly remarkable because it appears to have a dynamic, gating role on ligand passage.
We have also searched specifically for P450 sequences with an arginine analogous to that in P450eryF (further details can be found in the supporting information). Of the few examples we found, there is not enough additional information to imply analogous function. Indeed, for CYP51, for which a crystal structure exists, R194 aligns with R185 of P450eryF but it has a packing environment that suggests it does not have analogous function. At this time we must thus conclude that R185 in P450eryF is unique.
Comparison of the Mechanisms of P450cam, P450BM-3, and P450eryF.
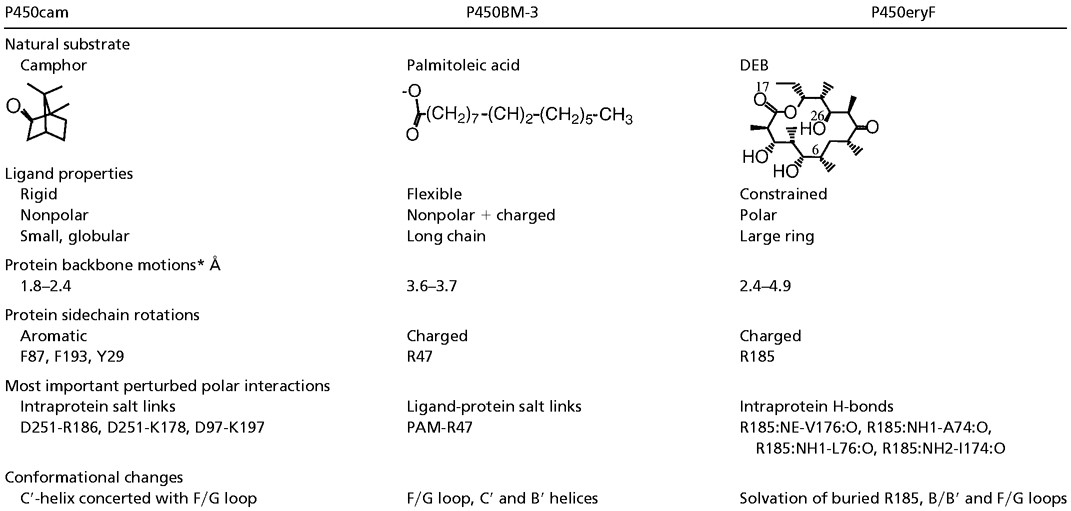
The mechanisms of ligand exit along pw2a for P450cam, P450BM-3, and P450eryF are very different, as can be seen in Fig. 2 and Table 4. In P450cam, a natural breathing mode of the enzyme results in an opening of the channel, although this is somewhat restricted by salt link tethering. A restricted opening of this hydrophobic channel is ideal for selecting small, rigid, hydrophobic ligands like camphor. An induced-fit mechanism also appears to be important, because collisions with camphor cause the aromatic side chains to flip outwards. Such a mechanism requires only modest backbone changes [Cα RMSF of 1.8–2.4 Å (see Table 4)].
Table 4.
Comparison of the characteristics of the common ligand egress pathway (pw2a) in P450cam, P450BM-3, and P450eryF
 |
Max. Cα RMSF observed for a residue during the last 10–20 ps of ligand expulsion.
In P450BM-3, the fatty acid substrate is tethered via a salt link to R47. The enzyme appears to take advantage of the flexibility of the substrate, requiring the fatty chain to transiently fold into a “U” shape as it enters/exits the hydrophobic active site. REMD simulations show larger backbone deviations [Cα RMSF of 3.6–3.7 Å (see Table 4)], but these are in accord with experimental data (14).
P450eryF utilizes both a natural breathing motion and an induced fit mechanism to allow substrate passage along pw2a. Most important in this induced fit is the ability of the amphipathic ligand to penetrate a hydrophobic environment and interfere with the hydrogen bond interactions of R185. Other effects that interfere with R185-B/B′ hydrogen bonding are ligand collision with, in particular, B/B′ loop residues, and the rare penetration of water through the channel. This interplay of events is what finally gives the large substrate enough space to leave.
In summary, despite having the same overall fold, and a topologically identical access channel, the three P450s studied here utilize very different mechanisms for substrate passage. Varying degrees of backbone distortion are accompanied by distinct side-chain rearrangements: aromatic ring flips in P450cam, rotation of a guiding arginine that makes a salt link to the ligand in P450BM-3, and rotation of an arginine that makes intraprotein hydrogen-bond interactions in P450eryF. This P450eryF arginine is unusual in being buried and isolated from other charged residues in the crystal structure. Rather than influencing protein function or stability by fixed electrostatic interactions, it affects the function of the protein by its dynamic gating ability, which is achieved by exchanging backbone carbonyl hydrogen-bond interactions, rotating its side-chain, and altering the dynamics of the protein, particularly of the long, flexible B/B′ loop. Although apparently rare in known protein structures, such a mechanism involving a buried arginine could be used for modulating protein dynamics and gating in other proteins.
Supplementary Material
Acknowledgments
We thank T. P. Straatsma for supplying the argos program and valuable discussions on its application, G. Vriend for the whatif program and help with technical problems, and M. Gunner for supplying statistics on charged residues in proteins. We thank Timm Essigke for critical reading of this manuscript. S.K.L. was the recipient of an Erwin-Schrödinger fellowship from the Austrian Science Fund (JO1379-CHE) and a Marie-Curie Fellowship from the European Union (BIO4-CT97-5036) for part of the duration of this work. P.J.W. was supported for part of the period of this research by National Institutes of Health (U.S. Public Health Service) Grant GM59467. Financial support from the Klaus Tschira Foundation is gratefully acknowledged.
Abbreviations
- P450
cytochrome P450
- pw
pathway
- REMD
random expulsion molecular dynamics
- MD
molecular dynamics
- RMSF
root mean squared fluctuation
- DEB
6-deoxyerythronolide B
Footnotes
This paper was submitted directly (Track II) to the PNAS office.
References
- 1.Graham-Lorence S, Peterson J A. FASEB J. 1996;10:206–214. doi: 10.1096/fasebj.10.2.8641554. [DOI] [PubMed] [Google Scholar]
- 2.Cupp M J, Tracy T S. Am Fam Physician. 1998;57:107–116. [PubMed] [Google Scholar]
- 3.Wong L L. Curr Opin Chem Biol. 1998;2:263–268. doi: 10.1016/s1367-5931(98)80068-9. [DOI] [PubMed] [Google Scholar]
- 4.Hasemann C A, Kurumbail R G, Boddupalli S S, Peterson J A, Deisenhofer K. Structure. 1995;2:41–62. doi: 10.1016/s0969-2126(01)00134-4. [DOI] [PubMed] [Google Scholar]
- 5.Poulos T, Finzel B C, Howard A J. Biochemistry. 1986;25:5314–5322. doi: 10.1021/bi00366a049. [DOI] [PubMed] [Google Scholar]
- 6.Poulos T, Finzel B C, Howard A J. J Mol Biol. 1987;195:687–700. doi: 10.1016/0022-2836(87)90190-2. [DOI] [PubMed] [Google Scholar]
- 7.Hasemann C A, Ravichandran K G, Peterson J A, Deisenhofer J. J Mol Biol. 1994;236:1169–1185. doi: 10.1016/0022-2836(94)90019-1. [DOI] [PubMed] [Google Scholar]
- 8.Cupp-Vickery J R, Poulos T L. Nat Struct Biol. 1995;2:144–153. doi: 10.1038/nsb0295-144. [DOI] [PubMed] [Google Scholar]
- 9.Yano J K, Koo L S, Schuller D J, Li H, Ortiz de Montellano P R, Poulos T L. J Biol Chem. 2000;275:31086–31092. doi: 10.1074/jbc.M004281200. [DOI] [PubMed] [Google Scholar]
- 10.Ravichandran K G, Boddupalli S S, Hasemann C H, Peterson J A, Deisenhofer J. Science. 1993;261:731–736. doi: 10.1126/science.8342039. [DOI] [PubMed] [Google Scholar]
- 11.Park S-Y, Shimizu H, Adachi S, Nagakawa A, Tanaka I, Nakahara K, Shoun H, Obayashi E, Nakamura H, Iizuka T, Shiro Y. Nat Struct Biol. 1997;4:827–832. doi: 10.1038/nsb1097-827. [DOI] [PubMed] [Google Scholar]
- 12.Williams P A, Cosme J, Sridhar V, Johnson E F, McRee D E. Mol Cell. 2000;5:121–131. doi: 10.1016/s1097-2765(00)80408-6. [DOI] [PubMed] [Google Scholar]
- 13.Podust L M, Poulos T L, Waterman M R. Proc Natl Acad Sci USA. 2001;98:3068–3073. doi: 10.1073/pnas.061562898. [DOI] [PMC free article] [PubMed] [Google Scholar]
- 14.Lüdemann S K, Lounnas V, Wade R C. J Mol Biol. 2000;303:797–811. doi: 10.1006/jmbi.2000.4154. [DOI] [PubMed] [Google Scholar]
- 15.Amadei A, Linssen A B M, Berendsen H J C. Proteins. 1993;17:412–425. doi: 10.1002/prot.340170408. [DOI] [PubMed] [Google Scholar]
- 16.Lüdemann S, K, Gabdoulline R R, Lounnas V, Wade R C. Internet J. Chem. 2001. http://www.ijc.com/articles/ , http://www.ijc.com/articles/ 2001v4/6/. 2001v4/6/. [Google Scholar]
- 17.Brooks B R, Bruccoleri R E, Olafson B D, States D J, Swaminathan S, Karplus M. J Comp Chem. 1983;4:187–217. [Google Scholar]
- 18.Straatsma T P, McCammon J A. J Comp Chem. 1990;11:943–951. [Google Scholar]
- 19.Lüdemann S K, Lounnas V, Wade R C. J Mol Biol. 2000;303:813–830. doi: 10.1006/jmbi.2000.4155. [DOI] [PubMed] [Google Scholar]
- 20.Hubbard S, Thornton J. naccess (Department of Biochemistry and Molecular Biology, University College, London) 1993. [Google Scholar]
- 21.Cupp-Vickery J R, Garcia C, Hofacre A, McGee-Estrada K. J Mol Biol. 2001;311:101–110. doi: 10.1006/jmbi.2001.4803. [DOI] [PubMed] [Google Scholar]
- 22.Munoz V, Serrano L. Nat Struct Biol. 1994;1:399–409. doi: 10.1038/nsb0694-399. [DOI] [PubMed] [Google Scholar]
- 23.Borders C J, Broadwater J A, Bekeny P A, Salmon J E, Lee A, Elridge A M, Pett V B. Protein Sci. 1994;3:541–548. doi: 10.1002/pro.5560030402. [DOI] [PMC free article] [PubMed] [Google Scholar]
- 24.Gunner M, Saleh M A, Cross E, ud Doula A, Wise M. Biophys J. 2000;78:1126–1144. doi: 10.1016/S0006-3495(00)76671-9. [DOI] [PMC free article] [PubMed] [Google Scholar]
- 25.Wade R C, Gabdoulline R R, Lüdemann S K, Lounnas V. Proc Natl Acad Sci USA. 1998;95:5942–5949. doi: 10.1073/pnas.95.11.5942. [DOI] [PMC free article] [PubMed] [Google Scholar]
- 26.Noble M, Miles C, Chapman S, Lysek D, MacKay A, Reid G, Hanzlik R, Munro A. Biochem J. 1999;339:371–379. [PMC free article] [PubMed] [Google Scholar]
- 27.Vriend G. J Mol Graphics. 1990;8:52–56. doi: 10.1016/0263-7855(90)80070-v. [DOI] [PubMed] [Google Scholar]
- 28.Janin J, Wodak S. J Mol Biol. 1978;124:357–386. doi: 10.1016/0022-2836(78)90408-4. [DOI] [PubMed] [Google Scholar]
Associated Data
This section collects any data citations, data availability statements, or supplementary materials included in this article.