

ABSTRACT
Olfactory Ensheathing Cells (OECs) are glial cells originating from the neural crest and are critical for bundling olfactory axons to the brain. Their development is crucial for the migration of Gonadotropin‐Releasing Hormone‐1 (GnRH‐1) neurons, which are essential for puberty and fertility. OECs have garnered interest as potential therapeutic targets for central nervous system lesions, although their development is not fully understood. Our single‐cell RNA sequencing of mouse embryonic nasal tissues suggests that OECs and Schwann cells share a common origin from Schwann cell precursors yet exhibit significant genetic differences. The transcription factors Yap and Taz have previously been shown to play a crucial role in Schwann cell development. We used Sox10‐Cre mice to conditionally ablate Yap and Taz in the migrating neural crest and its derivatives. Our analyses showed reduced Sox10+ glial cells along nerves in the nasal region, altered gene expression in Schwann cells (SCs), melanocytes, and OECs, and a significant reduction in olfactory sensory neurons and vascularization in the vomeronasal organ. However, despite these changes, GnRH‐1 neuronal migration remained unaffected. Our findings highlight the importance of the Hippo pathway in OEC development and how changes in cranial neural crest derivatives indirectly impact the development of olfactory epithelia.
Keywords: gonadotropin‐releasing hormone‐1 (GnRH‐1) neurons, olfactory ensheathing cells, olfactory sensory neurons, Schwann cell precursors, vomeronasal organ, Wnt1Cre2 Sox10Cre, yap and Taz
Main Points
OECs, SCs, and Mel derive from SCPs. Sox10Cre;YapHet;TazKO mice show impaired SC maturation, reduced Mel formation, fewer SCPs, OECs, and olfactory neurons, but normal GnRH‐1 neuron migration.

1. Introduction
The nasal area of mammals comprises cartilage, bone, mesenchyme, and glia of neural crest origin and various sensory and endocrine neurons of placodal origin. Olfactory Ensheathing Cells (OECs), also known as the olfactory Schwann cells or nasal glia, interact with the neurons of the olfactory system (Chuah and Au 1991). The OECs are crucial in guiding olfactory neuron development and facilitating axonal bundling (Pingault et al. 2013; Zhou et al. 2017). For several decades, it was believed that the olfactory placode, which gives rise to pioneer olfactory neurons, terminal nerve neurons, olfactory neurons, vomeronasal neurons, sustentacular cells, Gonadotropin‐Releasing Hormone 1 (GnRH‐1) neurons (Amato et al. 2024; Barraud et al. 2010; Wray et al. 1989)—could give rise to OECs cells (Couly and Le Douarin 1985). However, studies in chickens, fish, and mice indicate that the glia of the olfactory system derive from Neural Crest Cells (NCCs) (Aguillon et al. 2018; Barraud et al. 2010; Forni et al. 2011; Saxena et al. 2013). NCCs are multipotent precursor cells that form at the dorsal‐most portion of the closing neural tube during embryonic development. NCCs subsequently migrate throughout the embryo, differentiating into diverse cell types, including bones and cartilages, melanocytes, sensory neurons, autonomic and enteric neurons, and all subtypes of peripheral glia known as Schwann cells (SCs) (Erickson et al. 2023; Munoz and Trainor 2015). SCs originate from Schwann cell precursors (SCPs), a transient cell population that shares a multipotent “hub” state with the migratory NCCs (Kastriti et al. 2022; Stierli and Sommer 2022). SCs of the peripheral nervous system include myelinating cells as well as a variety of non‐myelinating SCs, including the Remak SCs, enteric glia, and terminal SCs, which localize to the neuromuscular junction. OECs share several molecular features with the non‐myelinating SCs (Barber and Lindsay 1982; Doucette 1984; Franklin and Barnett 2000). Yet, despite SCs and OECs having overlapping molecular features, the two cell types have been proposed to form distinct progenitors (Perera et al. 2020). In addition, a recent study suggested that the OECs might originate from precursors of the mesenchyme (Perera et al. 2020) and bioinformatic data indicate that the mesenchyme and glial cells may have alternative programs (Erickson et al. 2023), leaving the developmental trajectories of the OECs an open‐ended question.
Sox10 is a transcription factor belonging to the Sox family and contains the HMG‐box, which is indispensable for the proper development of various cell types derived from the neural crest (Aoki et al. 2003; Britsch et al. 2001; Honore et al. 2003). Disruptions in OEC development after Sox10 loss‐of‐function cause olfactory and terminal nerve defects that disrupt the migration of the GnRH‐1 neurons from the nasal area to the brain in humans and mice (Barraud et al. 2013; Pingault et al. 2013; Taroc, Naik, et al. 2020; Zhou et al. 2017); these have been proposed as underlying conditions for Kallmann syndrome. In addition, haploinsufficiency of the Sox10 gene in humans is associated with type IV Waardenburg syndrome (Pingault et al. 1998). This condition is characterized by several features, including sensorineural hearing loss, hair pigment abnormalities, lateral displacement of the eyes (known as dystopia canthorum), deafness, the absence of OECs, impaired sense of smell (anosmia), and hypogonadotropic hypogonadism. The latter condition results from the defective migration of GnRH‐1 neurons (Barraud et al. 2013; Pingault et al. 2013). Despite their pivotal role in the development and function of olfactory and GnRH‐1 systems, the cell biology and developmental trajectories of the OECs have been largely overlooked.
YAP (encoded by Yap1, shorten to Yap) and TAZ (encoded by Wwtr1, shorten to Taz) are transcriptional co‐regulators of the Hippo pathway, which controls multicellular development by integrating chemical and mechanical signals (Cobbaut et al. 2020; Hillmer and Link 2019; Jafarinia et al. 2024; Manning et al. 2020; Rogg et al. 2023; Rognoni and Walko 2019). When the Hippo pathway is inactive, Yap and Taz can translocate into the nucleus and regulate gene transcription. Previous studies revealed that Yap and Taz are required for SC development, myelination, and peripheral nerve repair (Deng et al. 2017; Grove et al. 2017; Grove et al. 2020; Hong et al. 2024; Jeanette et al. 2021; Poitelon et al. 2016). Moreover, Wnt1‐Cre‐driven conditional manipulation of Yap and Taz in presumptive pre‐mandatory NCCs suggests significant roles for these factors in cranial NCC proliferation, survival, cellular differentiation (Wang et al. 2016), and melanocyte gene expression (Manderfield et al. 2015).
In this article, we present our findings using single‐cell RNA sequencing of developing mouse noses at E14.5. Our study suggests that during embryonic development, the OECs and SCs in the peripheral nervous system share similar developmental trajectories, as both cell types appear to originate from SCPs in the nasal area. Additionally, we found strong expression of Yap and Taz in developing OECs. Sox10‐Cre conditional ablation of Yap and Taz (Yap cHet;Taz cKO) in neural crest cells determined defective gene expression in the nasal mesenchyme, melanocyte, defective SCs, and abnormal OEC development. In Yap cHet;Taz cKO mutants, we found a reduction in olfactory and vomeronasal organ neurons, defective vascularization of the disorganization of the olfactory/vomeronasal axon bundles, but, surprisingly no significant impact on GnRH‐1 neuronal migration.
2. Results
2.1. Single‐Cell RNA Sequencing of E14.5 Mouse Nose Identifies Developing OECs
To get a full scope of the populations within the developing nose, we dissociated and performed single‐cell RNA sequencing of whole mouse noses from embryonic day (E) 14.5 mouse embryos. Unsupervised clustering using the ‘R’ package Seurat allowed us to identify distinct cell types based on the expression of defining markers (Figure 1A,C). In the developing olfactory epithelia, we categorized Pax6‐, Ascl1‐, and Tubb3‐positive cells as the developing neuronal population (Cau et al. 1997; Kim et al. 2007; Roskams et al. 1998) (Figure 1A,B,D), while Foxa1‐positive cells as non‐sensory/respiratory‐epithelium (Forni et al. 2013; Taroc, Katreddi, and Forni 2020) (Figure 1A,C,D). Col1a1/Alx1‐positive cells were identified as mesenchyme, cartilage, and or bone, with a subset of cells within the cluster also expressing Sox10 (Figure 1A–D). Pecam1‐positive cells were labeled as vasculature (Muller et al. 1989). Immune cells were labeled based on C1qa (Kishore et al. 2016), Acta2 for fibroblasts (Hinz et al. 2001), and Actg2 for muscle cells (Halim et al. 2015). Notably, among the different cell clusters, we identified putative SCPs derivatives/glial cells based on Fabp7 and Sox10 enrichment (Barraud et al. 2010; Forni et al. 2011) (Figure 1A,D). As mentioned earlier, Sox10 mRNA was expressed in the developing nasal cartilage and sparse non‐neuronal cells in the developing olfactory epithelium; these are presumptive developing Bowman gland cells (Perera et al. 2020) (Figure 1A–D).
FIGURE 1.

Single‐cell sequencing of the noses of E14.5 C57BL/6 embryos. (A) UMAP displaying cell clusters. The color code for the presumptive cell types is indicated in the legend. Some of the top genes for each cell type are shown on the UMAP. (B) Feature plot for Sox10 expression on the same UMAP as in (A). Sox10 is enriched in the cluster of presumptive Schwann Cell Precursor (SPC) derivatives/glia (red arrow). (C) Heatmap illustrating differentially expressed genes across clusters. (D) In situ hybridization showing the expression of Col2a1 in the nasal mesenchyme (Mes) and cartilage (Crtl); foxa1 in the respiratory epithelium; Ascl1, and Tubb3 in the developing olfactory epithelium (OE) and vomeronasal organ (VNO); Fabp7 and Sox10 in the presumptive olfactory ensheathing cells. (OECs) along the neurons emerging from OE and VNO and surrounding the olfactory bulb (OB). Sox10 is also visible in the nasal cartilage (Crtl). In situ hybridization images were sourced from the GenePaint database (https://gp3.mpg.de).
2.2. Subclustering the Schwann Cell Precursors and Their Derivatives Suggests a Common Origin for Schwann Cell OECs
Previous studies suggested that the OECs derive from cells of the nasal mesenchyme (Perera et al. 2020). However, the group of Sox10‐positive cells, comprising the SCPs derivatives/glial cells, formed an isolated cluster not in a continuum with the nasal mesenchyme (Figure 1A,B). Sub‐clustering the Sox10 enriched SCPs derivatives/glial cell cluster (Figures 1A,B and 2A,B) determined the formation of 4 subclusters that we classified as 4 cell types: presumptive melanocytes (rich in Mitf expression), SCPs (Ki67/proliferative), SCs (low Fabp7), and OECs (high in Fabp7) (Perera et al. 2020).
FIGURE 2.

The re‐clustering of the Sox10‐enriched cluster “Schwann Cell Precursor (SPC) derivatives/glia” indicates that the OECs form from SCPs. (A) The Sox10‐enriched cluster includes four cell types: Schwann Cell Precursors (SCPs), Melanocytes, Schwann Cells (SCs), and Olfactory Ensheathing Cells (OECs). SCs and OECs seem to form a dichotomy beginning with SCPs. (B) Feature plots display enriched genes in specific subclusters; the arrow colors indicate the clusters of the same colors in (A). (C) Re‐clustering of (A) without melanocytes implies the presence of an intermediate cell population of immature SCs (imSCs). (D) A model proposing that the OECs associated with olfactory/vomeronasal neurons (OSNs/VSNs) and the Schwann cells (SCs) of the peripheral nerves (PNs) both originate from Schwann cell precursors (SCPs). (E) RNA Velocity indicates that OECs and SCs differentiate starting from SCPs; darker colors indicate a less‐differentiated state, while orange‐yellow signifies more differentiated states. (F) Heatmap illustrating enriched genes in SCPs, imSCs, SCs, and OECs. (G) Violin plots demonstrate Fabp7 and Nell2 enrichment in OECs. (H) Nell2 and Fabp7 colocalization (arrowheads) in OECs surrounding the olfactory bulb (OB). (I–J″) Cdh6 and Nell2 immunoreactivity appear to be mutually exclusive, with Nell2 enriched in OECs and Cdh6 in SCs along the trigeminal projections (Tg). (K) In situ hybridizations on lateral and medial sections of E14.5 mouse heads showing Cdh6, Mpz, and Nell2. Cdh6 and Mpz RNA are visible in the ethmoidal projections (Et) of the trigeminal ganglion (Tg), while Nell2 is not found in the trigeminal projections but in the OECs in the nose and surrounding the olfactory bulb (OB) (images are from gene paint).
To delve deeper into the gene expression patterns of the glial cells, we focused exclusively on isolating and re‐clustering the group of cells that gave rise to the dichotomy and excluded the presumptive melanocytes (light gray box in Figure 2A,C). Utilizing scVelo, we conducted RNA Velocity analysis (Figure 2E). We implemented a pseudo‐temporal reconstruction in Python, allowing us to track the dynamic gene expression along the developmental trajectories of the two branches (Figure 2D,E). Examining differential gene expression (heatmap, Figure 2F) highlighting key markers previously identified in the literature as specific to SCPs, SCs, or OECs (Perera et al. 2020; Rich et al. 2018). We found that the “branch point” expressed the recently discovered SCP marker genes such as Dlx1/2 and Itga4 (Kastriti et al. 2022) (Figure 2E), as well as the broadly accepted markers for SCPs such as Gap43, Nfib, and Cdh19 (Jessen and Mirsky 2019; Perera et al. 2020) (Figure 2F,G). Conversely, the branch with low Fabp7 expression was found to be positive for gene markers that align with SCs such as Mpz, Mbp, and Mal (Liu et al. 2015; Perera et al. 2020) (Figure 2C,G), while the branch exhibiting high Fabp7 (Figure 2F,G) expression corresponds to OEC marker genes such as Reln, Nell2, and Alx3 (Perera et al. 2020; Taroc et al. 2019). Notably, after refining the clustering to only include the glial populations, the SC branch could be further defined as immature Schwann Cells (imSCs) and mature Schwann Cells (SCs) (Figure 2C). The imSC population can be genetically defined by a reduction of proliferative markers such as Mki67 and the mixed expression of SCP markers such as Gap43, Nfib, Ngfr, with mature SC markers like Gjc3, and S100b (Figure 2F) (Jessen and Mirsky 2005; Jessen and Mirsky 2019; Kastriti et al. 2022) indicating that this is a transitional stage during SC development.
To validate the specificity of some of these markers, we conducted immunofluorescent staining that showed us that the OECs along the olfactory nerve layer (notched arrow) are immunoreactive for Fabp7 and Nell2 but not for Cdh6 (Figure 2H–I) (Perera et al. 2020; Taroc et al. 2019), while the SCs along the trigeminal ganglion (arrow) are strongly immunoreactive for Cdh6 (Figure 2H–J′) but not for Nell2. This is further validated by ISH data from Genepaint where Cdh6 and Mpz mRNA can be localized to the trigeminal (Tg) and etomoidal (Et) projections, while Nell2 mRNA is found surrounding the olfactory bulb and olfactory epithelium/vomeronasal organ (Figure 2K).
2.3. Hippo‐Pathway Effector Molecules Yap, Taz, and Tead1/2 Are Expressed Broadly in the Developing Nasal Glial Populations
YAP and TAZ regulate gene expression by integrating external and internal signals that control diverse transcriptional programs. YAP and TAZ can shuttle between the cytoplasm and the nucleus, depending on the stimulus. In the nucleus, they pair with DNA‐binding factors from the TEAD family to regulate gene expression (Vassilev et al. 2001; Zhang et al. 2008).
Previous studies have shown that the loss of the Hippo effector molecules YAP and TAZ in SCs, led to defects in their differentiation and function (Jeanette et al. 2021; Poitelon et al. 2016). To investigate whether YAP and TAZ are expressed in the SCPs, SCs, and OECs we looked at our single‐cell RNA sequencing data. Feature plots and violin plots for Yap1, Taz/Wwtr1, Tead1 and Tead2 show expression in all clusters within the glial populations, suggesting a role for Hippo signaling in OEC development. (Figure 3A,B).
FIGURE 3.

Yap Taz, Tead1/2 are expressed in the developing nasal glia. Feature plots (A) and violin plots (B) show Yap1 and Taz, Tead1 and Tead2 expression in SCPs, imSC, SCs, and OECs.
2.4. Sox10‐Cre Mouse Line Gives a More Restricted NCC Recombination Than the Pre‐Migratory Wnt1‐Cre2 Mouse Line
Wnt1 is expressed in pre‐migratory neural crest as they form in the dorsal neural tube but is not expressed by migratory NCC or its derivatives. Consistent with this, single‐cell sequencing of the nose at E14.5 showed no cells expressing Wnt1 (Figure 4A). By crossing the widely used Wnt1‐Cre2 mouse line with the Ai14 Rosa26 reporter, we observed an extensive recombination in the olfactory bulb, OECs, nasal mesenchyme, and in cells within the olfactory/vomeronasal epithelia (Figure 4C–C″ and 4B′). In both the olfactory epithelium (OE) (Figure 4B″) and vomeronasal organ (VNO) (Figure 4B‴), we detected neuronal cells positive for recombination and for the neuronal markers Elav‐like protein 3 antigen C and Elav protein 4 antigen D (HuC/D) as well as cells only positive for recombination. In contrast, Sox10, which is expressed later in the migratory NCC and is downregulated in most derivatives, except SCPs, SCs, melanocytes, OECs, and some mesenchymal cells of the frontonasal region (Figure 1C). Notably, the intermixing of pre‐migratory NCCs with cells forming cranial placodes, as well as the integration of presumptive migratory NCC with olfactory epithelia, have been previously proposed and reported (Forni et al. 2011; Forni and Wray 2015; Katoh et al. 2011; Murdoch et al. 2010; Saxena et al. 2013; Whitlock 2004).
FIGURE 4.

Pre‐migratory NC Wnt1Cre2 broadly recombines in cells in non‐NC derivatives, while the post‐migratory Sox10Cre gives more faithful NC tracing. (A) UMAP, single‐cell sequencing at E14.5 reveals that Wnt1 is not expressed in the cells of the developing nose. (B–B‴) Immunofluorescence with anti‐tdTomato (red), HuC/D (green), and DAPI (blue). (B′) Wnt1‐Cre2 recombination occurs in the cells of the olfactory bulbs (OB) and olfactory ensheathing cells (OECs). (B″) Recombination in neurons and non‐neuronal cells of the olfactory epithelium (OE); (B″) Recombination in neurons of the vomeronasal organ (VNO). (C′–C″) Immunofluorescence with anti‐tdTomato (Red), HuC/D (green), and DAPI (blue) displays broad recombination in the OB, OE, VNO, and nasal mesenchyme (NM). (D) Sox10Cre/Ai14 mouse at E14.5; immunofluorescence with anti‐tdTomato (RED), HuC/D (green), and DAPI (blue) indicates recombination in the nasal mesenchyme (NM) and in sparse cells of the OE. (E′–E‴) Immunofluorescence shows recombination (red) in Nell2 (green) OECs (arrow). (F′–F‴) Sox10Cre recombination occurs in sparse neurons in the main olfactory epithelium positive for HuC/D. (G–G‴) Sox10Cre recombination appears in sparse nonneuronal cells in the VNO that are negative for HuC/D.
Thus, based on the extensive Wnt1‐Cre2 recombination in non‐neural crest‐derived tissues, which has also been recently reported by others (Gandhi et al. 2024), we decided to explore the Sox10‐Cre transgenic mouse line as an alternative strategy to conditionally ablate Yap/Taz in the cranial NCCs (Jacques‐Fricke et al. 2012).
We validated the Sox10‐Cre mice with Ai14 Rosa26 reporters and collected Sox10‐CreTg/Ai14 embryos at E14.5 and postnatal stages (Figure S1). Observation of nose sections showed expected recombination in the NCC‐derived frontonasal cartilage and nasal mesenchyme (Figure 4D). The OBs and brain showed no recombination except for presumptive pericytes (Figures 4D,E‴ and S1). Immunostaining against the OEC marker NELL2 confirmed the recombination in the OECs along the olfactory axons proximal to the OB (Figure 4E′–E‴).
However, in line with previous studies using other presumptive NCC Cre tracing lines such as Wnt1‐Cre, Pax7‐Cre, and P0‐Cre, we also found recombination in sparse cells in the OE and VNO (Figure 4D,E‴ and 4F′–G‴). Some traced cells were positive for the neuronal markers HuC/D, while others were negative. At E14.5 we estimate that Sox10‐Cre recombination accounts for less than 1% of the cells in the OE and VNO.
In postnatal animals, less than 1% of the cells in OE and VNO were positive for tracing (Figure S1). Notably in the OE of postnatal animals, we identified traced sparse neuronal cells, and presumptive cells of Bowman's glands.
2.5. Yap cHet ; Taz cKO Mutants Exhibit a Reduced Number of Sox10‐Positive Cells Along the Developing Olfactory Fibers and a Decreased Number of Olfactory Marker Protein (OMP)‐ Positive Neurons in the Olfactory Epithelium
Past investigations have conditionally knocked out Yap and Taz in presumptive NCCs using both the first‐generation Wnt1‐Cre (Danielian et al. 1998) and the second‐generation Wnt1‐CreSor/Wnt1‐Cre2 (Lewis et al. 2013) as pre‐migratory NCC genetic entry points (Wang et al. 2016). Homozygous loss of Yap and Taz in NC‐derived cells caused embryonic lethality at E10.5, making these genetic models unsuitable for our study (Wang et al. 2016). As we observed extensive recombination in the Wnt1‐Cre2 lines, we generated and analyzed Sox10‐Cre/YapFlx/WT;TazFlx/Flx (Yap cHet;Taz cKO).
Analyzing Sox10‐Cre lineage tracing in postnatal animals indicated recombination in the Bowman glans and sparse neurons, which we estimated to be less than 1% (Figure S1). Gross observations at E14.5, in line with what previously reported for Wnt1‐Cre/YapFlx/WT;TazFlx/Flx; revealed no noticeable morphological differences between control and mutant embryos (Wang et al. 2016). To understand whether the SCP derivatives in the nasal area are affected by altered Yap and Taz expression, we performed immunostainings against Sox10 on parasagittal sections of the head of both triple mutant and control WT embryos at E14.5 (Figure 5A,B). Quantifications of Sox10‐positive cells proximal to the lamina propria of the olfactory epithelia and along the peripherin positive fibers of the olfactory sensory neurons (OSNs) revealed an overall ~30% reduction in the number of Sox10‐positive cells in the frontonasal region of Yap cHet;Taz cKO (Figure 5C). However, performing more targeted quantifications revealed notable differences in the number of OECs in different head regions. Specifically, in the Yap cHet;Taz cKO mutants, we found that, at this stage, the most dramatic reduction in Sox10‐positive OECs was around the olfactory bulbs (−44%), which starkly contrasted with the much lower (−19%) reduction in Sox10‐positive OECs lining the lamina propria of the olfactory epithelia (Figure 5D).
FIGURE 5.
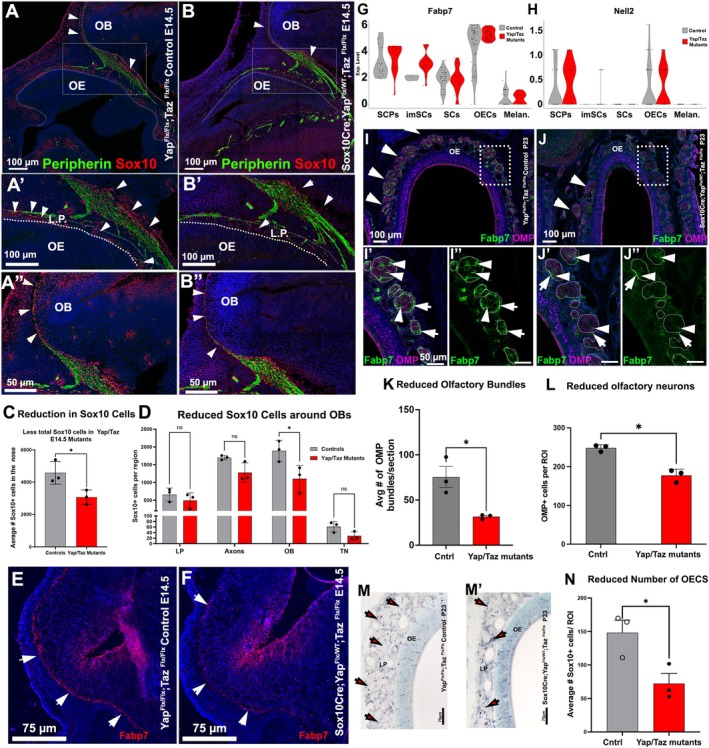
SoxCre/YapFlx/WT;TazFlx/Flx have reduced nasal glial cells and less olfactory neurons. (A–B″) Immunofluorescence against Sox10 (red) and Peripherin (green) shows the nasal glia (arrowheads) associated with the olfactory‐vomeronasal axons projecting to the Olfactory bulb; controls (A, A′) and SoxCre/YapFlx/WT;TazFlx/Flx (B–B″). (C) quantification showing a reduction in the total number of Sox10+ cells in conditional cKO (+/− SEM). (D) Quantification indicates a statistically significant reduction of the olfactory ensheathing cells (OECs) around the olfactory bulbs (OBs) (+/− SEM). (E–F) Immunoreactivity against Fabp7 of the OECs around the OB in controls (E) and mutants (F) where Fabp7 was barely detectable. (G, H) Violin plots show comparable mRNA expression for Fabp7 and Nell2 in the OECs of control and mutant mice. (I–J′) Fabp7 (green) and OMP (magenta) staining show fewer olfactory bundles around the OE (arrows in I and J; quantifications) in (K) and reduced reactivity for both Fabp7 in the OECS surrounding the OMP+ axonal bundles in the lamina propria (I′–J″) (+/− SEM). (L) OMP+ cell quantifications suggest a reduction in the olfactory neurons in SoxCre;YapFlx/WT;TazFlx/Flx mutants (+/− SEM). (M, M') Sox10 immunostaining reveals a decreased number of OECs (black dots) in the lamina propria, and (N) quantification indicates a reduction in the number of olfactory neurons in SoxCre/YapFlx/WT;Tazxmutants (+/− SEM).
Fabp7 immunostaining showed that Fabp7 was barely detectable in the Yap cHet;Taz cKO mutants both at embryonic and postnatal stages (Figure 5E,F,I,J), while it was evident in the control littermates. However, when comparing single‐cell sequencing data from control littermates and Yap cHet;Taz cKO, we surprisingly found no significant changes in mRNA expression for Fabp7 and Nell2 in OECs (Figure 5G,H). These findings suggest that the changes in Fabp7 immunodetectability either reflect variations in the number of OECs, translational, or structural changes (Figure 5C).
To determine whether further changes could be observed in postnatal animals, we analyzed P23 Yap cHet, Taz cKO mice, and control littermates. Immunostaining for Sox10 revealed a persistent (~50%) reduction in the number of OECs in Yap cHet;Taz cKO (Figure 5M,N). In accordance with observations made during embryonic development, BLBP immunostaining remained nearly undetectable in postnatal Yap cHet;Taz cKO. Quantification of the number of olfactory bundles in the nasal area of P23 animals showed a significant reduction in bundle number (Figure 5K). Quantifying OMP‐positive cells (Figure 5L) in the olfactory epithelium also revealed a significant reduction in the number of olfactory sensory neurons.
Notably, we found a slight but significant change in the proportion between mature olfactory (OMP+) and immature (GAP43) and sensory neurons (OSNs), suggesting a proportional increase in cells in the immature state (WT mean = 1.958+/−SD; cKO mean 1.833+/−0.02 SD; unpaired t‐test p = 0.045; n = 3); (Figure S2A–C).
2.6. Yap and Taz Are Crucial in Controlling Gene Expression and Developmental Progression in the Craniofacial Neural Crest
To investigate how loss of Yap and Taz altered gene expression during the development of migrating neural crest cells, we performed single‐cell RNA sequencing of dissociated noses isolated from Yap cHet;Taz cKO and control E14.5 embryos. When plotted, the cells from Yap cHet;Taz cKO and control groups formed grossly comparable Uniform Manifold Approximation and Projection (UMAP) clusters across genotypes, as shown in Figure 6A,A′.
FIGURE 6.

Sc‐Seq of control and YAP/TAZ mutants shows defective development of the SCP derivatives. (A, A′) UMAPs of control and mutant form comparable cell clusters (cell types indicated in the legend). (B, B′) Subcluster of Sox10+ presumptive SCP derivatives in controls. (B′) The overlay of the UMAP of the control (orange) and mutant (tile) shows that mutant cells are distributed in the whole cluster. (C) Different distribution of Sox10 cellular types (including melanocytes); the mutants gave a smaller yield of Sox10+ cells and had a larger representation of immature SCs and OECs and a decrease in the percentage of SCs and melanocytes compared to controls. (C′) The YAP/TAZ mutants have fewer Sox10+ glial cells; however, within the population, there is an increased representation of immature SCs and reductions in SCs, while the relative representation of OECs is similar to controls. (D) Feature plots showing the expression of indicated genes. mKi67 shows a reduction in proliferative SCPs (green arrow) and melanocytes (light blue arrow), and Cdh6 shows a reduced number of presumptive SCPs (light green) and SCs (olive). (E) YAP/TAZ mutants have reduced proliferative Sox10+ cells. (F) The distribution of proliferative cells across the SCP derivative populations indicates a reduction in proliferation in the mutant SCPs, SCs, melanocytes and SCs but an increase in proliferating imSCs.
For both genotypes, we identified presumptive SCPs and their presumptive Sox10‐positive derivatives: SCs, OECs, and melanocytes (Figure 6B–B′; D). Aligning with our observations from counting the number of SOX10‐positive cells, we found a consistent ~27% reduction in the total number of cells expressing Sox10 mRNA (Figure 6C,C′). Among the Sox10‐expressing cells, the percentage of SCPs remained unchanged (Figure 6C,C′), but we found a dramatic increase in the representation of immature SCs (from 2% in controls to 13%–15% in the Yap cHet;Taz cKO mutants), which is suggestive of changes in SC maturation dynamics. Focusing on the SCPs derivatives (Figure 6C), we noted a ~50% reduction in putative melanocytes and a ~30% reduction in cells expressing SC identity markers. Surprisingly, though reduced in number, we found no gross changes in the relative percentage of cells with putative OEC identity.
By analyzing the number of Sox10 proliferative cells (Mki67+), we found a reduction in the number of cells undergoing mitosis in the Yap cHet ;Taz cKO mutants (Figure 6E,F). Specifically, by examining the distribution of proliferative cells across different cell types (Figure 6F), we found evidence of a dramatic reduction in the percentage of proliferating SCPs (−17%). In line with other studies, we observed a complete loss of proliferative SCs (Belin et al. 2017; Jeanette et al. 2021). Notably, we found an increase in the number and proportion of proliferative immature Schwann Cells, suggestive of a delayed transition from imSCs to SCs. As reported by others, we also found a dramatic loss of melanocytes (Manderfield et al. 2014), while the less affected cells, though reduced in number, appeared to be the proliferative OECs.
To gain a better understanding of the impact of the identified gene changes (Figure 7) on key cell pathways, we performed a predictive analysis of pathway activity and regulatory networks using Qiagen's Ingenuity Pathway Analysis tool (Figure 8). Analysis of the data indicates that the SCPs show an increase in the expression of genes involved in DNA Methylation and Transcriptional Repression, an increase in Rho GTPase activity, changes in TGF‐b and Notch signaling, a reduction in G2‐M phase during mitotic metaphase, and an increase in ubiquitination (Figures 7A and 8A). The immature SCs are among the cells more affected in terms of cell distribution (Figure 6C,C′) and were found to be the cell state with the largest group of downregulated genes (Figures 7B and 8B). These included genes involved in DNA synthesis, mRNA processing, a decrease in ubiquitination, and Golgi to ER trafficking, suggestive of defective protein synthesis. In the SCs (Figures 7C and 8C), we observed a decrease in RUNX2 activity, DNA synthesis, and Wnt1 signaling, while in the OECs (Figures 7D and 8D), we noted a decrease in RNA Pol II transcription and genes involved in mRNA processing, which suggests that several defects might arise from changes in translation. In line with previous studies, we found a loss of Mitf (Manderfield et al. 2014) and Mitf‐dependent gene expression in the melanocytes including cKit (Figures 7E and 8E). In Tables [Link], [Link] provide the complete list of differential gene expression (DGE) between control and mutant samples, while the genes affecting different pathways are detailed in Tables [Link], [Link].
FIGURE 7.

(A–E) Volcano plots displaying differentially expressed genes, between controls (left) and conditional Yap‐Taz mutants (right), in Schwann cell precursors (A), immature Schwann cells (B), Schwann cells (C), olfactory ensheathing cells (D), and melanocytes (E). Red dots indicate p value ≤ 0.05 and fold change ≥ 1.
FIGURE 8.

(A–E) Predictive analysis of changes in pathway activity and regulatory networks using Ingenuity Pathway Analysis (QIAGEN) in Schwann cell precursors (A), immature Schwann cells (B), Schwann cells (C), olfactory ensheathing cells (D), and melanocytes (E) of Yap Taz mutants and control from the differential gene expression data performed in Figure 7.
2.7. Yap cHet ; Taz cKO Mutants Have a Comparable Distribution of GnRH‐1 Neurons to the Control Group
Previous studies have shown that genetic mutations compromising neural crest development and the development of OECs can disrupt the migration of GnRH‐1 neurons (Taroc, Naik, et al. 2020; Barraud et al. 2013; Pingault et al. 2013). After observing a reduction in OECs in the nasal region of Yap cHet;Taz cKO mutants, we decided to investigate potential secondary effects on GnRH‐1 neuronal migration (Figure 9A,B). Contrary to our expectations of disrupted migration, anti‐GnRH‐1 immunostaining and quantifications of GnRH‐1 neuron numbers and distribution showed no obvious differences between genotypes at the observed developmental stage (Figure 9C).
FIGURE 9.
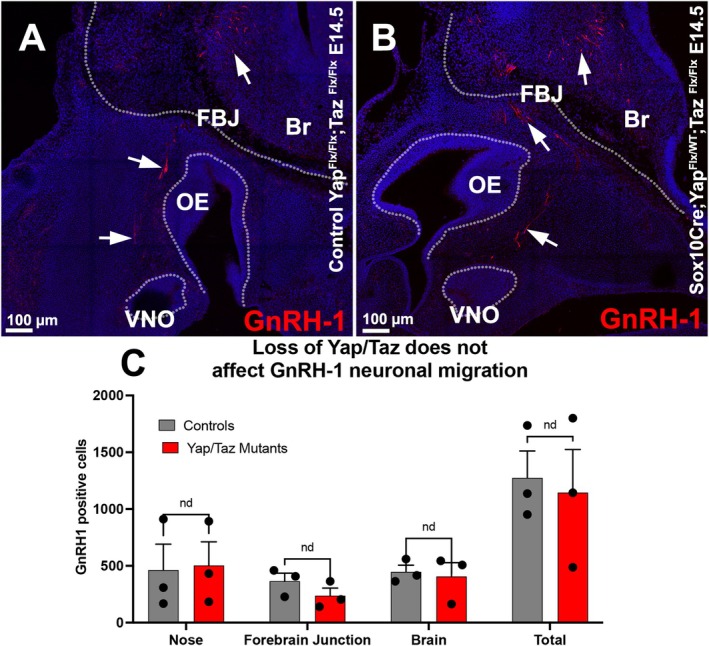
(A) Immunofluorescence anti‐GnRH‐1 shows GnRH‐1 neurons migrating to the brains of control and YAP/TAZ mutants. (B) Quantification of GnRH distribution between the nasal area, forebrain junction, and brain shows no significant difference in migrattion dynamics or total cell number across genotypes (+/− SEM; n = 3).
2.8. Yap cHet ; Taz cKO Have a Reduced Number of Vomeronasal Neurons, a Reduced Number of OECs Around the VNO, and Defective Vascularization of the VNO
The development and maturation of the olfactory epithelia are profoundly controlled by inductive signals from the surrounding nasal tissues, frontonasal mesenchyme, and OECs, which are of NC origin (Forni et al. 2013; LaMantia et al. 2000; Perera et al. 2020). Based on this, we analyzed the vomeronasal neurons in Yap cHet;Taz cKO mice. The VNO mainly comprises two types of neurons: apical, which express the transcription factor Meis2 and the V1R family of receptors, and basal vomeronasal sensory neurons (VSNs), which express the transcription factor Tfap2e (AP‐2e) as they mature and the V2R family of receptors (Katreddi and Forni 2021) (Figure 10A–B′). Sox10Cre lineage tracing suggests the existence of Sox10‐expressing progenitors that give rise to only sparse neurons (less than 1%) in the vomeronasal area (Figure S1). However, quantifications showed, as for the main olfactory epithelium, a significant reduction in vomeronasal neurons (Figure 10A–C).
FIGURE 10.

Postnatal Sox10 Cre/YapFlx/WT; TazFlx/Flx have a reduced number of vomeronasal sensory neurons, reduced number of OECs and vasculature. P23, immunostaining against AP‐2e (red) and Meis2 (green) in Controls (A, A′) and Yap Taz mutants (B, B′) shows a decreased thickness of the epithelium and visibly fewer apical Meis2+ and basal AP‐2e neurons. (A′ and B′) are enlargements of the boxed areas in (A, B). (C) Quantifications show a reduced number of apical and basal VSNs in the mutants (red) (+/− SEM). (D, D′) Sox10 immunostaining in nickel DAB reveals Sox10+ cells in the lamina propria of the VNO (arrows) of controls (D) and Yap/Taz mutants (D′). (E) Quantifications show a significantly reduced number of Sox10+ cells in the conditional Yap;Taz mutants (+/− SD).
These data indicate defective development of the NCC derivative in the nasal area. The nasal mesenchyme and OECs have broad secondary effects on the number of chemosensory neurons, likely resulting from changes in local inductive signals. Quantification of the OECs along the basal lamina and within the lamina propria of the VNO indicated a reduced number of glial cells (Figure 10D–E).
2.9. The Reduction in Basal/V2R Vomeronasal Neurons Decreases the Number of Vascular Intrusions
Conditional loss of Yap and Taz in NC derivatives was previously described as indirectly causing defects in blood vessel formation in developing embryonic heads (Wang et al. 2016). Notably, both OECs and SCs have been described to induce vascularization in their surrounding tissue environment (Taïb et al. 2022; Wang et al. 2022). To understand whether the Sox10Cre Yap cHet;Taz cKO mice have vascular defects, we analyzed the highly vascularized vomeronasal chemosensory epithelium.
In the vomeronasal organ, blood vessels invade the basal territories where the basal VSNs, positive for Tfap2e/AP‐2ε, V2R, Gao, reside (Naik et al. 2020). Collagen type IV (Col IV) is a basement membrane protein enriched during vessel morphogenesis (Gross et al. 2021). We previously described Col IV being expressed around the Pecam1+ vasculature, invading the basal regions of the vomeronasal organ (Naik et al. 2020). Quantifying the number of vascular intrusions in the vomeronasal organ using Col‐IV or PECAM1 immunostaining (Figures 11A,B and S3A–C) revealed a significant reduction in the vascularization of the vomeronasal epithelium of mutant mice.
FIGURE 11.

Reduction in basal VSNs correlated with a reduction in vascular intrusions. (A, A′) Collagen IV (Col‐IV) immunofluorescence highlights vasculature (arrows) in the VNO of controls YapFlx/Flx; TazFlx/Flx and Sox10 Cre/YapFlx/WT; TazFlx/Flx mutants at P23. (B) Quantification of the number of vessels per VNO section demonstrates similar reduction in number of vascular intrusions in Yap Taz mutants and in AP‐2eKOs.
The transcription factor Tfap2e is selectively expressed in the basal VSNs of the VNO, not in the vasculature nor the nasal mesenchyme (Hills et al. 2024; Lin et al. 2022; Lin et al. 2018). Tfap2e KO (AP‐2e KO) mice have a reduced number of VSNs (Lin et al. 2018). To understand if such a phenotype could result from defects in the vomeronasal epithelium rather than from broad defects in neural crest‐derived cells, we analyzed the number of vascular intrusions in AP‐2e KO mice (Figure 11B). Quantifying the number of vascular indentations in the basal territories of the VNO indicated similar vascularization reductions between YapcHet;TazcKO and AP‐2e KO mice. These data suggest that the vascular phenotype in YapcHet;TazcKO mice is, at least in part, secondary to the decrease in basal VSNs.
Notably, quantifications of the number of blood vessels surrounding the main olfactory epithelium also revealed a reduction in YapcHet;TazcKO (Figure S3D–F).
3. Discussion
The nasal glial populations associated with the terminal nerve, olfactory, and vomeronasal neurons are commonly referred to as the OECs. Over the last 30 years, these cells have excited scientists for their potential in treating spinal cord injuries. (Assinck et al. 2017; DeLucia et al. 2003; Goulart et al. 2016; Gu et al. 2017; Huang et al. 2024; Khankan et al. 2016; Ma et al. 2010; Raisman 2001; Ramon‐Cueto et al. 1998; Riddell et al. 2004). However, the molecular characterization and developmental processes of these glial cells have only been partially addressed.
The OECs are essential for organizing the olfactory nerve bundles, establishing the olfactory system connections with the olfactory bulbs, and ensuring the correct migration of GnRH‐1 neurons (Barraud et al. 2013; Pingault et al. 2013; Taroc, Naik, et al. 2020). Initial studies on the embryonic lineage of these cells proposed that they originate from the olfactory placode (Couly and Le Douarin 1985). However, the neural crest origin of the OECs was then proposed and tested, over a decade ago, through a series of genetic lineage tracing in mice and quail‐chicken tissue graft experiments (Barraud et al. 2010; Forni et al. 2011).
Several genetic lineage tracing studies also proposed the contribution of the NCCs, or cells with genetic overlaps to the NC, to the olfactory epithelia (Barraud et al. 2010; Forni et al. 2011; Katoh et al. 2011; Koontz et al. 2022; Murdoch et al. 2012; Saxena et al. 2013). These studies proposed that some OSNs, VSNs, and microvillar cells can originate from NCCs.
Projections from the trigeminal nerve innervate the nasal region of rodents (Hummel and Frasnelli 2019; Tremblay and Frasnelli 2018; Ulusoy et al. 2022). Previous studies in rodents suggested the existence of heterogeneous populations of OECs in the nasal area of mice, with cells showing similarities to both SCs of the peripheral nervous system and other cells exhibiting specific OEC features (Guerout et al. 2010; Miedzybrodzki et al. 2006; Smith et al. 2020). However, only a handful of studies have attempted to follow the development and identify the key molecular markers and mechanisms responsible for forming OECs (Perera et al. 2020; Rich et al. 2018). A recent study suggested that the origin of the OECs may differ from that of the SC, with the OECs forming from mesenchymal progenitors and SCs from SCPs. However, studies from the peripheral system suggest that glial and mesenchymal programs are divergent (Kastriti et al. 2022).
Our data, in line with a seminal study (Perera et al. 2020), show that both SCs and OECs are present in the nasal area. Moreover, we confirmed the previously described markers and identified new ones that allow us to discriminate between the developing olfactory ensheathing cells and SCs of the PNS (Figure 2). Single‐cell sequencing of the developing nose allowed us to identify Hub/SCPs, presumptive SCs, OECs, and melanocytes. RNA Velocity analysis indicates that OECs and SCs originate from SCPs (Figures 1 and 2).
The OECs appear between E10.5 and E11.5 when the olfactory migratory mass leaves the developing olfactory pit (Forni et al. 2011; Perera et al. 2020). Whether the SCPs giving rise to the OECs arrive at the developing olfactory system from other peripheral projections or form from “hub cells” (Kastriti et al. 2022) contributing to the nasal mesenchyme remains to be seen (Perera et al. 2020; Soldatov et al. 2019; Xie et al. 2019).
Differential gene expression analysis revealed specific marker genes for each of the cell populations originating from Sox10 SCPs in the nose (Figure 2), allowing for the discrimination between populations. Further validation through immunofluorescent staining confirmed the specificity of these markers in different cell populations, making Nell2 and Fabp7 reliable OEC markers, while Cdh6 was found to be enriched in SCPs and SCs along the trigeminal projections.
The transcription factors Yap and Taz have previously been indicated to play a key role in modulating genes responsible for craniofacial and SCs development and function (Poitelon et al. 2016; Wang et al. 2016). Notably, we found that Yap and Taz, along with the co‐factors of the Tead family, are also expressed in the nasal SCPs and their presumptive derivatives, including the OECs. Based on this, we decided to explore how much Yap‐Taz play a similar role in OECs, as described for the Schwann cells of the PNS.
Genetic tracing using the early neural crest pre‐migratory marker Wnt1 suggested that neural crest cells may co‐mingle with the cells of the developing olfactory placode and integrate within the olfactory placode. However, by testing the recombination of the widely used second generation of Wnt1‐Cre mice (Wnt1‐Cre2) (Lewis et al. 2013), we found broad recombination in tissues of non‐neural crest origin, including the olfactory bulbs (Figure 4). Wnt1 is not expressed in the cells of the developing nose (Figure 4). However, in line with recent observations by others (Gandhi et al. 2024)., we noted extensive recombination of Wnt1‐Cre2 in non‐NC derivatives, including most of the cells the olfactory epithelium and the olfactory bulbs. The extent of recombination renders this mouse line unsuitable for experiments aimed at selectively manipulating genes in the cranial neural crest. We, therefore, adopted Sox10‐Cre as an alternative; this line demonstrated reliable recombination in the nasal mesenchyme and OECs.(Figure 4). However, consistent with tracing using the first generation of Wnt1‐Cre mice (Forni et al. 2011; Katoh et al. 2011), we also found sparse traced cells in the olfactory and vomeronasal epithelia (Figure 4), which estimated to be less than 1% of the olfactory/vomeronasal sensory neurons (Figure S1). Furthermore, consistent with zebrafish data (Saxena et al. 2013), we found neurons positive for Sox10 tracing in the main olfactory epithelium. Additionally, in line with previous observations (Perera et al. 2020), we confirmed Sox10 expression and recombination in Bowman's gland progenitors. These data confirm the existence of Sox10‐expressing cells that contribute to the olfactory epithelium; whether these are NC derivatives remains an open question.
Using Sox10Cre we generated Sox10Cre Yap cHet;Taz cKO. The overall number of OECS and other Sox10 cells associated with neurons in the nasal area of YapcHets/TazcKOs was significantly reduced both in embryonic and postnatal noses (Figures 5, 6, and 10). Manipulation in Yap and Taz affected the proliferation of the SCPs, leading to reduced formation of their derivatives and likely altered maturation, as suggested by the accumulation of cells in an imSCs state (Figure 6). Notably, defective proliferation was also noted in SCs and melanocytes. Among the SCPs derivatives forming in the nose, Sc‐seq showed extensive decreases in gene expression and an accumulation of cells in the immature SCs stage (Figures 6, 7, 8; Tables S1 and S6). In the conditional mutant, we found a dramatically decreased percentage of cells progressing into the Schwann cell and melanocyte differentiation program (Figure 6).
Pax3, together with Sox10, controls the expression of the microphthalmia‐associated transcription factor (Mitf), which is essential for melanogenesis. Mutations in Sox10 and Pax3 in humans lead to Waardenburg syndrome, marked by pigmentation abnormalities and hearing loss, resulting in OEC defects. Taz/Yap65 interacts with Pax3 to regulate Mitf expression (Manderfield et al. 2014). Manipulation of migratory/post‐migratory Taz/Yap using Sox10‐Cre confirmed the loss of c‐KIT and Mitf (Manderfield et al. 2014) and downstream melanocyte genes (Figure 7E–E3; Tables S2 and S7), as previously reported after pre‐migratory Wnt1‐Cre recombination (Manderfield et al. 2014). Along with that, we found differential changes in gene expression and signaling pathways in all analyzed maturation stages of the examined SCP derivatives (Figures 7 and 8; Tables S5 and S10).
Development of the craniofacial mesenchyme, cartilage, bones, and the olfactory epithelium is intimately interdependent. In fact, the differentiation in the olfactory epithelium depends on inductive interactions with the surrounding neural crest‐derived tissues (Forni et al. 2013; LaMantia et al. 2000). Our histological analysis of YapcHetTazcKO showed an overall decrease in the number of neurons in the olfactory and vomeronasal systems. OMP expression levels increase with synapse formation (Farbman and Margolis 1980); however, defective OECs can compromise the targeting of the olfactory bulb. Changes in the ratio of OMP/GAP43 OSNs suggests that in Yap;Taz mutants, a larger portion of the OSNs are immature. This could suggest that defective olfactory axon targeting as descibed for the Frzb‐null mice (Rich et al. 2018).
Notably, in a previous study using Ascl1 KO, we observed that changes in the number of OECs directly depend on the number of olfactory neurons (Taroc, Naik, et al. 2020). In Yap cHet;Taz cKO we found that the neurons of the VNO are reduced by ~30% (Figure 10). So, due to the extent of NCC's contribution to the nasal area, the role of the nasal mesenchyme in controlling the olfactory structure's development, and the role of olfactory/vomeronasal neurons in controlling the OECs, it is virtually impossible, with the experimental paradigm we adopted, to discern between cell‐autonomous and secondary changes in the OECs development.
The OECs are crucial for olfactory development and GnRH‐1 neuronal migration (Barraud et al. 2013; Pingault et al. 2013; Zhou et al. 2017). Our observations in Yap and Taz mutants showed defective OEC development but no change in GnRH‐1 neuronal migration (Figure 9). Notably, evidence indicates that, despite the syndromic manifestation of olfactory and GnRH‐1 migratory defects in Kallmann syndrome, the development of the olfactory system and the terminal nerve‐GnRH system overlap only partially (Amato et al. 2024; Taroc et al. 2017). Our data, consistent with observations in Frzb mutants (Rich et al. 2018), suggest that the TN‐GnRH‐1 system is highly resilient in its ability to access and invade the brain. Additionally, the role of the OECs in regulating olfactory and TN development may depend on distinct mechanisms, if not on different cellular processes altogether.
The basal territory of the vomeronasal organ of mice, where the V2R‐expressing neurons reside, is highly vascularized with blood vessels forming regular indentations in the sensory epithelium (Dietz et al. 2025; Katreddi and Forni 2021; Naik et al. 2020). The Yap cHet;Taz cKO mutants have significantly fewer (around −30%) vomeronasal organ neurons (Figure 10) and fewer vascular indentations than the controls (Figure 11). To understand whether the changes in vascularization in the VNO were secondary to defects of the vomeronasal organ, we analyzed the vascularization of the VNO of Tfap2e/AP‐2e KO mouse mutants (Lin et al. 2022; Lin et al. 2018). These mice have dramatic defects in basal/V2R vomeronasal neurons but normal V1R neurons. AP‐2ε KO mice showed a comparable reduction in the number of vascular indentations as the Yap cHet;Taz cKO. As AP‐2ε is not expressed in vasculature or nasal mesenchyme, these data suggest that loss of the basal/V2R neurons alone is sufficient to alter the number of vascular indentations of the basal territories of the VNO. Notably, we also observed changes in the number of blood vessels around the olfactory epithelium. Whether these result from changes in the sensory epithelium or in the surrounding mesenchyme needs to be further explored.
In conclusion, this paper provides compelling evidence indicating that OECs originate from SCPs as the SCs of the PNS. Yap and Taz contribute to OECs development similarly to what was reported for the SCs. Moreover, we provide exciting evidence of the extent of the crosstalk between NC and placodal derivatives in controlling the development of the various cell types in the developing nose defining structures, and homeostasis of the olfactory epithelia (LaMantia et al. 2000).
Our findings highlight the critical involvement of the Hippo Pathway in NC derivatives in shaping the nasal area, giving insights into potential underlying defects in the olfactory system associated with neurocristopathies and evolution (Jacobs 2019).
4. Material and Methods
4.1. Animals
Sox10Cre (B6;CBA‐Tg(Sox10‐cre)1Wdr/J) (Matsuoka et al. 2005), YapFlx , and TazFlx (Wwtr1 tm1.2Hmc Yap1tm1.2Hmc /WranJ) (Reginensi et al. 2013); Wnt1Cre2 (B6.Cg‐ E2f1 Tg (Wnt1‐cre)2Sor /J) (Lewis et al. 2013); Rosa tdTomato; Ai14 (B6.Cg‐Gt(ROSA) 26Sor tm14 (CAG‐tdTomato)Hze /J) (Madisen et al. 2010) were purchased form JAX. Mouse lines were genotyped via PCR using the line‐specific markers and indicated in Jax.org. Amplification products were analyzed by agarose gel electrophoresis. Animals were euthanized using CO2, followed by cervical dislocation. Mutant and wild‐type mice of either sex were used. All mouse studies were approved by the University at Albany Institutional Animal Care and Use Committee (IACUC).
4.2. Tissue Preparation
Embryos were collected from time‐mated dams where the emergence of the copulation plug was taken as E0.5. Collected embryos were immersion‐fixed in 3.7% Formaldehyde/PBS at 4°C for 3–5 h. Postnatal animals were perfused with ~10 mL of 3.7% Formaldehyde/PBS and then incubated overnight in 3.7% Formaldehyde/PBS at 4°C. All samples were then cryoprotected in 30% sucrose overnight, then frozen in O.C.T (Tissue‐TeK) and stored at −80°C. Samples were cryosectioned (Embryos: Parasagittal; Postnatal heads: Coronal) using CM3050S Leica cryostat and collected on Superfrost plus slides (VWR) at 16 μm thickness.
4.3. Immunohistochemistry
Primary antibodies and dilutions used in this study were: chicken‐α‐peripherin (1:1500, Abcam), rabbit‐α‐peripherin (1:2000, Millipore), SW rabbit‐α‐GnRH‐1 (1:6000, Susan Wray, NIH), goat‐α‐olfactory marker protein (1:4000, WAKO), goat‐α‐AP‐2ε (1:1000, Santa Cruz), mouse‐α‐Meis2 (1:500, Santa Cruz), mouse‐α‐Sox10 (1:1000, Sigma), goat‐α‐collagen IV (1:800, Millipore), rat‐α‐Pecam‐1 (1:150, BD pharmingen), rabbit‐α‐Fabp7 (1:1000, Millipore), rabbit‐α‐Cdh6 (1:200, Invitrogen), sheep‐α‐Nell2 (1:250, R&D), mouse‐α‐Tuj1 (1:1000, Abcam), mouse‐α‐HuCD‐biotin (1:200, Molecular Probes), and goat‐α‐tdTomato (1:1000, Rockland). Antigen retrieval was performed in a citrate buffer prior to incubation with chicken‐α‐peripherin, goat‐α‐AP‐2ε, mouse‐α‐Meis2, mouse‐α‐Tuj1, and mouse‐α‐Sox10. For immunoperoxidase staining procedures, slides were processed using standard protocols (Forni et al. 2013) and staining was visualized (Vectastain ABC Kit, Vector) using diaminobenzidine (DAB) in a glucose solution containing glucose oxidase to generate hydrogen peroxide; sections were counterstained with methyl green. For immunofluorescence, species‐appropriate secondary antibodies were conjugated with Alexa‐488, Alexa‐594, or Alexa‐680 (Molecular Probes and Jackson Laboratories) as specified in the legends. Sections were counterstained with 4′,6′‐diamidino‐2‐phenylindole (1:3000; Sigma‐Aldrich) and coverslips were mounted with Fluoro Gel (Electron Microscopy Services). Confocal microscopy pictures were taken on a Zeiss LSM 710 microscope and Zeiss LSM 980. Epifluorescence pictures were taken on a Leica DM4000 B LED fluorescence microscope equipped with a Leica DFC310 FX camera.
Images were further analyzed using FIJ/ImageJ software. Each staining was replicated on at least three different animals for each genotype.
4.4. Cell Quantifications
All embryonic image quantifications were performed on E14.5 parasaggital sections. Quantification of GnRH‐1 neuronal distribution in mutant and control embryos was performed in the nasal region (VNO, axonal tracks surrounding the olfactory pits), forebrain junction, and brain (GnRH‐1+ cells around the olfactory bulbs and were distributed within the forebrain). The number of cells was calculated for each animal as the average of the counted cells per series multiplied by the number of series cut per animal. Regional quantifications of Sox10 positive cells in control and mutant embryos were performed by counting positive Sox10 nuclei in the mesenchyme/basal lamina, associated with Peripherin positive axons before the forebrain junction, or within the forebrain junction/surrounding the olfactory bulbs. The total number of cells per region was averaged per animal. Quantification of Sox10 positive cells in post‐natal animals was performed by counting the number of Sox10 positive nuclei in the surrounding lamina propria of both the main olfactory epithelium and the vomeronal epithelium. The total number of cells was averaged per animal. All significant differences were assessed by using unpaired t‐tests.
All post natal image quantifications were performed on P23 coronal sections. Post natal neuronal cell quantifications in the main olfactory epithelium and the vomeronasal organ were quantified using olfactory marker protein (OMP), and Tfap2e/Meis2 immunofluorescence respectively. Cells positive for the respective marker within the ROI (39,550 mm2) on each section were averaged per animal and per genotype. Vasculature quantification was performed by counting the number of Collagen IV positive intrusions with the vomeronasal epithelium or the number of Pecam‐1 positive intrusions/vasculature within the VNO or surrounding the OE. Axon bundle quantifications were done on OMP stained sections. The number of bundles was averaged per animal and per genotype.
4.5. Statistical Analyses
All statistical analyses performed on image quantifications were done on GraphPad Prism 10 v10.4.0. Each quantification was performed on at least three biological replicates for control and mutant samples. Significant differences in all quantifications were assessed using a Student's unpaired t‐test where significance was determined to be p value < 0.05.
4.6. Single‐Cell RNA Sequencing
Single‐cell RNA sequencing data used for Figures 1, 2, 3, 4, 5 was previously published by our lab (Amato et al. 2024). Newly generated single‐cell RNA sequencing data (Figures 6, 7, 8) was generated from the noses of E14.5 Sox10Cre/YapcHet/TazcKO and control embryos. In short, the noses of embryos were dissected and isolated in cold 1× PBS. Single‐cell dissociation was performed on each nose using dissociation solution (Papain in Neural Basal Media, Collegnase (0.5 mg/mL), L‐Cysteine (1.5 mM), and DNAse I (100μ/mL)). Dissociated single‐cells were stored in cell freezing media (90% DMSO in FBS) at −80°C. Hindlimb or tail was collected from each embryo for DNA isolation for sex determination and genotyping through PCR. After determining the genotype and sex of each embryo, dissociated single cells were quickly defrosted in a 37°C water bath. Cells were then washed and resuspended in 10% FBS in Neural Basal Media at a concentration of 700–1200 cells/mL. Automated cell counts were done on a T20 BioRad cell counter. GEM bead, cDNA, and library generation was performed using the 10× Chromium Next GEM Single Cell 3’ Reagent Kit v3.1 protocol with the 10× Genomics Chromium Controller located within the RNA Institute. Prepared libraries were then submitted to the Center of Functional Genomics for quality control assesment of the libraries and seqeuncing on the Illumina NextSeq2000 system.
FASTQ files were processed using 10X CELLRANGER v 9.0 and aligned to the mouse reference genome (GRCm39–2024‐A) that is publicly available on the 10X website. The Cellranger output files were further processed using Velocyto to generate loom files. Velocyto loom files were then further analyzed using R/RStudio with the Seurat 5.1v package (Hao et al. 2024). To limit the inclusion of poor quality cells (e.g., Dead cells, doublets) a filter for mito‐genes expressed higher than 90% and a filter for nFeature (genes) of more than 1000 and less than 6000 was used. Normalization of the dataset was performed using SCT Transform, and a Cell Cycle Scoring and Regression method available as a Seurat vignette was also performed to limit clustering based on cell cycle state. Seurat clusters were then converted to hda5 files in Seurat for use on Python. RNA velocity and pseudotime construction was done on Python using the package scVelo (Bergen et al. 2020). Genes that were found to be differentially expressed between mutant and control embryos were analyzed with the use of QIAGEN IPA (QIAGEN Inc., https://digitalinsights.qiagen.com/IPA) (Krämer et al. 2013).
Author Contributions
Ed Zandro M. Taroc, Enrico Amato, Yannick Poitelon, and Paolo E. Forni conceived and designed all experiments. All authors contributed to data collection and analysis. Ed Zandro Taroc and Paolo E. Forni wrote the manuscript. Yannick Poitelon and Sophie Belin, provided critical reagents, guidance, and helped with editing the manuscript. All authors reviewed and approved the final version.
Conflicts of Interest
The authors declare no conflicts of interest.
Supporting information
Figure S1. Sox10‐CreTg/Ai14 mice tracing in postnatal mice reveals traced neurons in the central olfactory epithelium and vomeronasal organ. (A–B‴) P0 Sox10‐CreTg/Ai14 immunofluorescence against neuronal marker Tub III (tubulin III, green), anti‐tdTomato (red) and DAPI (blue) in the main olfactory epithelium (MOE). Recombination highlights neurons (Ns) positive for Tub III (arrows) and Bowman’s glands (BG). (C–C″) Immunofluorescent staining against the olfactory neuron marker OMP (olfactory marker protein, green) and anti‐tdTomato (red) reveals traced neurons expressing OMP. (D–E‴) Double immunofluorescent staining anti OMP and tdTomato within the VNO. Recombination can be observed in neurons positive for OMP and OMP negative pericytes (PCs) surrounding the vasculature.
Figure S2. Disrupted ratio of OMP+ Neurons to Gap43+ Neurons in the olfactory epithelium in Sox10Cre/YapFlx/WT;TazFlx/Flx animals. Immunofluorescence anti‐OMP (green) and GAP43 (red) in (A, A′) controls and (B, B′) Sox10 Cre/YapFlx/WT; TazFlx/Flx mutants at P23. (C) Quantification of the OMP to GAP43 ratio (n = 3, unpaired t‐test p = 0.045). Scale bars in (A, B), 100 μm; (A′–B′), 50 μm.
Figure S3. Reduction in number of Pecam1+ Vasculature in the OE and VNO of Sox10Cre/YapFlx/WT;TazFlx/Flx animals. (A, B) Pecam1 immunohistochemistry labels the vasculature intrusions (arrows) within the vomeronsal organ (VNO) of YapFlx/Flx; TazFlx/Flx controls and Sox10 Cre/YapFlx/WT; TazFlx/Flx mutants at P23. (C) Quantification of the number of vasculature intrusions within mutant VNOs compared to control VNOs (+/− SEM, n = 3; p = 0.014; Unpaired T‐test). (D, E) Pecam1 highlights the vasculature surrounding the olfactory epithelium (OE) in both YapFlx/Flx; TazFlx/Flx and Sox10 Cre/YapFlx/WT; TazFlx/Flx mutants at P23. (F) Quantification of the number of vessels per 100 μm in mutants compared to controls (+/− SEM, n = 6; p = 0.000003; Unpaired t‐test).
Table S1. Differential Gene Expression of Immature Schwann Cell cluster between YapcHets/TazcKOs and control.
Table S2. Differential Gene Expression of Melanocytes cluster between YapcHets/TazcKOs and control.
Table S3. Differential Gene Expression of Olfactory Ensheathing Cell cluster between YapcHets/TazcKOs and control.
Table S4. Differential Gene Expression of Schwann Cell cluster between YapcHets/TazcKOs and control.
Table S5. Differential Gene Expression of Schwann Cell Precursor cluster between YapcHets/TazcKOs and control.
Table S6. Ingenuity Canonical Pathway Analysis of Immature Schwann Cell cluster between YapcHets/TazcKOs and control.
Table S7. Ingenuity Canonical Pathway Analysis of Melanocytes cluster between YapcHets/TazcKOs and control.
Table S8. Ingenuity Canonical Pathway Analysis of Olfactory Ensheathing Cell cluster between YapcHets/TazcKOs and control.
Table S9. Ingenuity Canonical Pathway Analysis of Schwann Cell cluster between YapcHets/TazcKOs and control.
Table S10. Ingenuity Canonical Pathway Analysis of Schwann Cell Precursor cluster between YapcHets/TazcKOs and control.
Acknowledgments
This work was supported by the Eunice Kennedy Shriver National Institute of Child Health and Human Development (NICHD) under Grants 2R01HD097331‐06A1 (P.E.F.) and 1R01HD114827‐01A1 (P.E.F.), as well as by the National Institute on Deafness and Other Communication Disorders (NIDCD) under Grant R01DC017149 (P.E.F). The Zeiss 980 microscope at the University at Albany was funded by the Office of the Director, NIH, under Award Number S10OD028600. Additional support was provided by the National Institute of Neurological Disorders and Stroke (NINDS) under Grants R01NS134493 (S.B.), R01NS110627 (Y.P.), and R03AG089077 (S.B. and Y.P.). In situ hybridization images were sourced from the GenePaint database (https://gp3.mpg.de) (Visel et al. 2004). Access and use of Qiagen's Ingenuity Pathway Analysis software was provided by a floating license from NIH Library.
Taroc, E. Z. M. , Amato E. Jr., Semon A. M., et al. 2025. “Shared Lineage, Distinct Outcomes: Yap and Taz Loss Differentially Impact Schwann and Olfactory Ensheathing Cell Development Without Disrupting GnRH‐1 Migration.” Glia 73, no. 10: 2077–2097. 10.1002/glia.70057.
Funding: This work was supported by the Eunice Kennedy Shriver National Institute of Child Health and Human Development (NICHD) under Grants 2R01HD097331‐06A1 (P.E.F.) and 1R01HD114827‐01A1 (P.E.F.), as well as by the National Institute on Deafness and Other Communication Disorders (NIDCD) under Grant R01DC017149 (P.E.F.). The Zeiss 980 microscope at the University at Albany was funded by the Office of the Director, NIH, under Award Number S10OD028600. Additional support was provided by the National Institute of Neurological Disorders and Stroke (NINDS) under Grants R01NS134493 (S.B.), R01NS110627 (Y.P.), and R03AG089077 (S.B. and Y.P.).
Contributor Information
Yannick Poitelon, Email: poitely@amc.edu.
Paolo E. Forni, Email: pforni@albany.edu.
Data Availability Statement
Single‐cell RNA sequencing data sets used for analysis in this study have been uploaded and are available on the Gene Expression Omnibus (GEO) database, under GEO. Accession number GSE286491 (https://www.ncbi.nlm.nih.gov/geo/query/acc.cgi?acc=GSE286491).
References
- Aguillon, R. , Batut J., Subramanian A., et al. 2018. “Cell‐Type Heterogeneity in the Early Zebrafish Olfactory Epithelium Is Generated From Progenitors Within Preplacodal Ectoderm.” eLife 7: e32041. 10.7554/eLife.32041. [DOI] [PMC free article] [PubMed] [Google Scholar]
- Amato, E., Jr. , Taroc E. Z. M., and Forni P. E.. 2024. “Illuminating the Terminal Nerve: Uncovering the Link Between GnRH‐1 Neuron and Olfactory Development.” Journal of Comparative Neurology 532, no. 3: e25599. 10.1002/cne.25599. [DOI] [PMC free article] [PubMed] [Google Scholar]
- Aoki, Y. , Saint‐Germain N., Gyda M., et al. 2003. “Sox10 Regulates the Development of Neural Crest‐Derived Melanocytes in Xenopus.” Developmental Biology 259, no. 1: 19–33. 10.1016/s0012-1606(03)00161-1. [DOI] [PubMed] [Google Scholar]
- Assinck, P. , Duncan G. J., Hilton B. J., Plemel J. R., and Tetzlaff W.. 2017. “Cell Transplantation Therapy for Spinal Cord Injury.” Nature Neuroscience 20, no. 5: 637–647. 10.1038/nn.4541. [DOI] [PubMed] [Google Scholar]
- Barber, P. C. , and Lindsay R. M.. 1982. “Schwann Cells of the Olfactory Nerves Contain Glial Fibrillary Acidic Protein and Resemble Astrocytes.” Neuroscience 7, no. 12: 3077–3090. 10.1016/0306-4522(82)90231-7. [DOI] [PubMed] [Google Scholar]
- Barraud, P. , Seferiadis A. A., Tyson L. D., et al. 2010. “Neural Crest Origin of Olfactory Ensheathing Glia.” Proceedings of the National Academy of Sciences of the United States of America 107, no. 49: 21040–21045. 10.1073/pnas.1012248107. [DOI] [PMC free article] [PubMed] [Google Scholar]
- Barraud, P. , St John J. A., Stolt C. C., Wegner M., and Baker C. V.. 2013. “Olfactory Ensheathing Glia Are Required for Embryonic Olfactory Axon Targeting and the Migration of Gonadotropin‐Releasing Hormone Neurons.” Biology Open 2, no. 7: 750–759. 10.1242/bio.20135249. [DOI] [PMC free article] [PubMed] [Google Scholar]
- Belin, S. , Zuloaga K. L., and Poitelon Y.. 2017. “Influence of Mechanical Stimuli on Schwann Cell Biology.” Frontiers in Cellular Neuroscience 11: 347. 10.3389/fncel.2017.00347. [DOI] [PMC free article] [PubMed] [Google Scholar]
- Bergen, V. , Lange M., Peidli S., Wolf F. A., and Theis F. J.. 2020. “Generalizing RNA Velocity to Transient Cell States Through Dynamical Modeling.” Nature Biotechnology 38, no. 12: 1408–1414. 10.1038/s41587-020-0591-3. [DOI] [PubMed] [Google Scholar]
- Britsch, S. , Goerich D. E., Riethmacher D., et al. 2001. “The Transcription Factor Sox10 Is a Key Regulator of Peripheral Glial Development.” Genes & Development 15, no. 1: 66–78. 10.1101/gad.186601. [DOI] [PMC free article] [PubMed] [Google Scholar]
- Cau, E. , Gradwohl G., Fode C., and Guillemot F.. 1997. “Mash1 Activates a Cascade of bHLH Regulators in Olfactory Neuron Progenitors.” Development 124, no. 8: 1611–1621. http://www.ncbi.nlm.nih.gov/pubmed/9108377. [DOI] [PubMed] [Google Scholar]
- Chuah, M. I. , and Au C.. 1991. “Olfactory Schwann Cells Are Derived From Precursor Cells in the Olfactory Epithelium.” Journal of Neuroscience Research 29, no. 2: 172–180. 10.1002/jnr.490290206. [DOI] [PubMed] [Google Scholar]
- Cobbaut, M. , Karagil S., Bruno L., et al. 2020. “Dysfunctional Mechanotransduction Through the YAP/TAZ/Hippo Pathway as a Feature of Chronic Disease.” Cells 9, no. 1: 151. 10.3390/cells9010151. [DOI] [PMC free article] [PubMed] [Google Scholar]
- Couly, G. F. , and Le Douarin N. M.. 1985. “Mapping of the Early Neural Primordium in Quail‐Chick Chimeras. I. Developmental Relationships Between Placodes, Facial Ectoderm, and Prosencephalon.” Developmental Biology 110, no. 2: 422–439. 10.1016/0012-1606(85)90101-0. [DOI] [PubMed] [Google Scholar]
- Danielian, P. S. , Muccino D., Rowitch D. H., Michael S. K., and McMahon A. P.. 1998. “Modification of Gene Activity in Mouse Embryos In Utero by a Tamoxifen‐Inducible Form of Cre Recombinase.” Current Biology 8, no. 24: 1323–1326. 10.1016/s0960-9822(07)00562-3. [DOI] [PubMed] [Google Scholar]
- DeLucia, T. A. , Conners J. J., Brown T. J., Cronin C. M., Khan T., and Jones K. J.. 2003. “Use of a Cell Line to Investigate Olfactory Ensheathing Cell‐Enhanced Axonal Regeneration.” Anatomical Record. Part B, New Anatomist 271, no. 1: 61–70. 10.1002/ar.b.10014. [DOI] [PubMed] [Google Scholar]
- Deng, Y. , Wu L. M. N., Bai S., et al. 2017. “A Reciprocal Regulatory Loop Between TAZ/YAP and G‐Protein Galphas Regulates Schwann Cell Proliferation and Myelination.” Nature Communications 8: 15161. 10.1038/ncomms15161. [DOI] [PMC free article] [PubMed] [Google Scholar]
- Dietz, A. , Senf K., and Neuhaus E. M.. 2025. “Stem Cell Expression of CXCR4 Regulates Tissue Composition in the Vomeronasal Organ.” Journal of Cell Science 138, no. 1: jcs263451. 10.1242/jcs.263451. [DOI] [PMC free article] [PubMed] [Google Scholar]
- Doucette, J. R. 1984. “The Glial Cells in the Nerve Fiber Layer of the Rat Olfactory Bulb.” Anatomical Record: Advances in Integrative Anatomy and Evolutionary Biology 210, no. 2: 385–391. 10.1002/ar.1092100214. [DOI] [PubMed] [Google Scholar]
- Erickson, A. G. , Kameneva P., and Adameyko I.. 2023. “The Transcriptional Portraits of the Neural Crest at the Individual Cell Level.” Seminars in Cell & Developmental Biology 138: 68–80. 10.1016/j.semcdb.2022.02.017. [DOI] [PMC free article] [PubMed] [Google Scholar]
- Farbman, A. I. , and Margolis F. L.. 1980. “Olfactory Marker Protein During Ontogeny: Immunohistochemical Localization.” Developmental Biology 74, no. 1: 205–215. 10.1016/0012-1606(80)90062-7. [DOI] [PubMed] [Google Scholar]
- Forni, P. E. , Bharti K., Flannery E. M., Shimogori T., and Wray S.. 2013. “The Indirect Role of Fibroblast Growth Factor‐8 in Defining Neurogenic Niches of the Olfactory/GnRH Systems.” Journal of Neuroscience 33, no. 50: 19620–19634. 10.1523/JNEUROSCI.3238-13.2013. [DOI] [PMC free article] [PubMed] [Google Scholar]
- Forni, P. E. , Taylor‐Burds C., Melvin V. S., Williams T., and Wray S.. 2011. “Neural Crest and Ectodermal Cells Intermix in the Nasal Placode to Give Rise to GnRH‐1 Neurons, Sensory Neurons, and Olfactory Ensheathing Cells.” Journal of Neuroscience 31, no. 18: 6915–6927. 10.1523/JNEUROSCI.6087-10.2011. [DOI] [PMC free article] [PubMed] [Google Scholar]
- Forni, P. E. , and Wray S.. 2015. “GnRH, Anosmia and Hypogonadotropic Hypogonadism—Where Are We?” Frontiers in Neuroendocrinology 36: 165–177. 10.1016/j.yfrne.2014.09.004. [DOI] [PMC free article] [PubMed] [Google Scholar]
- Franklin, R. J. , and Barnett S. C.. 2000. “Olfactory Ensheathing Cells and CNS Regeneration: The Sweet Smell of Success?” Neuron 28, no. 1: 15–18. 10.1016/s0896-6273(00)00080-5. [DOI] [PubMed] [Google Scholar]
- Gandhi, S. , Du E. J., Pangilinan E. S., and Harland R. M.. 2024. “The Wnt1‐Cre2 Transgene Causes Aberrant Recombination in Non‐Neural Crest Cell Types.” bioRxiv. 10.1101/2024.11.06.622365. [DOI] [Google Scholar]
- Goulart, C. O. , Angelo Durco D. F., de Carvalho L. A., et al. 2016. “Olfactory Ensheathing Glia Cell Therapy and Tubular Conduit Enhance Nerve Regeneration After Mouse Sciatic Nerve Transection.” Brain Research 1650: 243–251. 10.1016/j.brainres.2016.09.021. [DOI] [PubMed] [Google Scholar]
- Gross, S. J. , Webb A. M., Peterlin A. D., et al. 2021. “Notch Regulates Vascular Collagen IV Basement Membrane Through Modulation of Lysyl Hydroxylase 3 Trafficking.” Angiogenesis 24, no. 4: 789–805. 10.1007/s10456-021-09791-9. [DOI] [PMC free article] [PubMed] [Google Scholar]
- Grove, M. , Kim H., Santerre M., et al. 2017. “YAP/TAZ Initiate and Maintain Schwann Cell Myelination.” eLife 6: e20982. 10.7554/eLife.20982. [DOI] [PMC free article] [PubMed] [Google Scholar]
- Grove, M. , Lee H., Zhao H., and Son Y. J.. 2020. “Axon‐Dependent Expression of YAP/TAZ Mediates Schwann Cell Remyelination but Not Proliferation After Nerve Injury.” eLife 9: e50138. 10.7554/eLife.50138. [DOI] [PMC free article] [PubMed] [Google Scholar]
- Gu, M. , Gao Z., Li X., et al. 2017. “Conditioned Medium of Olfactory Ensheathing Cells Promotes the Functional Recovery and Axonal Regeneration After Contusive Spinal Cord Injury.” Brain Research 1654: 43–54. 10.1016/j.brainres.2016.10.023. [DOI] [PubMed] [Google Scholar]
- Guerout, N. , Derambure C., Drouot L., et al. 2010. “Comparative Gene Expression Profiling of Olfactory Ensheathing Cells From Olfactory Bulb and Olfactory Mucosa.” Glia 58, no. 13: 1570–1580. 10.1002/glia.21030. [DOI] [PubMed] [Google Scholar]
- Halim, D. , Hofstra R. M. W., Signorile L., et al. 2015. “ACTG2 Variants Impair Actin Polymerization in Sporadic Megacystis Microcolon Intestinal Hypoperistalsis Syndrome.” Human Molecular Genetics 25, no. 3: 571–583. 10.1093/hmg/ddv497. [DOI] [PubMed] [Google Scholar]
- Hao, Y. , Stuart T., Kowalski M. H., et al. 2024. “Dictionary Learning for Integrative, Multimodal and Scalable Single‐Cell Analysis.” Nature Biotechnology 42, no. 2: 293–304. 10.1038/s41587-023-01767-y. [DOI] [PMC free article] [PubMed] [Google Scholar]
- Hillmer, R. E. , and Link B. A.. 2019. “The Roles of Hippo Signaling Transducers Yap and Taz in Chromatin Remodeling.” Cells 8, no. 5: 502. 10.3390/cells8050502. [DOI] [PMC free article] [PubMed] [Google Scholar]
- Hills, M. H. , Ma L., Fang A., et al. 2024. “Molecular, Cellular, and Developmental Organization of the Mouse Vomeronasal Organ at Single Cell Resolution.” eLife 13: RP97356. 10.7554/eLife.97356. [DOI] [PMC free article] [PubMed] [Google Scholar]
- Hinz, B. , Celetta G., Tomasek J. J., Gabbiani G., and Chaponnier C.. 2001. “Alpha‐Smooth Muscle Actin Expression Upregulates Fibroblast Contractile Activity.” Molecular Biology of the Cell 12, no. 9: 2730–2741. 10.1091/mbc.12.9.2730. [DOI] [PMC free article] [PubMed] [Google Scholar]
- Hong, J. , Kirkland J. M., Acheta J., et al. 2024. “YAP and TAZ Regulate Remyelination in the Central Nervous System.” Glia 72, no. 1: 156–166. 10.1002/glia.24467. [DOI] [PMC free article] [PubMed] [Google Scholar]
- Honore, S. M. , Aybar M. J., and Mayor R.. 2003. “Sox10 Is Required for the Early Development of the Prospective Neural Crest in Xenopus Embryos.” Developmental Biology 260, no. 1: 79–96. 10.1016/s0012-1606(03)00247-1. [DOI] [PubMed] [Google Scholar]
- Huang, H. Y. , Xiong M. J., Pu F. Q., Liao J. X., Zhu F. Q., and Zhang W. J.. 2024. “Application and Challenges of Olfactory Ensheathing Cells in Clinical Trials of Spinal Cord Injury.” European Journal of Pharmacology 963: 176238. 10.1016/j.ejphar.2023.176238. [DOI] [PubMed] [Google Scholar]
- Hummel, T. , and Frasnelli J.. 2019. “Intranasal Trigeminal System.” Handbook of Clinical Neurology 164: 119–134. 10.1016/B978-0-444-63855-7.00008-3. [DOI] [PubMed] [Google Scholar]
- Jacobs, L. F. 2019. “The Navigational Nose: A New Hypothesis for the Function of the Human External Pyramid.” Journal of Experimental Biology 222, no. Pt Suppl 1: jeb186924. 10.1242/jeb.186924. [DOI] [PubMed] [Google Scholar]
- Jacques‐Fricke, B. T. , Roffers‐Agarwal J., and Gammill L. S.. 2012. “DNA Methyltransferase 3b Is Dispensable for Mouse Neural Crest Development.” PLoS One 7, no. 10: e47794. 10.1371/journal.pone.0047794. [DOI] [PMC free article] [PubMed] [Google Scholar]
- Jafarinia, H. , Khalilimeybodi A., Barrasa‐Fano J., Fraley S. I., Rangamani P., and Carlier A.. 2024. “Insights Gained From Computational Modeling of YAP/TAZ Signaling for Cellular Mechanotransduction.” Npj Systems Biology and Applications 10, no. 1: 90. 10.1038/s41540-024-00414-9. [DOI] [PMC free article] [PubMed] [Google Scholar]
- Jeanette, H. , Marziali L. N., Bhatia U., et al. 2021. “YAP and TAZ Regulate Schwann Cell Proliferation and Differentiation During Peripheral Nerve Regeneration.” Glia 69, no. 4: 1061–1074. 10.1002/glia.23949. [DOI] [PMC free article] [PubMed] [Google Scholar]
- Jessen, K. R. , and Mirsky R.. 2005. “The Origin and Development of Glial Cells in Peripheral Nerves.” Nature Reviews Neuroscience 6, no. 9: 671–682. [DOI] [PubMed] [Google Scholar]
- Jessen, K. R. , and Mirsky R.. 2019. “Schwann Cell Precursors; Multipotent Glial Cells in Embryonic Nerves.” Frontiers in Molecular Neuroscience 12: 69. 10.3389/fnmol.2019.00069. [DOI] [PMC free article] [PubMed] [Google Scholar]
- Kastriti, M. E. , Faure L., Von Ahsen D., et al. 2022. “Schwann Cell Precursors Represent a Neural Crest‐Like State With Biased Multipotency.” EMBO Journal 41, no. 17: e108780. 10.15252/embj.2021108780. [DOI] [PMC free article] [PubMed] [Google Scholar]
- Katoh, H. , Shibata S., Fukuda K., et al. 2011. “The Dual Origin of the Peripheral Olfactory System: Placode and Neural Crest.” Molecular Brain 4: 34. 10.1186/1756-6606-4-34. [DOI] [PMC free article] [PubMed] [Google Scholar]
- Katreddi, R. R. , and Forni P. E.. 2021. “Mechanisms Underlying Pre‐ and Postnatal Development of the Vomeronasal Organ.” Cellular and Molecular Life Sciences 78, no. 12: 5069–5082. 10.1007/s00018-021-03829-3. [DOI] [PMC free article] [PubMed] [Google Scholar]
- Khankan, R. R. , Griffis K. G., Haggerty‐Skeans J. R., et al. 2016. “Olfactory Ensheathing Cell Transplantation After a Complete Spinal Cord Transection Mediates Neuroprotective and Immunomodulatory Mechanisms to Facilitate Regeneration.” Journal of Neuroscience 36, no. 23: 6269–6286. 10.1523/JNEUROSCI.0085-16.2016. [DOI] [PMC free article] [PubMed] [Google Scholar]
- Kim, E. J. , Leung C. T., Reed R. R., and Johnson J. E.. 2007. “In Vivo Analysis of Ascl1 Defined Progenitors Reveals Distinct Developmental Dynamics During Adult Neurogenesis and Gliogenesis.” Journal of Neuroscience 27, no. 47: 12764–12774. 10.1523/JNEUROSCI.3178-07.2007. [DOI] [PMC free article] [PubMed] [Google Scholar]
- Kishore, U. , Thielens N. M., and Gaboriaud C.. 2016. “Editorial: State‐Of‐The‐Art Research on C1q and the Classical Complement Pathway.” Frontiers in Immunology 7: 398. 10.3389/fimmu.2016.00398. [DOI] [PMC free article] [PubMed] [Google Scholar]
- Koontz, A. , Urrutia H. A., and Bronner M. E.. 2022. “Retroviral Lineage Analysis Reveals Dual Contribution From Ectodermal Placodes and Neural Crest Cells to Avian Olfactory Sensory and GnRH Neurons.” Natural Sciences 2, no. 3: e20210037. 10.1002/ntls.20210037. [DOI] [PMC free article] [PubMed] [Google Scholar]
- Krämer, A. , Green J., Pollard J. Jr., and Tugendreich S.. 2013. “Causal Analysis Approaches in Ingenuity Pathway Analysis.” Bioinformatics 30, no. 4: 523–530. 10.1093/bioinformatics/btt703. [DOI] [PMC free article] [PubMed] [Google Scholar]
- LaMantia, A. S. , Bhasin N., Rhodes K., and Heemskerk J.. 2000. “Mesenchymal/Epithelial Induction Mediates Olfactory Pathway Formation.” Neuron 28, no. 2: 411–425. https://www.ncbi.nlm.nih.gov/pubmed/11144352. [DOI] [PubMed] [Google Scholar]
- Lewis, A. E. , Vasudevan H. N., O'Neill A. K., Soriano P., and Bush J. O.. 2013. “The Widely Used Wnt1‐Cre Transgene Causes Developmental Phenotypes by Ectopic Activation of Wnt Signaling.” Developmental Biology 379, no. 2: 229–234. 10.1016/j.ydbio.2013.04.026. [DOI] [PMC free article] [PubMed] [Google Scholar]
- Lin, J. M. , Mitchell T. A., Rothstein M., et al. 2022. “Sociosexual Behavior Requires Both Activating and Repressive Roles of Tfap2e/AP‐2epsilon in Vomeronasal Sensory Neurons.” eLife 11: e77259. 10.7554/eLife.77259. [DOI] [PMC free article] [PubMed] [Google Scholar]
- Lin, J. M. , Taroc E. Z. M., Frias J. A., et al. 2018. “The Transcription Factor Tfap2e/AP‐2epsilon Plays a Pivotal Role in Maintaining the Identity of Basal Vomeronasal Sensory Neurons.” Developmental Biology 441, no. 1: 67–82. 10.1016/j.ydbio.2018.06.007. [DOI] [PubMed] [Google Scholar]
- Liu, Z. , Jin Y. Q., Chen L., et al. 2015. “Specific Marker Expression and Cell State of Schwann Cells During Culture In Vitro.” PLoS One 10, no. 4: e0123278. 10.1371/journal.pone.0123278. [DOI] [PMC free article] [PubMed] [Google Scholar]
- Ma, Y. H. , Zhang Y., Cao L., et al. 2010. “Effect of Neurotrophin‐3 Genetically Modified Olfactory Ensheathing Cells Transplantation on Spinal Cord Injury.” Cell Transplantation 19, no. 2: 167–177. 10.3727/096368910X492634. [DOI] [PubMed] [Google Scholar]
- Madisen, L. , Zwingman T. A., Sunkin S. M., et al. 2010. “A Robust and High‐Throughput Cre Reporting and Characterization System for the Whole Mouse Brain.” Nature Neuroscience 13, no. 1: 133–140. 10.1038/nn.2467. [DOI] [PMC free article] [PubMed] [Google Scholar]
- Manderfield, L. J. , Engleka K. A., Aghajanian H., et al. 2015. “Pax3 and Hippo Signaling Coordinate Melanocyte Gene Expression in Neural Crest.” Cell Reports 10, no. 5: 841. 10.1016/j.celrep.2015.01.041. [DOI] [PubMed] [Google Scholar]
- Manderfield, L. J. , Engleka K. A., Aghajanian H., et al. 2014. “Pax3 and Hippo Signaling Coordinate Melanocyte Gene Expression in Neural Crest.” Cell Reports 9, no. 5: 1885–1895. 10.1016/j.celrep.2014.10.061. [DOI] [PMC free article] [PubMed] [Google Scholar]
- Manning, S. A. , Kroeger B., and Harvey K. F.. 2020. “The Regulation of Yorkie, YAP and TAZ: New Insights Into the Hippo Pathway.” Development 147, no. 8: dev179069. 10.1242/dev.179069. [DOI] [PubMed] [Google Scholar]
- Matsuoka, T. , Ahlberg P. E., Kessaris N., et al. 2005. “Neural Crest Origins of the Neck and Shoulder.” Nature 436, no. 7049: 347–355. 10.1038/nature03837. [DOI] [PMC free article] [PubMed] [Google Scholar]
- Miedzybrodzki, R. , Tabakow P., Fortuna W., Czapiga B., and Jarmundowicz W.. 2006. “The Olfactory Bulb and Olfactory Mucosa Obtained From Human Cadaver Donors as a Source of Olfactory Ensheathing Cells.” Glia 54, no. 6: 557–565. 10.1002/glia.20395. [DOI] [PubMed] [Google Scholar]
- Muller, W. A. , Ratti C. M., McDonnell S. L., and Cohn Z. A.. 1989. “A Human Endothelial Cell‐Restricted, Externally Disposed Plasmalemmal Protein Enriched in Intercellular Junctions.” Journal of Experimental Medicine 170, no. 2: 399–414. 10.1084/jem.170.2.399. [DOI] [PMC free article] [PubMed] [Google Scholar]
- Munoz, W. A. , and Trainor P. A.. 2015. “Neural Crest Cell Evolution: How and When Did a Neural Crest Cell Become a Neural Crest Cell.” Current Topics in Developmental Biology 111: 3–26. 10.1016/bs.ctdb.2014.11.001. [DOI] [PubMed] [Google Scholar]
- Murdoch, B. , DelConte C., and Garcia‐Castro M. I.. 2010. “Embryonic Pax7‐Expressing Progenitors Contribute Multiple Cell Types to the Postnatal Olfactory Epithelium.” Journal of Neuroscience 30, no. 28: 9523–9532. 10.1523/JNEUROSCI.0867-10.2010. [DOI] [PMC free article] [PubMed] [Google Scholar]
- Murdoch, B. , DelConte C., and Garcia‐Castro M. I.. 2012. “Pax7 Lineage Contributions to the Mammalian Neural Crest.” PLoS One 7, no. 7: e41089. 10.1371/journal.pone.0041089. [DOI] [PMC free article] [PubMed] [Google Scholar]
- Naik, A. S. , Lin J. M., Taroc E. Z. M., et al. 2020. “Smad4‐Dependent Morphogenic Signals Control the Maturation and Axonal Targeting of Basal Vomeronasal Sensory Neurons to the Accessory Olfactory Bulb.” Development 147, no. 8: dev184036. 10.1242/dev.184036. [DOI] [PMC free article] [PubMed] [Google Scholar]
- Perera, S. N. , Williams R. M., Lyne R., et al. 2020. “Insights Into Olfactory Ensheathing Cell Development From a Laser‐Microdissection and Transcriptome‐Profiling Approach.” Glia 68, no. 12: 2550–2584. 10.1002/glia.23870. [DOI] [PMC free article] [PubMed] [Google Scholar]
- Pingault, V. , Bodereau V., Baral V., et al. 2013. “Loss‐Of‐Function Mutations in SOX10 Cause Kallmann Syndrome With Deafness.” American Journal of Human Genetics 92, no. 5: 707–724. 10.1016/j.ajhg.2013.03.024. [DOI] [PMC free article] [PubMed] [Google Scholar]
- Pingault, V. , Bondurand N., Kuhlbrodt K., et al. 1998. “SOX10 Mutations in Patients With Waardenburg‐Hirschsprung Disease.” Nature Genetics 18, no. 2: 171–173. 10.1038/ng0298-171. [DOI] [PubMed] [Google Scholar]
- Poitelon, Y. , Lopez‐Anido C., Catignas K., et al. 2016. “YAP and TAZ Control Peripheral Myelination and the Expression of Laminin Receptors in Schwann Cells.” Nature Neuroscience 19, no. 7: 879–887. 10.1038/nn.4316. [DOI] [PMC free article] [PubMed] [Google Scholar]
- Raisman, G. 2001. “Olfactory Ensheathing Cells ‐ Another Miracle Cure for Spinal Cord Injury?” Nature Reviews. Neuroscience 2, no. 5: 369–375. 10.1038/35072576. [DOI] [PubMed] [Google Scholar]
- Ramon‐Cueto, A. , Plant G. W., Avila J., and Bunge M. B.. 1998. “Long‐Distance Axonal Regeneration in the Transected Adult Rat Spinal Cord Is Promoted by Olfactory Ensheathing Glia Transplants.” Journal of Neuroscience 18, no. 10: 3803–3815. 10.1523/JNEUROSCI.18-10-03803.1998. [DOI] [PMC free article] [PubMed] [Google Scholar]
- Reginensi, A. , Scott R. P., Gregorieff A., et al. 2013. “Yap‐ and Cdc42‐Dependent Nephrogenesis and Morphogenesis During Mouse Kidney Development.” PLoS Genetics 9, no. 3: e1003380. 10.1371/journal.pgen.1003380. [DOI] [PMC free article] [PubMed] [Google Scholar]
- Rich, C. A. , Perera S. N., Andratschke J., et al. 2018. “Olfactory Ensheathing Cells Abutting the Embryonic Olfactory Bulb Express Frzb, Whose Deletion Disrupts Olfactory Axon Targeting.” Glia 66, no. 12: 2617–2631. 10.1002/glia.23515. [DOI] [PMC free article] [PubMed] [Google Scholar]
- Riddell, J. S. , Enriquez‐Denton M., Toft A., Fairless R., and Barnett S. C.. 2004. “Olfactory Ensheathing Cell Grafts Have Minimal Influence on Regeneration at the Dorsal Root Entry Zone Following Rhizotomy.” Glia 47, no. 2: 150–167. 10.1002/glia.20041. [DOI] [PubMed] [Google Scholar]
- Rogg, M. , Maier J. I., Helmstadter M., et al. 2023. “A YAP/TAZ‐ARHGAP29‐RhoA Signaling Axis Regulates Podocyte Protrusions and Integrin Adhesions.” Cells 12, no. 13: 1795. 10.3390/cells12131795. [DOI] [PMC free article] [PubMed] [Google Scholar]
- Rognoni, E. , and Walko G.. 2019. “The Roles of YAP/TAZ and the Hippo Pathway in Healthy and Diseased Skin.” Cells 8, no. 5: 411. 10.3390/cells8050411. [DOI] [PMC free article] [PubMed] [Google Scholar]
- Roskams, A. J. , Cai X., and Ronnett G. V.. 1998. “Expression of Neuron‐Specific Beta‐III Tubulin During Olfactory Neurogenesis in the Embryonic and Adult Rat.” Neuroscience 83, no. 1: 191–200. http://www.ncbi.nlm.nih.gov/pubmed/9466409. [DOI] [PubMed] [Google Scholar]
- Saxena, A. , Peng B. N., and Bronner M. E.. 2013. “Sox10‐Dependent Neural Crest Origin of Olfactory Microvillous Neurons in Zebrafish.” eLife 2: e00336. 10.7554/eLife.00336. [DOI] [PMC free article] [PubMed] [Google Scholar]
- Smith, K. E. , Whitcroft K., Law S., Andrews P., Choi D., and Jagger D. J.. 2020. “Olfactory Ensheathing Cells From the Nasal Mucosa and Olfactory Bulb Have Distinct Membrane Properties.” Journal of Neuroscience Research 98, no. 5: 888–901. 10.1002/jnr.24566. [DOI] [PubMed] [Google Scholar]
- Soldatov, R. , Kaucka M., Kastriti M. E., et al. 2019. “Spatiotemporal Structure of Cell Fate Decisions in Murine Neural Crest.” Science 364, no. 6444: eaas9536. 10.1126/science.aas9536. [DOI] [PubMed] [Google Scholar]
- Stierli, S. , and Sommer L.. 2022. “Schwann Cell Precursors: A Hub of Neural Crest Development.” EMBO Journal 41, no. 17: e111955. 10.15252/embj.2022111955. [DOI] [PMC free article] [PubMed] [Google Scholar]
- Taïb, S. , Lamandé N., Martin S., Coulpier F., Topilko P., and Brunet I.. 2022. “Myelinating Schwann Cells and Netrin‐1 Control Intra‐Nervous Vascularization of the Developing Mouse Sciatic Nerve.” eLife 11: e64773. 10.7554/eLife.64773. [DOI] [PMC free article] [PubMed] [Google Scholar]
- Taroc, E. Z. M. , Katreddi R. R., and Forni P. E.. 2020. “Identifying Isl1 Genetic Lineage in the Developing Olfactory System and in GnRH‐1 Neurons.” Frontiers in Physiology 11: 601923. 10.3389/fphys.2020.601923. [DOI] [PMC free article] [PubMed] [Google Scholar]
- Taroc, E. Z. M. , Lin J. M., Tulloch A. J., Jaworski A., and Forni P. E.. 2019. “GnRH‐1 Neural Migration From the Nose to the Brain Is Independent From Slit2, Robo3 and NELL2 Signaling.” Frontiers in Cellular Neuroscience 13: 70. 10.3389/fncel.2019.00070. [DOI] [PMC free article] [PubMed] [Google Scholar]
- Taroc, E. Z. M. , Naik A. S., Lin J. M., et al. 2020. “Gli3 Regulates Vomeronasal Neurogenesis, Olfactory Ensheathing Cell Formation, and GnRH‐1 Neuronal Migration.” Journal of Neuroscience 40, no. 2: 311–326. 10.1523/JNEUROSCI.1977-19.2019. [DOI] [PMC free article] [PubMed] [Google Scholar]
- Taroc, E. Z. M. , Prasad A., Lin J. M., and Forni P. E.. 2017. “The Terminal Nerve Plays a Prominent Role in GnRH‐1 Neuronal Migration Independent From Proper Olfactory and Vomeronasal Connections to the Olfactory Bulbs.” Biology Open 6, no. 10: 1552–1568. 10.1242/bio.029074. [DOI] [PMC free article] [PubMed] [Google Scholar]
- Tremblay, C. , and Frasnelli J.. 2018. “Olfactory and Trigeminal Systems Interact in the Periphery.” Chemical Senses 43, no. 8: 611–616. 10.1093/chemse/bjy049. [DOI] [PubMed] [Google Scholar]
- Ulusoy, S. , Bayar Muluk N., Scadding G. K., et al. 2022. “The Intranasal Trigeminal System: Roles in Rhinitis (Allergic and Non‐Allergic).” European Review for Medical and Pharmacological Sciences 26, no. 2 Suppl: 25–37. 10.26355/eurrev_202212_30479. [DOI] [PubMed] [Google Scholar]
- Vassilev, A. , Kaneko K. J., Shu H., Zhao Y., and DePamphilis M. L.. 2001. “TEAD/TEF Transcription Factors Utilize the Activation Domain of YAP65, a Src/Yes‐Associated Protein Localized in the Cytoplasm.” Genes & Development 15, no. 10: 1229–1241. 10.1101/gad.888601. [DOI] [PMC free article] [PubMed] [Google Scholar]
- Visel, A. , Thaller C., and Eichele G.. 2004. “GenePaint.Org: An Atlas of Gene Expression Patterns in the Mouse Embryo.” Nucleic Acids Research 32, no. Database issue: D552–D556. 10.1093/nar/gkh029. [DOI] [PMC free article] [PubMed] [Google Scholar]
- Wang, J. , Xiao Y., Hsu C. W., et al. 2016. “Yap and Taz Play a Crucial Role in Neural Crest‐Derived Craniofacial Development.” Development 143, no. 3: 504–515. 10.1242/dev.126920. [DOI] [PMC free article] [PubMed] [Google Scholar]
- Wang, X. , Jiang C., Zhang Y., et al. 2022. “The Promoting Effects of Activated Olfactory Ensheathing Cells on Angiogenesis After Spinal Cord Injury Through the PI3K/Akt Pathway.” Cell & Bioscience 12, no. 1: 23. 10.1186/s13578-022-00765-y. [DOI] [PMC free article] [PubMed] [Google Scholar]
- Whitlock, K. E. 2004. “A New Model for Olfactory Placode Development.” Brain, Behavior and Evolution 64, no. 3: 126–140. 10.1159/000079742. [DOI] [PubMed] [Google Scholar]
- Wray, S. , Grant P., and Gainer H.. 1989. “Evidence That Cells Expressing Luteinizing Hormone‐Releasing Hormone mRNA in the Mouse Are Derived From Progenitor Cells in the Olfactory Placode.” Proceedings of the National Academy of Sciences of the United States of America 86, no. 20: 8132–8136. http://www.ncbi.nlm.nih.gov/pubmed/2682637. [DOI] [PMC free article] [PubMed] [Google Scholar]
- Xie, M. , Kamenev D., Kaucka M., et al. 2019. “Schwann Cell Precursors Contribute to Skeletal Formation During Embryonic Development in Mice and Zebrafish.” Proceedings of the National Academy of Sciences of the United States of America 116, no. 30: 15068–15073. 10.1073/pnas.1900038116. [DOI] [PMC free article] [PubMed] [Google Scholar]
- Zhang, L. , Ren F., Zhang Q., Chen Y., Wang B., and Jiang J.. 2008. “The TEAD/TEF Family of Transcription Factor Scalloped Mediates Hippo Signaling in Organ Size Control.” Developmental Cell 14, no. 3: 377–387. 10.1016/j.devcel.2008.01.006. [DOI] [PMC free article] [PubMed] [Google Scholar]
- Zhou, X. , Li W. W., Wu Q. Y., Yu M. M., and Xia X. Y.. 2017. “Kallmann Syndrome With Deafness Caused by SOX10 Mutation: Advances in Research.” Zhonghua Nan Ke Xue 23, no. 9: 838–841. https://www.ncbi.nlm.nih.gov/pubmed/29726667. [PubMed] [Google Scholar]
Associated Data
This section collects any data citations, data availability statements, or supplementary materials included in this article.
Supplementary Materials
Figure S1. Sox10‐CreTg/Ai14 mice tracing in postnatal mice reveals traced neurons in the central olfactory epithelium and vomeronasal organ. (A–B‴) P0 Sox10‐CreTg/Ai14 immunofluorescence against neuronal marker Tub III (tubulin III, green), anti‐tdTomato (red) and DAPI (blue) in the main olfactory epithelium (MOE). Recombination highlights neurons (Ns) positive for Tub III (arrows) and Bowman’s glands (BG). (C–C″) Immunofluorescent staining against the olfactory neuron marker OMP (olfactory marker protein, green) and anti‐tdTomato (red) reveals traced neurons expressing OMP. (D–E‴) Double immunofluorescent staining anti OMP and tdTomato within the VNO. Recombination can be observed in neurons positive for OMP and OMP negative pericytes (PCs) surrounding the vasculature.
Figure S2. Disrupted ratio of OMP+ Neurons to Gap43+ Neurons in the olfactory epithelium in Sox10Cre/YapFlx/WT;TazFlx/Flx animals. Immunofluorescence anti‐OMP (green) and GAP43 (red) in (A, A′) controls and (B, B′) Sox10 Cre/YapFlx/WT; TazFlx/Flx mutants at P23. (C) Quantification of the OMP to GAP43 ratio (n = 3, unpaired t‐test p = 0.045). Scale bars in (A, B), 100 μm; (A′–B′), 50 μm.
Figure S3. Reduction in number of Pecam1+ Vasculature in the OE and VNO of Sox10Cre/YapFlx/WT;TazFlx/Flx animals. (A, B) Pecam1 immunohistochemistry labels the vasculature intrusions (arrows) within the vomeronsal organ (VNO) of YapFlx/Flx; TazFlx/Flx controls and Sox10 Cre/YapFlx/WT; TazFlx/Flx mutants at P23. (C) Quantification of the number of vasculature intrusions within mutant VNOs compared to control VNOs (+/− SEM, n = 3; p = 0.014; Unpaired T‐test). (D, E) Pecam1 highlights the vasculature surrounding the olfactory epithelium (OE) in both YapFlx/Flx; TazFlx/Flx and Sox10 Cre/YapFlx/WT; TazFlx/Flx mutants at P23. (F) Quantification of the number of vessels per 100 μm in mutants compared to controls (+/− SEM, n = 6; p = 0.000003; Unpaired t‐test).
Table S1. Differential Gene Expression of Immature Schwann Cell cluster between YapcHets/TazcKOs and control.
Table S2. Differential Gene Expression of Melanocytes cluster between YapcHets/TazcKOs and control.
Table S3. Differential Gene Expression of Olfactory Ensheathing Cell cluster between YapcHets/TazcKOs and control.
Table S4. Differential Gene Expression of Schwann Cell cluster between YapcHets/TazcKOs and control.
Table S5. Differential Gene Expression of Schwann Cell Precursor cluster between YapcHets/TazcKOs and control.
Table S6. Ingenuity Canonical Pathway Analysis of Immature Schwann Cell cluster between YapcHets/TazcKOs and control.
Table S7. Ingenuity Canonical Pathway Analysis of Melanocytes cluster between YapcHets/TazcKOs and control.
Table S8. Ingenuity Canonical Pathway Analysis of Olfactory Ensheathing Cell cluster between YapcHets/TazcKOs and control.
Table S9. Ingenuity Canonical Pathway Analysis of Schwann Cell cluster between YapcHets/TazcKOs and control.
Table S10. Ingenuity Canonical Pathway Analysis of Schwann Cell Precursor cluster between YapcHets/TazcKOs and control.
Data Availability Statement
Single‐cell RNA sequencing data sets used for analysis in this study have been uploaded and are available on the Gene Expression Omnibus (GEO) database, under GEO. Accession number GSE286491 (https://www.ncbi.nlm.nih.gov/geo/query/acc.cgi?acc=GSE286491).