

Abstract
Doped BaZrO3 is well recognized as a promising material for proton conduction, particularly in solid oxide fuel cells (SOFCs) and various electrochemical applications. While this material has been thoroughly examined for proton conduction, it has not been as extensively studied for other potential applications, such as photocatalytic water splitting and solar cell devices. This investigation delves into the comprehensive assessment of structural, electronic, optical, mechanical, and thermodynamic properties in Ti-doped BaZrO3 (BaZr1-xTixO3 where x = 0,0.25, 0.5, 0.75) through the application of Density Functional Theory (DFT) employing the Generalized Gradient Approximation (GGA) and Perdew-Burke-Ernzerhof (PBE) exchange–correlation function. After doping, all of the doped compounds undergo a phase transition from cubic to tetragonal once Ti is added to BaZrO3. Analysis of the computed structural properties reveals a slight reduction in lattice parameters accompanied by a decrease in cell volume. The doping of Ti led to a reduction in the electronic bandgap energy of BaZrO3. Specifically, the bandgap decreased from an initial value of 3.118 eV at x = 0, which was an indirect bandgap, to a lowest value of 1.8 eV at x = 0.5, also identified as an indirect bandgap. This bandgap reduction leads to significant changes in optical properties, enabling absorption at lower photon energies compared to pure BaZrO3, which is beneficial for photocatalytic water splitting and solar cell applications. Mechanical properties confirmed the stability of the investigated composition through the Born stability criteria. Furthermore, thermodynamic properties across different doping concentrations revealed the highest Debye temperature at x = 0.75, indicating a higher melting point and enhanced thermal stability.
Keywords: BaZrO3 perovskite, Density functional theory (DFT), Transitional metal, Doping, Bandgap tuning
Subject terms: Materials science, Optics and photonics, Physics
Introduction
Transitional metal (TM) perovskite oxides represent a critically significant class of materials that garnered substantial attention both theoretically and experimentally across numerous fields of material science, owing to their profound technological applications. Perovskite oxides with the general formula ABO3, where the B-site is occupied by a transition metal cation and the A-site by a rare earth cation, exhibit exceptional versatility with applications spanning photocatalysis, multiferroic devices, superconductors, thermoelectric converters, and advanced energy storage systems1–6. As a result, across a wide range of technologies, including microwave devices, optoelectronic modulators, solar cells, fuel cells, infrared sensors, infrared detectors, and other electromechanical systems, the ABO3 perovskite has proven to be adaptable7–9. Additionally, TM perovskite oxides have been examined and found to have several advantages, including a large bandgap and good carrier mobility. These qualities make them attractive candidates for a range of uses, including high-frequency, high-power, and transparent conductor deployment10. By carefully adjusting their transport, magnetic, and optical characteristics by doping, strain engineering, or external fields, specific functions for particular applications are made possible. This tunability makes them suitable for integration into devices such as metal–semiconductor field-effect transistors, solar cell absorber layers, and photocatalytic systems for water-splitting applications11–13. Solid oxide fuel cells (SOFC) are a highly regarded energy conversion technology that has attracted a lot of interest in terms of performance enhancement and commercialization14. Operating SOFC at high temperatures (> 1000 °C) often leads to challenges such as high production costs, material degradation, reduced performance, limited stability, and shortened device lifespan. Among high-temperature proton-conducting materials, TM oxide perovskite BaZrO3 (BZO) has garnered attention, though its practical use is hindered by low conductivity due to grain boundary blocking and poor sinterability15–30. However, doping BZO with lower-valence cations such as yttrium (Y) has been shown to mitigate these issues which improved conductivity and stability at reduced operating temperatures31–33. Moreover, high proton conductivity, coupled with commendable chemical and mechanical stability, positions acceptor-doped perovskite oxides as highly promising contenders for serving as electrolytes in low-temperature solid oxide fuel cells (SOFCs)34–37.
In addition to their use in SOFCs, wide bandgap transition metal oxide perovskites are also emerging as promising absorber materials for solar cell devices and photocatalysts for water-splitting applications38,39. In TM oxide compounds, the valence band is typically formed by the 2p orbitals of oxygen atoms, while the conduction band mainly arises from the d orbitals of the TM-site cation. The degree of interaction between the TM-site atom and oxygen is influenced by the electronegativity of the TM-site element. As a result, the nature of the B-site component plays a crucial role in determining the photocatalytic performance of perovskite materials40–42. For example, previous studies have shown that TiO2, with its wide band gap of 3.2 eV, is limited to UV light absorption. However, doping with transition metals such as Cr or Ni can effectively narrow the band gap, enabling visible light sensitivity and improving carrier separation3. Another study on SrTiO3 TM perovskite oxide showed that incorporating Fe cations effectively tunes its band gap, making it suitable as an absorber layer for photovoltaic applications. Unlike pure STO, which absorbs only in the UV region (λ < 400 nm), Fe-doped STO displays a broad, intense absorption from 0.5 to 6 eV, enabling strong visible light activity. Moreover, according to the estimated band gap of the Fe-doped STO sample (1.43 eV), they suggested Nanocrystalline SrTi0.9Fe0.1O2.968 (STFO) for photocatalytic application1. Hydrogen production relies on photogenerated electrons and holes in a material to drive water oxidation and reduction4. The efficiency of a photocatalyst depends on the positions of its conduction and valence band edges relative to the redox potentials of water. Ideally, materials with a band gap above 1.23 eV can drive half-reactions required for water splitting43. Since just 4% of solar energy is in the ultraviolet light area, a photocatalyst must absorb substantially in the visible range of the spectrum in order to be energy-efficient. However, wide band gap materials cannot utilize visible light effectively due to a higher optical bandgap. Therefore, tuning the band edges is a possible way to make a photocatalyst suitable for water splitting under visible light. Cr-doped SrTi1-xCrxO3 (x = 0.00, 0.02, 0.05, 0.10) powders were synthesized in a previous study using the solvothermal method. The introduction of chromium into the TM oxide SrTiO3 lattice results reduction in the band gap, which falls within the visible light range. This new bandgap played a significant role in enhancing the absorption of visible light absorption which is attributed to electronic transitions from Cr 3 d states to hybridized Cr 3 d + Ti 3 d orbitals. Such improved absorption characteristics are particularly beneficial for the application of SrTiO3 as a photocatalyst in water-splitting processes44. Previous studies have also employed both experimental and computational approaches to investigate metal and nonmetal mono-doping, as well as co-doping, into potential transition metal oxide perovskites, including BaTiO3, CaTiO3, CaZrO3, and CaZrO345–55. These investigations have demonstrated that such modifications can tune the bandgap properties, making the wide bandgap TM oxide perovskites promising for photocatalytic water splitting applications by altering the conduction and valence band edges.
TM oxide zirconium-based perovskite oxides, especially BaZrO3, have been extensively studied in recent years due to their potential for thermoelectric and optoelectronic applications32,33. BaZrO3 is well recognized for its role in proton-conducting solid oxide fuel cells56. Because of their high melting points and excellent mechanical and thermal durability across a wide temperature range, zirconates have long attracted interest for use in thermal barrier coatings. Additionally, BaZrO3 doped with rare-earth elements such as Y, Yb, In, Sc, Gd, Nd, and Sm has been widely investigated as a proton-conducting electrolyte, where the optimization of dopant type and concentration significantly enhances proton conductivity28,57,58. Although doped BaZrO3 has been studied for optoelectronic uses according to previous literature, there is still a lack of sufficient deep understanding of how doping influences its electrical structure, particularly regarding bandgap narrowing and the possibility of improving its optoelectronic characteristics. More specifically, its viability as a photocatalyst or solar cell absorber material has yet to be thoroughly explored.
The primary objective of this investigation is to determine the relationship between the physical properties of BaZr1-xTixO3 and its suitability as an absorber layer for solar cells and photocatalytic applications. A doping strategy has been employed to tune the bandgap of BaZrO3, thereby modifying its optical properties to make it suitable for photovoltaic and photocatalytic applications under visible light. Transition metal titanium (Ti) is used to substitute zirconium (Zr) atoms in the BaZrO3 perovskite lattice, enabling orbital hybridization between Zr-4d and Ti-3d states. This interaction can effectively narrow the energy gap between the conduction band minimum (CBM) and valence band maximum (VBM). Doping concentrations of BaZr1-xTixO3 (where x = 0, 0.25, 0.5, and 0.75) were modeled through atomic substitution in a 2 × 2 × 1 supercell. All calculations were carried out using Density Functional Theory (DFT) with the GGA-PBE exchange–correlation functional59–65.
Computational details
This study of analyzing material properties has been conducted using the Cambridge Serial Total Energy Package (CASTEP), developed by Payne and others in the 1990s. This calculation is based on DFT, which is performed using Plane Wave Psudopotential basis set with the ultrasoft pseudopotential (USP)66,67. To explore the ground state structure, the Broyden–Fletcher–Goldfarb–Shanno (BFGS) method has been employed. Geometry optimization has been carried out in this work using the generalized gradient approximation (GGA) with the Perdew-Burke-Ernzerhof (PBE) function68. This study employed a cubic structure of BaZrO3 and a 2 × 2 × 1 supercell, as shown in Fig. 1. To introduce an impurity, Zr atoms were replaced by Ti in the supercell structure, corresponding to a doping concentration of 25%, 50%, and 75%. Consequently, the chemical formula of the BaZrO3 perovskite was modified to BaZr-xTixO3 (where x = 0, 0.25, 0.5, 0.75). A cutoff of energy 300 (eV) has been used, along with a k-mesh grid of 3 × 3 × 3 for conducting calculations within the irreducible Brillouin zone. Configuration parameters included 1 × 10⁻³ Å as maximum displacement, 0.05 GPa for stress, and a tolerance for force per atom set at 5.0 × 10⁻⁶ eV/Å. The electronic and optical properties are computed based on the aforementioned parameters utilized in structural optimization. Thermal properties are explained through the analysis of mechanical properties.
Fig. 1.

(a) Unit cell structure of BaZrO3, and different atomic arrangement in BaZr-xTixO3 for (b) x = 0, (c) x = 0.25, (d) x = 0.5, and (e) x = 0.75.
Result and discussion
Structural properties
The investigation involves the cubic oxide perovskite BaZrO3, which falls within the crystallographic space group of Pm3m (No. 221). In the BZO unit cell, the atoms are distributed as follows: Ba atoms situated at the corner positions with fractional coordinates of (0,0,0), B site atoms occupying the body-centered position with fractional coordinates of (0.5,0.5,0.5), and O atoms positioned at the face-centered locations with fractional coordinates of (0,0.5,0.5), (0.5,0,0.5), and (0.5,0.5,0).
Figure 1 illustrates the BaZrO3 unit cell, a pure 2 × 2 × 1 supercell structure of BaZrO3, and Ti-doped BaZrO3 supercell structures. After geometry optimization, the calculated lattice parameter of pure BaZrO3 is well-matched with previously studied theoretical and experimental works, which is illustrated in Table 116. Detailed geometrically optimized structural parameters for both the pure and Ti-doped BZO are provided in Table 1. Due to the Ti doping in BZO has lessened the lattice parameters have lessened overall, which may be due to the smaller ionic radius of Ti (0.067 nm) than Zr (0.080 nm). Moreover, when the Ti dopant was added to the Zr site of BaZrO3, the change of phase was observed. After Ti doping at different levels, the cubic symmetry of BZO with a space group of Pm3m changes to Tetragonal P4/mm symmetry.
Table 1.
Optimized lattice parameters a0 (Å) and cell volume V0 (Å3) of BaZr-xTixO3.
| Composition | Symmetry | Function | a0 (Å) | V0 (Å3) | Remarks |
|---|---|---|---|---|---|
| Pure BaZrO3 | Pm3m | GGA | 4.26 | 77.30 | Cal16. |
| Pm3m | – | 4.19 | 73.61 | Expt23. | |
| Pm3m | GGA | 4.223 | 73.5 | Cal19. | |
| Pm3m | – | 4.191 | – | Expt25. | |
| Pm3m | – | 4.192 | 73.66 | Expt26. | |
| Pm3m | LDA | 4.154 | 71.68 | Cal30. | |
| Pm3m | LDA | 4.16 | 72.30 | Cal20. | |
| Pm3m | GGA | 4.25 | 77.27 | This work | |
| BaZr0.75Ti0.25O3 | P4/mm | GGA |
a = b = 8.42 c = 4.23 |
300.63 | This work |
| BaZr0.5Ti0.5O3 | P4/mm | GGA |
a = b = 4.18 c = 8.27 |
290.04 | This work |
| BaZr0.25Ti0.75O3 | P4/mm | GGA |
a = b = 8.21 c = 4.12 |
278.41 | This work |
Electronic properties
Electronic band structure
The electronic response of a material is indicated by its electronic band structure and density of states (DOS) characteristics69. The electronic band structures along high symmetry directions have been computed to analyze the electronic properties of both undoped BZO and Ti-doped BZO as depicted in Fig. 2. Figure 2(a) illustrates the bandgap of pure BZO, while the subsequent figures (Fig. 2(b-d)) depict the bandgaps of BZO doped with increasing percentages of Ti, arranged in ascending order. The valence band maxima (VBM) are found at the R symmetry point, while the conduction band minima (CBM) are found at the G-symmetry point in all doping concentrations (x = 0.25, 0.5, 0.75). As the symmetry points are different in the electronic structure of the material, hence is called an indirect band gap. The Fermi energy level (EF) is denoted by the red dotted line. The position of the VBM remains largely consistent across all doping concentrations, with noticeable variances only apparent in the CBM position. In pure BZO, the difference between these two positions is represented by the measured band gap of 3.119 eV. The determined band gap energy of pure BZO is closely aligned with the previously postulated bandgap energy (Table 2), confirming the accuracy and reliability of this theoretical approach for band gap calculations17.
Fig. 2.

Electronic bandstructure of BaZr1-xTixO3 where (a) x = 0, (b) x = 0.25, (c) x = 0.5, and (d) x = 0.75.
Table 2.
Comparison of calculated bandgap values with previously reported studies.
After introducing Ti (x = 0.25) into the Zr site of BZO, the band gap experiences a notable reduction from 3.117 eV to 2.331 eV. This reduction occurs due to the shifting of the conduction band (CB) of the pure BZO compounds towards lower energy levels (redshift). The calculated band structure indicates a discernible alteration in the bandgap pattern following a 25% Ti doping into the Zr site. As the doping percentage increases (x = 0.5), a tendency of reduction in the bandgap is still observed. At a doping level of 50%, the band gap decreases to 1.81 eV. Moreover, at a higher doping concentration of 75% Ti, the band gap experiences a slight increase, reaching 1.831 eV. In all cases, the VBM is situated within Z symmetry, while the CBM aligns with G symmetry. When the valence band (VB) crosses above the Fermi energy level, figuring out the band gap value on the band structure diagram gets somewhat complex. This is a result of semiconductors having degenerate doping, which produces an excess of electron carriers over the density of states (DOS) at the conduction band edge. When degenerately doped, the Fermi level is located in the CB, which makes it difficult to determine the exact band gap value. This phenomenon is commonly referred to as the Moss–Burstein effect70,71. However, this effect has not been seen in this investigation. In indirect bandgap materials, direct electron transition from valence band to conduction band is not possible due to the momentum mismatch between the valence band maximum (VBM) and the conduction band minimum (CBM). Phonon-assisted interband transitions play a crucial role in overcoming this mismatch. By absorbing or emitting phonons, which vary in momentum, these transitions facilitate electron excitation across the bandgap. Interband transitions are essential for the operation of optoelectronic devices, as they involve the excitation of charge carriers from the valence band to the conduction band, which is also a key process in optoelectronic devices such as solar cells, laser diodes, and light-emitting diodes (LEDs)72,73.
Total and partial density of states
The electronic density of states refers to the number of electronic energy levels available per unit of energy at each energy level, accommodating electrons within a material. Figure 3 illustrates the TDOS and PDOS for pristine BZO and Ti-doped BZO. To explore the nature of chemical bonds in both pure and doped forms, as well as the orbital contribution to the TDOS, it is needed to calculate the PDOS. The energy level corresponding to the Fermi level is indicated by the vertical dotted line positioned at 0 eV. However, the VB is specified in the lower portion of the fermi level, while the CB is shown in the upper part. Figure 3(a) shows the Density of States (DOS) of pure BZO in both its total and partial forms, which indicates that the predominant contribution to the top of the VB comes from a combination of O-2p state and Ba-p states. Meanwhile, the CBM comes from the 4d-state of Zr in pure BaZrO3. When Ti is doped into BZO at 25%, the O-2p orbital becomes the primary contributor of the VB in doped BZO, with a minor influence from the Zr-4d and Ti-3d states. That means the Ti-3d state is leading to form CBM in doped BZO, with minor involvement of the Zr-4d state depicted in Fig. 3 (b). Figure 3(c) and (d) depict the TDOS and PDOS of Ti-doped BZO at higher doping concentrations (x = 0.5, 0.75). In both doping concentrations, the 2p-states of O still play a dominant role in forming the VB, while the CB primarily originates from the Ti-3d and Zr-4d states. However, as the doping concentration increases, the potential presence of Ti-3d states has been observed, which could contribute to a reduction in the band gap from 3.11 eV to 1.81 eV.
Fig. 3.

TDOS and PDOS of BaZr1-xTixO3 where (a) x = 0, (b) x = 0.25, (c) x = 0.5, and (d) x = 0.75.
Charge density
In order to determine the type of chemical bond between atoms, charge density must be calculated. Higher electronegativity atoms have a tendency to draw electron density towards themselves74. Figure 4 illustrates the charge density of various compounds along the (2 0 0) plane, elucidating the bonding properties between different atoms in the supercell. The density of electrons is represented by a scale on the right side of the charge density plot. It is visible that the charge density is higher around the O atoms than Ba/Zr in the pure BZO structure as depicted in Fig. 4(a). After Ti doping, the electron cloud increases in Ti and decreases in O atoms. Figure 4 clearly illustrates the covalent nature of the Ti–O/Zr-O bond within all structures. This is characterized by the overlapping and polarization of electron clouds between the bonding atoms, leading to a noticeable increase in covalent bond strengths.
Fig. 4.

Charge density map of BaZr1-xTixO3 along (200) plane where (a) x = 0, (b) x = 0.25, (c) x = 0.5, and (d) x = 0.75.
Optical properties
The energy loss function, absorption coefficient, complex dielectric constant, refractive index, and reflectivity must be calculated to investigate the optical properties of a material. In this study, an in-depth investigation of the optical properties is conducted by comparing pristine BZO with BZO materials doped at various levels. The mathematical equations describing real dielectric function ( ), imaginary dielectric function (
 ), reflectivity
  , loss function
  , absorption coefficient
  , refractive index n(ω), and conductivity (
 ) have been presented below75–79. Here, M is the Cauchy principal value operator, V is the normalization factor, ω denotes the angular frequency of the incident light, m is the electron mass, and Enk, Emk represent the energy eigenvalues of the bands n and m at a given wavevector k, and ħ is the planck’s constant
 |
1 |
 |
2 |
 |
3 |
 |
4 |
 |
5 |
 |
6 |
 |
7 |
Frequency-dependent optical properties of pure and Ti-doped BZO perovskite have been calculated at energies between 0 and 50 eV. According to the energy spectrum, the visible spectrum shows that light possesses energy ranging from 2.75 eV to 5.2 eV, while the infrared zone of light spans roughly 0–2.75 eV. Energy levels higher than 5.2 eV but lower than 30 eV are accounted for in the ultraviolet (UV) region of light.
The dielectric function plays a pivotal role in assessing how a material interacts with electromagnetic radiation. It is used to characterize physical characteristics by reflecting the information between the energy band structure and optical spectrum lines. A heightened dielectric constant reduces the recombination rate of charge carriers, thereby enhancing the overall efficiency of devices. Consequently, the dielectric function is a crucial material property that significantly impacts how effectively optoelectronic applications operate80. The real and imaginary parts of the dielectric functions are depicted in Fig. 5(a) & (b). The complex dielectric function is composed of two fundamental components: the imaginary dielectric function (IDF) ε2, which is responsible for energy dissipation, and the real part ε1, which represents the ability to store charge. The static dielectric function ε1 (0) refers to the real dielectric function ε1(ω) evaluated at 0 eV energy. Figure 5(a) illustrates how the static dielectric constant rises as the doping concentration increases. The maximum static dielectric constant has been found at the doping concentration (x = 0.75).
Fig. 5.

Optical properties of BaZr1-xTixO3: (a) Real Dielectric Function, (b) Imaginary Dielectric Function, (c) Absorption coefficient, (d) Reflectivity, (e) Refractive index, (f) Conductivity, and (g) Loss function.
When photon energy increases, the peak value of ε1 for pure BZO has been found at 4 eV, while all the doped BZO materials show the highest value below 4 eV. Once they reach their peak, a downward trend has been observed that continues until the negative value of ε1(ω). Photon energy ranges of 7–12 eV and 27–30 eV are characterized by negative real dielectric function for both pure and doped BZO materials, implying that the materials do not permit the transmission of electromagnetic waves within these specific energy spectrums of negative ε1(ω) values. The metallic behavior of these materials is demonstrated by the actual component of this negative dielectric value. For both pure and doped BZO materials, the IDF is zero at 0 eV, meaning that no energy has been dissipated in these materials at 0 eV. It should be noted that the value of IDF remains zero until absorption begins, which happens when the photon’s energy reaches the band gap energy. All of the pure and doped BZO materials exhibit their first pick of IDF at a photon range between 2–10 eV. These peaks correspond to interband transitions between the VBM and CBM, as this transition governs photon absorption, especially in the context of charge excitations and optoelectronic behavior, as evidenced by the earlier studies81–83. Consequently, the probability of an electron transitioning from the valence band to the conduction band is influenced by the magnitude of the imaginary part of the dielectric function. Here, O-2p to Zr-4d, Ti-3d transitions are responsible for causing the IDF peak.
Absorption has not been observed for both pure and doped BZO at 0 eV. Since bandgap energy is related to absorption, it begins at different photon energies because of the distinct bandgaps of pure and doped BZO materials. The substantial 3.118 eV optical bandgap exhibited by pure BZO restricts its activation solely by UV light. However, reducing this bandgap by Ti doping with different concentrations renders them active not just under UV light but also under visible light. As shown in Fig. 5(c), the doped materials, having smaller bandgaps compared to the pure ones, exhibit absorption onset at lower photon energies, falling within the visible spectrum. Here, the optical bandgap is also determined using a Tauc plot based on the Kubelka–Munk function, as illustrated in Figs. 6(a), 7(a). By extrapolating the linear region of the (αhν)2 vs. hν plot to the hν-axis, the intersection point gives the optical bandgap. The estimated optical bandgap values for BaZr1-xTixO3 (x = 0, 0.25, 0.5, 0.75) composition are 3.23, 2.25, 2.25, and 1.9 eV, respectively. These values are close to the calculated electronic bandgaps, except for x = 0.5 composition. It is evident that Ti doping at varying concentrations leads to a decrease in the optical bandgap and a corresponding redshift in the absorption peak. The shift in absorption from the UV to the visible range confirms the potential of this material as a photocatalyst for visible-light-driven water splitting and solar cell applications. Bandgap reduction plays a crucial role in enhancing photon absorption, which is essential for solar cell performance as it contributes to increased photocurrent. For water splitting, when a semiconductor absorbs photons, electrons in the valence band (VB) are excited to the conduction band (CB), leaving behind holes in the VB. These electron–hole pairs migrate to the catalyst surface, where water molecules undergo redox reactions to produce H2 and O284. Since the positions of the conduction and valence band edges relative to the redox potentials of H₂O/O₂ and H⁺/H₂ determine a material’s photocatalytic activity, we have calculated these band edge potentials using the empirical Mulliken electronegativity formula85.
 |
8 |
 |
9 |
where  is the geometric mean of the Mulliken electronegativities and E0 = 4.5 eV is the NHE potential with respect to the vacuum.
  for BaZrO3 and BaZr1-xTixO3 can be calculated by following relations:
 |
10 |
 |
11 |
Fig. 6.

(a) Tauc’s plot showing the optical bandgap, and (b) the theoretically calculated band edge potentials for BaZr1-xTixO3 (x = 0, 0.25, 0.5, 0.75).
Fig. 7.

Paugh’s ratio and Poisson’s ratio alternating for BaZr1-xTixO3 where (x = 0, 0.25, 0.5, and 0.75).
Here, the absolute electronegativity of component atoms Ba, Zr, Ti, and O is denoted by  ,
,  , and
, and  , and
, and  , respectively. To effectively harness visible light for water splitting, the semiconductor should have a band gap below 3.0 eV. Additionally, the CBM must lie above the H+/H2 reduction potential (0 V), and the VBM must lie below the O2/H2O oxidation potential (1.23 V) vs. NHE. The calculated results and their relevance are illustrated schematically in Figs. 6(b), 7(b). According to Figs. 6(b), 7(b), the CBM shifts downwards and the VBM shifts upwards, indicating improved photo-reduction and photo-oxidation capacities. Based on the optical bandgap shown in Figs. 6(a), 7(a) and the absorption spectra in Fig. 5(c), the Ti-doped BZO with x = 0.5, x = 0.75 can effectively absorb both visible and UV light, indicating strong potential for solar-driven water splitting and hydrogen production.
The assessment of a material’s surface behavior involves measuring its reflectivity, determined by the ratio of incoming power to the reflected power. Reflectivity is also an important characteristic of materials utilized in solar cell applications. Figure 5(d) illustrates that pure BZO exhibits a zero-frequency limit of 0.126 for reflectivity. From this base value, the reflectivity slightly rises and reaches the maximum value of 0.4. In the case of doped BZO structures, it initiates above the value of 0.126 and attains its maximum value at a photon energy of around 8–10 eV. Notably, owing to collective plasma resonance, the doped materials showcase their lowest reflectivity within 12 eV to 23 eV. Surprisingly, the highest reflectivity coincides with the instance where the ε1(ω) dips below zero. This transition into negative values for the ε1 signifies a metallic nature in the material. Reflectivity tends to increase with the metallic properties of a compound, hence reaching its peak when ε1 exhibits negativity86. As shown in Fig. 5(d), the reflectivity is low in the IR–visible region (0–5 eV), indicating that these materials can effectively transmit visible light. This also suggests their potential use in solar cell devices to enhance photocurrent generation and overall efficiency.
The phase velocity of light in a medium is reduced because the material’s electrons collectively polarize and alter its permittivity. This slower phase velocity manifests as a refractive index greater than one. A substance’s refractive index increases with increased electron density. Covalent bonds usually have higher indices because they share electrons, while ionic compounds have lower refractive indices because fewer electrons interact with light photons87. The real and imaginary parts of the dielectric constant determine the refractive index, as shown in Eq. 4. In covalent materials, sharing electrons between different atoms leads to more easily polarized molecules under an external electric field. This also leads to a higher value of the real component of the dielectric constant, and thus a higher refractive index88. In terms of ionic compounds, there are robust coulomb interactions among ions with opposite charges. Indeed, they become polarized in the presence of an external electric field; however, electrons exhibit greater localization compared to covalent compounds. This leads to a reduction in the real part of the dielectric constant and the refractive index89,90. The ε1(ω) gives an idea about the refractive index of a material. Refractive index with respect to photon energy ranging from 0 to 50 eV has been depicted in Fig. 5(e). This statement is supported by the charge density map in Fig. 4, which shows that with increasing levels of doping, the covalent character of the bonds increases, leading to rise in the refractive index. At 0 eV photon energy, the refractive index is called static refractive index which is found for pure BZO is 2.10. As doping concentration increases static refractive index of these doped materials also increases.
When intense electromagnetic radiation interacts with a material’s surface, optical conductivity offers information on how bonds are disrupted. Through a band-to-band separation of the IDF, the optical conductivity spectrum can be used to determine the specific transitions responsible for these peaks91. The optical conductivity mirrors the trend seen in the absorption coefficient, as illustrated in Fig. 5(f). The peak conductivity has been observed in pure BZO material at photon energy around 28 eV, whereas the doped materials do not show significantly higher conductivity at a specific photon energy. It is noted that at photon energy around 4 eV, all the structures exhibit comparatively lower conductivity. The substantial magnitude of the optical conductivity signifies the material’s exceptional responsiveness to light, indicating a notably heightened photo-response nature in the UV region.
When fast electrons traverse through a material, understanding the loss function is crucial. The zenith of this loss function marks the plasma frequency, denoted as ωp, which correlates with the material’s plasma resonance. Plasma frequency (ωp) is directly linked to the electron density within the material. Notably, photons possessing energies below 2.5 eV do not cause any significant energy loss. Once the photon energy exceeds this threshold, energy loss increases gradually. Both pure and doped BZO materials exhibit their primary peak at photon energy around 11–12 eV as depicted in Fig. 5(g). However, more peaks have been observed in both pure BZO structures at higher photon energies.
Mechanical properties
The mechanical properties of a material can be analyzed through the utilization of elastic constants, denoted as Cij. These constants elucidate how stress induces deformation in a material and how the material reverts back to its original form upon cessation of the stress92. Since elastic constants provide the specific mechanical behavior and bonding properties of solids, understanding their independent elastic constants is necessary to comprehend the mechanical behavior of materials. In particular, these elastic constants describe the brittleness, anisotropy, ductility, stiffness, and stability of a material93. All calculated elastic constants of different compositions of BZO have been provided in Table 3, and the Bulk modulus, Pugh ratio, Poisson ratio, and Anisotropy factor have also been provided in Table 4.
Table 3.
Independent elastic constants of Zr doped BaZrO3.
| Composition | C11 | C12 | C13 | C22 | C23 | C33 | C44 | C55 | C66 | C12-C44 |
|---|---|---|---|---|---|---|---|---|---|---|
| X = 0 | 264.65 | 49.26 | 49.26 | 264.65 | 49.26 | 264.65 | 65.00 | 65.00 | 65.00 | −15.74 |
| X = 0.25 | 227.46 | 60.00 | 68.35 | 227.46 | 68.35 | 243.57 | 98.07 | 98.07 | 97.87 | −38.07 |
| X = 0.5 | 258.65 | 67.97 | 67.93 | 258.65 | 67.93 | 215.17 | 93.18 | 93.18 | 85.75 | −25.21 |
| X = 0.75 | 236.21 | 77.76 | 71.65 | 236.21 | 71.65 | 274.57 | 101.02 | 101.02 | 97.11 | −23.26 |
Table 4.
Bulk modulus, shear modulus, elastic modulus, Poisson’s ratio, hardness, and anisotropic factor for Ti-doped BaZrO3.
| Composition | BV | BR | B | GV | GR | G | B/G | ʋ | E | Hv | A |
|---|---|---|---|---|---|---|---|---|---|---|---|
| X = 0 | 121.02 | 121.01 | 121.01 | 81.81 | 77.11 | 79.46 | 1.52 | 0.23 | 195.58 | 14.31 | 0.61 |
| X = 0.25 | 121.06 | 120.79 | 120.93 | 92.23 | 91.62 | 91.93 | 1.31 | 0.19 | 220.03 | 19.10 | 1.17 |
| X = 0.5 | 120.26 | 119.15 | 119.70 | 85.37 | 84.81 | 85.09 | 1.40 | 0.21 | 206.38 | 16.48 | 0.98 |
| X = 0.75 | 132.12 | 131.72 | 131.92 | 94.89 | 94.06 | 94.48 | 1.39 | 0.21 | 228.81 | 18.27 | 1.27 |
To ensure mechanical stability, it’s crucial to confirm that each elastic constant adheres to the Born stability criteria and remains positive94,95. The cubic structure features three distinct elastic constants, while the tetragonal structure presents six. The computed values of C11, C44, and C44 for pristine BZO are closely aligned with previously calculated values96. The Born stability criteria govern the material’s mechanical behavior and are summarized by the following relationships93,97–101:
C11 > 0, C11 + 2C12 > 0, C44 > 0, C11 − C12 > 0 (Stability criteria for cubic structure).
C11 >  , C66 > 0, C11 + C33 − 2C13 > 0, C11 − C12 > 0, 2(C11 + C12) + C33 + 4C13 > 0) (Stability criteria for Tetragonal structure).
According to this investigation, every structure met the above-mentioned conditions, confirming the materials’ stability at various doping levels. The tetragonal structure (X = 0.5) exhibits a slightly lower C11 value compared to C33, indicating weaker compressibility along the [001] direction than the [100] direction. Conversely, in the structure (X = 0.25,0.75), the C11 value is slightly lower than C33, suggesting higher chemical bonding energy in the [010] and [100] directions relative to the [001] direction. Across all tetragonal structures, C44 surpasses C66, highlighting the tendency for easier shear deformation along the [010] direction than the [001] direction102,103. Key mechanical properties, such as elastic moduli (B, G, and E), Poisson’s ratio (v), Pugh’s ratio, and anisotropy, have been calculated using the Reuss and Voigt techniques with elastic constants. Additionally, the hardness (Hv) and factor (A) of pristine and doped BZO are examined in this study. For cubic structures, the Voigt-Reuss-Hill scheme provides an approach for approximating bulk and shear moduli. Utilizing the Vigot and Resus theory, the bulk modulus is determined by employing Eq. 8 for cubic structures, while Eqs.13 & 14 are employed for tetragonal structures92,104,105. Here, Cij refers to the elastic constants and Sij refers to the elastic compliance constants.
 |
12 |
 |
13 |
 |
14 |
According to the Vigout and Resus theory, the shear modulus is computed using Eqs.15 & 16 for cubic structures, and Eqs.17 & 18 for tetragonal structures106.
 |
15 |
 |
16 |
 |
17 |
 |
18 |
For cubic pristine BZO, the anisotropic factor (A) is determined using Eq.19, while Eq.20 is utilized for tetragonal structures107,108.
 |
19 |
 |
20 |
Several general equations (Eqs.21–25) exist for calculating Young’s modulus ( ), Hill’s shear modulus (
 ), Hill’s bulk modulus (
 ), Poisson’s ratio (
 ), and Hardness (
 ) for both cubic and tetragonal structures based on the aforementioned Equations109,110.
 |
21 |
 |
22 |
 |
23 |
 |
24 |
 |
25 |
The ductility testing proposed by B/G is called the Paugh ratio, with a threshold value set at 1.75. To determine a material’s ductility or brittleness, Pugh’s ratio is used. When a material’s B/G ratio is greater than 1.75, it is classified as ductile; if not, it is called as brittle111. As seen in Figs. 6(a), 7(a), all the compounds investigated in this work had a Paugh’s ratio of less than 1.75, showing that they are inherently brittle.
Poisson’s ratio ( ) is also a crucial parameter for characterizing the mechanical behavior of materials. It serves as a key indicator for assessing ductility versus brittleness. Additionally, Poisson’s ratio (
 ) is a parameter in evaluating the shear stability of a lattice structure; higher values typically signify superior plasticity112. Materials with a Poisson’s ratio greater than 0.26 are generally classified as ductile, while those with values below this threshold are considered brittle113,114. Materials with a Poisson’s ratio greater than 0.26 are generally classified as ductile, while those with values below this threshold are considered brittle113,114. The Poisson’s ratio consistently stayed below the ductile–brittle transition line at various doping levels, indicating the brittleness of these structures as depicted in Fig. 6(b), 7(b). The hardness of a polycrystalline material refers to its ability to withstand external forces, making it a vital characteristic to explore, especially for materials employed in demanding industrial applications. fluctuation in hardness with respect to doping concentration is shown in Fig. 8(a), demonstrating the maximum hardness at a doping concentration of (x = 0.25).
Fig. 8.

Paugh’s ratio and Poisson’s ratio alternating for BaZr1-xTixO3 where (x = 0, 0.25, 0.5, and 0.75).
The value of A is fixed to 1 for an isotropic compound; on the other hand, it becomes larger or smaller for an anisotropic compound. The degree of elastic anisotropy in crystals is indicated by the deviation of this value from 1115. Table 3 illustrates that there is no unity value across all the structures, indicating all the structures (x = 0, 0.25, 0.5, 0.75) are anisotropic. Figure 8(b) distinctly illustrates the variation of the anisotropy factor concerning different doping concentrations.
Thermodynamic properties
Debye temperature is a crucial parameter that characterizes the strength of atomic bonds within crystals, wherein the maximum frequency of thermal vibrations in a solid is directly linked to its Debye temperature. The following is the established relationship between average wave velocity and Debye temperature116,117:
 |
26 |
where the molecular weight ( ), density (
 ), Avogadro constant (
 ), Planck constant (
 ), and Boltzmann constant (
 ). Debye temperature has a substantial influence on thermal conductivity, lattice vibration, melting temperature, specific heat, and thermal expansion. The change in Debye temperature with different doping concentrations has been depicted in Fig. 9. The maximum Debye temperature has been observed at a higher doping concentration of (x = 0.75). As the doping level increases, a higher Debye temperature suggests increased strength in covalent bonds, resulting in decreased pliability118. The
  values of the various structures (x = 0, 0.25, 0.5, 0.75) are close to the well-known thermal barrier coating (TBC) material Y4Al2O9 (
 )119. This implies that the previously mentioned structures with doping concentration (x = 0, 0.25, 0.5, 0.75) would be a better choice for TBC materials.
Fig. 9.
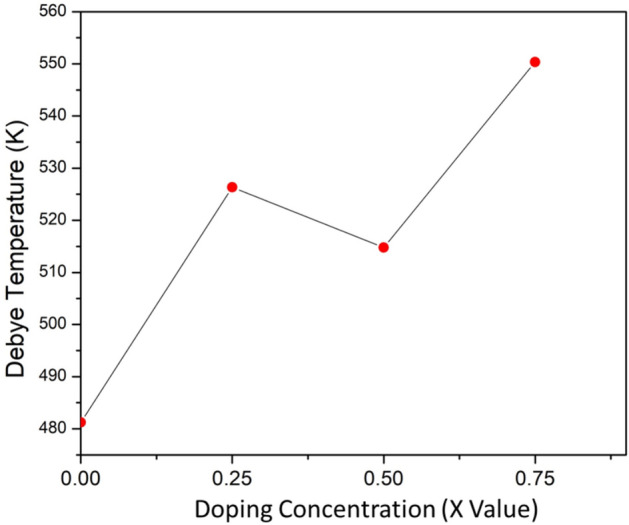
Variation of Debye Temperature in BaZr1-xTixO3 where (x = 0, 0.25, 0.5, and 0.75).
Conclusion
This study investigates the physical properties of pure BZO and Ti-doped BZO at different doping contents, where DFT has been as been used with the exchange–correlation function of GGA and PBE. Electronic band structures of pure and doped BZO both show indirect energy gaps. In pure BZO, the uppermost portion of the VB arises from the hybridization of O-p states and Ba-p states, while the CB mostly originates from the s-state of Ba and the d-state of Zr. The O-p state dominates the VB of doped BZO, with tiny contributions from the Zr-d and Ti-d states. In contrast, the Ti-d state leads the CB in doped BZO compounds, with a minor contribution from the Zr d states. Various optical properties such as the dielectric function (ɛ1 and ɛ2), absorption coefficient, conductivity, reflectivity, reflectivity, and loss function have been illustrated in this study. The results revealed distinct changes in the optical properties following the Ti doping in BZO. Remarkably, there is a notable shift observed in the absorption edge towards lower energy regions, indicative of a reduced bandgap in the doped BZO materials compared to the pure BZO. The brittleness of the investigated structures is confirmed by the analysis of Pugh’s ratio and Poisson’s ratio. In addition, the compound’s hardness and machinability index have been determined through extensive analysis to determine its suitability for industrial use. The study suggests that the solids could be used as TBC materials due to their promising mechanical properties. Moreover, with the growing energy crisis driven by the excessive use of fossil fuels, this study holds significant potential for advancing the industrial production of hydrogen. Beyond exploring the promising properties of the investigated materials from a computational and theoretical perspective, this work paves the way for broader experimental research with doped BZO as a promising solar cell absorber and photocatalyst. Further experimental studies are essential to evaluate the suitability of these materials for practical applications such as water splitting and TBC.
Acknowledgements
The authors extend their appreciation to Taif University, Saudi Arabia for supporting this work through project number (TU-DSPP-2024-19).
Author contributions
A.K. Datta, and M.K. Hossain: Conceptualization, Methodology, Software, Validation, Formal analysis, Investigation, Data curation, Writing – original draft, Writing – review & editing, Supervision, Project administration; M.S. Revathy, M.S. Reddy, A. Singh, S. Radhika, S. Choudhury, A.S.S. Bisht, A.M.S. Alhuthali, M.H. Abdellattif, R. Balachandran, and R. Haldhar: Validation, Formal analysis, Writing – review & editing.
Funding
The research was funded by Taif University Saudi Arabia project number TU-DSPP-2024–19.
Data availability
The datasets generated and/or analysed during the current study are not publicly available as the data also forms part of an ongoing study but are available from the corresponding author upon reasonable request.
Declarations
Competing interests
The authors declare no competing interests.
Footnotes
Publisher’s note
Springer Nature remains neutral with regard to jurisdictional claims in published maps and institutional affiliations.
Contributor Information
M. Khalid Hossain, Email: khalid.baec@gmail.com, Email: khalid@kyudai.jp.
R. Balachandran, Email: balachandran.ruthramurthy@astu.edu.et
Rajesh Haldhar, Email: rajeshhaldhar.lpu@gmail.com.
References
- 1.Sedeek, K., Said, S. A., Amer, T. Z., Makram, N. & Hantour, H. Band gap tuning in nanocrystalline SrTi0.9Fe0.1O2.968 perovskite type for photocatalytic and photovoltaic applications. Ceram. Int.45, 1202–1207 (2019). [Google Scholar]
- 2.Hossain, M. K. et al. Numerical Analysis in DFT and SCAPS-1D on the Influence of Different Charge Transport Layers of CsPbBr 3 Perovskite Solar Cells. Energy Fuels37, 6078–6098 (2023). [Google Scholar]
- 3.Shaban, M., Ahmed, A. M., Shehata, N., Betiha, M. A. & Rabie, A. M. Ni-doped and Ni/Cr co-doped TiO2 nanotubes for enhancement of photocatalytic degradation of methylene blue. J. Colloid Interface Sci.555, 31–41 (2019). [DOI] [PubMed] [Google Scholar]
- 4.Abhishek, B. et al. Challenges in photocatalytic hydrogen evolution: Importance of photocatalysts and photocatalytic reactors. Int. J. Hydrogen Energy81, 1442–1466 (2024). [Google Scholar]
- 5.Hossain, M. K. et al. Deep Insights into the Coupled Optoelectronic and Photovoltaic Analysis of Lead-Free CsSnI 3 Perovskite-Based Solar Cell Using DFT Calculations and SCAPS-1D Simulations. ACS Omega8, 22466–22485 (2023). [DOI] [PMC free article] [PubMed] [Google Scholar]
- 6.Hossain, M. K. et al. Effect of Various Electron and Hole Transport Layers on the Performance of CsPbI 3 -Based Perovskite Solar Cells: A Numerical Investigation in DFT, SCAPS-1D, and wxAMPS Frameworks. ACS Omega7, 43210–43230 (2022). [DOI] [PMC free article] [PubMed] [Google Scholar]
- 7.Schneider, T. et al. Optical properties of PZT thin films deposited on a ZnO buffer layer. Opt. Mater. (Amst)29, 1871–1877 (2007). [Google Scholar]
- 8.Scott, J. F. Applications of Modern Ferroelectrics. Science315, 954–959 (2007). [DOI] [PubMed] [Google Scholar]
- 9.Hossain, M. K. et al. Combined DFT, SCAPS-1D, and wxAMPS frameworks for design optimization of efficient Cs 2 BiAgI 6 -based perovskite solar cells with different charge transport layers. RSC Adv.12, 34850–34873 (2022). [DOI] [PMC free article] [PubMed] [Google Scholar]
- 10.Rowberg, A. J. E., Krishnaswamy, K. & Van de Walle, C. G. Prospects for high carrier mobility in the cubic germanates. Semicond. Sci. Technol.35, 085030 (2020). [Google Scholar]
- 11.Kumar, N., Simpson, H. R. J., Rana, M. M. & Shankar, K. Plasmon-enhanced organic field effect transistors. J. Mater. Chem. C13, 9951–9972 (2025). [Google Scholar]
- 12.Hu, Y. et al. Recent progress on stability and applications of flexible perovskite photodetectors. J. Semicond.46, 011601 (2025). [Google Scholar]
- 13.Tey, Q. Y., Soo, J. Z., Ng, W. C. & Chong, M. N. Next-generation perovskite-metal–organic framework (MOF) hybrids in photoelectrochemical water splitting: A path to green hydrogen solutions. J. Mater. Chem. A13, 9005–9038 (2025). [Google Scholar]
- 14.Mendonça, C., Ferreira, A. & Santos, D. M. F. Towards the Commercialization of Solid Oxide Fuel Cells: Recent Advances in Materials and Integration Strategies. Fuels2, 393–419 (2021). [Google Scholar]
- 15.Hossain, M. K. & Hashizume, K. A comparative study on the hydrogen dissolution and release behaviors in the zirconate proton conductors by TDS and TMAP4 analysis. J. Alloys Compd.907, 164436 (2022). [Google Scholar]
- 16.Gomez, M. A. et al. The effect of yttrium dopant on the proton conduction pathways of BaZrO3, a cubic perovskite. J. Chem. Phys.132, 214709 (2010). [DOI] [PubMed] [Google Scholar]
- 17.Zeba, I. et al. Effect of anomalous behavior of Be-doping on structural stability, bandgap and optical properties in comparison with Mg-doped BaZrO3 perovskite: insights from DFT calculations. Opt. Quantum Electron.52, 234 (2020). [Google Scholar]
- 18.Hossain, M. K., Iwasa, T. & Hashizume, K. Hydrogen isotope dissolution and release behavior in Y-doped BaCeO 3. J. Am. Ceram. Soc.104, 6508–6520 (2021). [Google Scholar]
- 19.Yang, X., Wang, Y., Song, Q., Chen, Y. & Hong Xue, Y. Pressure Effects on Structural, Electronic, Elastic, and Optical Properties of Cubic and Tetragonal Phases of BaZrO 3. Acta Phys. Pol. A133, 1138–1143 (2018). [Google Scholar]
- 20.Lebedev, A. I. & Sluchinskaya, I. A. Combined first-principles and EXAFS study of structural instability in BaZrO3. J. Adv. Dielectr.05, 1550019 (2015). [Google Scholar]
- 21.Hossain, M. K., Yamamoto, T. & Hashizume, K. Effect of sintering conditions on structural and morphological properties of Y- and Co-doped BaZrO3 proton conductors. Ceram. Int.47, 27177–27187 (2021). [Google Scholar]
- 22.Hossain, M. K., Hashizume, K. & Hatano, Y. Evaluation of the hydrogen solubility and diffusivity in proton-conducting oxides by converting the PSL values of a tritium imaging plate. Nucl. Mater. Energy25, 100875 (2020). [Google Scholar]
- 23.Yuan, Y. et al. Synthesis and photocatalytic characterization of a new photocatalyst BaZrO3. Int. J. Hydrogen Energy33, 5941–5946 (2008). [Google Scholar]
- 24.Hossain, M. K., Tamura, H. & Hashizume, K. Visualization of hydrogen isotope distribution in yttrium and cobalt doped barium zirconates. J. Nucl. Mater.538, 152207 (2020). [Google Scholar]
- 25.Akbarzadeh, A. R., Kornev, I., Malibert, C., Bellaiche, L. & Kiat, J. M. Combined theoretical and experimental study of the low-temperature properties of BaZrO 3. Phys. Rev. B72, 205104 (2005). [Google Scholar]
- 26.Yamanaka, S. et al. Thermophysical properties of BaZrO3 and BaCeO3. J. Alloys Compd.359, 109–113 (2003). [Google Scholar]
- 27.Hossain, M. K. et al. A review on experimental and theoretical studies of perovskite barium zirconate proton conductors. Emergent Mater.4, 999–1027 (2021). [Google Scholar]
- 28.Vera, C. et al. A mini-review on proton conduction of BaZrO 3 -based perovskite electrolytes. J. Phys. Energy3, 32019 (2021). [Google Scholar]
- 29.Hossain, M. K., Khan, M. I., Akash, T. S. & Hashizume, K. Molecular Dynamics Simulation For Barium Zirconate Proton Conducting Oxide Energy Materials: A Mini Review. Proc. Int. Exch. Innov. Conf. Eng. Sci.7, 1–6 (2021). [Google Scholar]
- 30.King-Smith, R. D. & Vanderbilt, D. First-principles investigation of ferroelectricity in perovskite compounds. Phys. Rev. B49, 5828–5844 (1994). [DOI] [PubMed] [Google Scholar]
- 31.Hossain, M. K., Yamamoto, T. & Hashizume, K. Isotopic effect of proton conductivity in barium zirconates for various hydrogen-containing atmospheres. J. Alloys Compd.903, 163957 (2022). [Google Scholar]
- 32.Akhtar, S. et al. Investigation of structural, electronic and optical properties of (V+P)-doped BaZrO3 for photocatalytic applications using density functional theory. J. Phys. Chem. Solids147, 109662 (2020). [Google Scholar]
- 33.Mubashir, S. et al. Pressure induced electronic, optical and thermoelectric properties of cubic BaZrO3: A first principle calculations. Optik (Stuttg).239, 166694 (2021). [Google Scholar]
- 34.Hossain, M. K. et al. Prospects and Challenges of Proton Conducting Cerates in Electrochemical Hydrogen Devices for Clean Energy Systems: A Review. Glob. Challenges9, (2025). [DOI] [PMC free article] [PubMed]
- 35.Brett, D. J. L., Atkinson, A., Brandon, N. P. & Skinner, S. J. Intermediate temperature solid oxide fuel cells. Chem. Soc. Rev.37, 1568 (2008). [DOI] [PubMed] [Google Scholar]
- 36.Kreuer, K. D. Proton-Conducting Oxides. Annu. Rev. Mater. Res.33, 333–359 (2003). [Google Scholar]
- 37.Hossain, M. K. et al. A Review of Applications, Prospects, and Challenges of Proton-Conducting Zirconates in Electrochemical Hydrogen Devices. Nanomaterials12, 3581 (2022). [DOI] [PMC free article] [PubMed] [Google Scholar]
- 38.Pattanayak, P. et al. Recent progress in perovskite transition metal oxide-based photocatalyst and photoelectrode materials for solar-driven water splitting. J. Environ. Chem. Eng.10, 108429 (2022). [Google Scholar]
- 39.Chander, S. & Tripathi, S. K. Recent advancement in efficient metal oxide-based flexible perovskite solar cells: A short review. Mater. Adv.3, 7198–7211 (2022). [Google Scholar]
- 40.Hossain, M. K. et al. Recent progress in barium zirconate proton conductors for electrochemical hydrogen device applications: A review. Ceram. Int.47, 23725–23748 (2021). [Google Scholar]
- 41.Dubey, S. et al. Tailoring the structural and electro-optical properties of avisible-light emitting BaZrO 3 photocatalyst: Integrating DFT and comprehensive experimental analysis. Nanoscale16, 18086–18107 (2024). [DOI] [PubMed] [Google Scholar]
- 42.Hossain, M. K. et al. Current Applications and Future Potential of Rare Earth Oxides in Sustainable Nuclear, Radiation, and Energy Devices: A Review. ACS Appl. Electron. Mater.4, 3327–3353 (2022). [Google Scholar]
- 43.Kim, J. H., Hansora, D., Sharma, P., Jang, J.-W. & Lee, J. S. Toward practical solar hydrogen production – an artificial photosynthetic leaf-to-farm challenge. Chem. Soc. Rev.48, 1908–1971 (2019). [DOI] [PubMed] [Google Scholar]
- 44.Liu, J. W., Chen, G., Li, Z. H. & Zhang, Z. G. Electronic structure and visible light photocatalysis water splitting property of chromium-doped SrTiO3. J. Solid State Chem.179, 3704–3708 (2006). [Google Scholar]
- 45.Majani, S. S. et al. Fe-doped SrZrO3 nanostructures as photocatalyst: Solid-state synthesis and UV-light driven eradication of thymol blue dye. Mater. Res. Bull.183, 113184 (2025). [Google Scholar]
- 46.Zeba, I. et al. First-principles computation of magnesium doped CaZrO3 perovskite: A study of phase transformation, bandgap engineering and optical response for optoelectronic applications. Solid State Commun.313, 113907 (2020). [Google Scholar]
- 47.Tanwar, N. et al. Eu-doped BaTiO3 perovskite as an efficient electrocatalyst for oxygen evolution reaction. J. Solid State Chem.317, 123674 (2023). [Google Scholar]
- 48.Liu, P., Nisar, J., Pathak, B. & Ahuja, R. Hybrid density functional study on SrTiO3 for visible light photocatalysis. Int. J. Hydrogen Energy37, 11611–11617 (2012). [Google Scholar]
- 49.Hossain, M. K., Ahmed, M. H., Khan, M. I., Miah, M. S. & Hossain, S. Recent Progress of Rare Earth Oxides for Sensor, Detector, and Electronic Device Applications: A Review. ACS Appl. Electron. Mater.3, 4255–4283 (2021). [Google Scholar]
- 50.Hossain, M. K. et al. A review on recent applications and future prospects of rare earth oxides in corrosion and thermal barrier coatings, catalysts, tribological, and environmental sectors. Ceram. Int.48, 32588–32612 (2022). [Google Scholar]
- 51.Liu, H., Dong, H., Meng, X. & Wu, F. First-principles study on strontium titanate for visible light photocatalysis. Chem. Phys. Lett.555, 141–144 (2013). [Google Scholar]
- 52.Guo, X. G. et al. Electronic band structure of Nb doped SrTiO3 from first principles calculation. Phys. Lett. A317, 501–506 (2003). [Google Scholar]
- 53.Wang, C., Qiu, H., Inoue, T. & Yao, Q. Band gap engineering of SrTiO 3 for water splitting under visible light irradiation. Int. J. Hydrogen Energy39, 12507–12514 (2014). [Google Scholar]
- 54.Zakeri, F. et al. Al-Ce co-doped BaTiO3 nanofibers as a high-performance bifunctional electrochemical supercapacitor and water-splitting electrocatalyst. Sci. Rep.14, 9833 (2024). [DOI] [PMC free article] [PubMed] [Google Scholar]
- 55.Huang, X. et al. Preparation of Zr-doped CaTiO3 with enhanced charge separation efficiency and photocatalytic activity. Trans. Nonferrous Met. Soc. China26, 464–471 (2016). [Google Scholar]
- 56.Regalado Vera, C. Y. et al. A mini-review on proton conduction of BaZrO 3 -based perovskite electrolytes. J. Phys. Energy3, 032019 (2021). [Google Scholar]
- 57.Hossain, M. K., Khan, M. I. & El-Denglawey, A. A review on biomedical applications, prospects, and challenges of rare earth oxides. Appl. Mater. Today24, 101104 (2021). [Google Scholar]
- 58.Hossain, M. K. et al. A Review on Optical Applications, Prospects, and Challenges of Rare-Earth Oxides. ACS Appl. Electron. Mater.3, 3715–3746 (2021). [Google Scholar]
- 59.Agrawal, A. et al. Oxygen vacancy mediated local symmetry breaking drives intense Raman modes in BaZrO3. Phys. Rev. B111, 104107 (2025). [Google Scholar]
- 60.Yin, Y. et al. Probing the role of Fe and Sr co-doped BaZrO3 for enhanced cathode performance in protonic ceramics fuel cells. Int. J. Hydrogen Energy139, 510–518 (2025). [Google Scholar]
- 61.Gaur, P., Pandey, B. K. & Srivastava, P. First-principle insight on the electronics and structural properties of lanthanide metal doped BaZrO3. J. Math. Chem.63, 150–160 (2025). [Google Scholar]
- 62.Datta, A. K. et al. Pressure induced tunable physical properties of cubic KHgF3 fluoro-perovskite: A first principle study. Inorg. Chem. Commun.170, 113424 (2024). [Google Scholar]
- 63.Hossain, M. K. et al. Design Insights into La 2 NiMnO 6 -Based Perovskite Solar Cells Employing Different Charge Transport Layers: DFT and SCAPS-1D Frameworks. Energy Fuels37, 13377–13396 (2023). [Google Scholar]
- 64.Uddin, M. S. et al. An In‐Depth Investigation of the Combined Optoelectronic and Photovoltaic Properties of Lead‐Free Cs 2 AgBiBr 6 Double Perovskite Solar Cells Using DFT and SCAPS‐1D Frameworks. Adv. Electron. Mater.10, (2024).
- 65.Datta, A. K. et al. DFT insights into bandgap engineering of lead-free LiMCl3 (M = Mg, Be) halide perovskites for optoelectronic device applications. Sci. Rep.15, 6944 (2025). [DOI] [PMC free article] [PubMed] [Google Scholar]
- 66.Clark, S. J. et al. First principles methods using CASTEP. Zeitschrift für Krist. - Cryst. Mater.220, 567–570 (2005). [Google Scholar]
- 67.Segall, M. D. et al. First-principles simulation: ideas, illustrations and the CASTEP code. J. Phys. Condens. Matter14, 2717–2744 (2002). [Google Scholar]
- 68.Perdew, J. P., Burke, K. & Ernzerhof, M. Generalized Gradient Approximation Made Simple. Phys. Rev. Lett.77, 3865–3868 (1996). [DOI] [PubMed] [Google Scholar]
- 69.Diao, X.-F., Tang, Y. & Xie, Q. Theoretical Analysis of Organic-Inorganic Metal Halide Perovskite Materials for Solar Cell. J. Nanoelectron. Optoelectron.14, 456–463 (2019). [Google Scholar]
- 70.Chakraborty, P., Datta, G. & Ghatak, K. The simple analysis of the Burstein-Moss shift in degenerate n-type semiconductors. Phys. B Condens. Matter339, 198–203 (2003). [Google Scholar]
- 71.Gibbs, Z. M., LaLonde, A. & Snyder, G. J. Optical band gap and the Burstein-Moss effect in iodine doped PbTe using diffuse reflectance infrared Fourier transform spectroscopy. New J. Phys.15, 075020 (2013). [Google Scholar]
- 72.Okada, Y. et al. Intermediate band solar cells: Recent progress and future directions. Appl. Phys. Rev.2, 021302 (2015). [Google Scholar]
- 73.Wang, Y. & Dou, W. Interband and intraband transitions, as well as charge mobility in driven two-band model with electron–phonon coupling. J. Chem. Phys.161, (2024). [DOI] [PubMed]
- 74.Hadi, M. A., Naqib, S. H., Christopoulos, S.-R.G., Chroneos, A. & Islam, A. K. M. A. Mechanical behavior, bonding nature and defect processes of Mo2ScAlC2: A new ordered MAX phase. J. Alloys Compd.724, 1167–1175 (2017). [Google Scholar]
- 75.Yue, H. et al. First-Principle Study on Correlate Structural, Electronic and Optical Properties of Ce-Doped BaTiO3. Crystals13, 255 (2023). [Google Scholar]
- 76.Rizwan, M. et al. Electronic and optical behaviour of lanthanum doped CaTiO 3 perovskite. Mater. Res. Express7, 015920 (2020). [Google Scholar]
- 77.Sang, D. K. et al. Electronic and Optical Properties of Two-Dimensional Tellurene: From First-Principles Calculations. Nanomaterials9, 1075 (2019). [DOI] [PMC free article] [PubMed] [Google Scholar]
- 78.Ben Nasr, T., Maghraoui-Meherzi, H., Ben Abdallah, H. & Bennaceur, R. First principles calculations of electronic and optical properties of Ag2S. Solid State Sci.26, 65–71 (2013). [Google Scholar]
- 79.Saha, S., Sinha, T. P. & Mookerjee, A. Structural and optical properties of paraelectric SrTiO 3. J. Phys. Condens. Matter12, 3325–3336 (2000). [Google Scholar]
- 80.Liu, X. et al. A high dielectric constant non-fullerene acceptor for efficient bulk-heterojunction organic solar cells. J. Mater. Chem. A6, 395–403 (2018). [Google Scholar]
- 81.Ahmed, T. Y., Aziz, S. B. & Dannoun, E. M. New photocatalytic materials based on alumina with reduced band gap: A DFT approach to study the band structure and optical properties. Heliyon10, e27029 (2024). [DOI] [PMC free article] [PubMed] [Google Scholar]
- 82.Galicia Hernandez, J. M., Fernandez-Escamilla, H. N., Guerrero Sanchez, J. & Takeuchi, N. Electronic and optical properties of the buckled and puckered phases of phosphorene and arsenene. Sci. Rep.12, 20979 (2022). [DOI] [PMC free article] [PubMed] [Google Scholar]
- 83.Shen, J.-X., Schleife, A., Janotti, A. & Van de Walle, C. G. Effects of La <math> <mrow> <mn>5</mn> <mi>d</mi> </mrow> </math> and <math> <mrow> <mn>4</mn> <mi>f</mi> </mrow> </math> states on the electronic and optical properties of <math> <msub> <mi>LaAlO</mi> <mn>3</mn> </msub> </math>. Phys. Rev. B94, 205203 (2016). [Google Scholar]
- 84.Bentour, H. et al. DFT study of Se and Te doped SrTiO3 for enhanced visible-light driven phtocatalytic hydrogen production. Opt. Quantum Electron.53, 589 (2021). [Google Scholar]
- 85.Butler, M. A. & Ginley, D. S. Prediction of Flatband Potentials at Semiconductor-Electrolyte Interfaces from Atomic Electronegativities. J. Electrochem. Soc.125, 228–232 (1978). [Google Scholar]
- 86.Hayatullah, et al. Physical Properties of CsSnM 3 (M = Cl, Br, I): A First Principle Study. Acta Phys. Pol. A124, 102–107 (2013). [Google Scholar]
- 87.Babu, K. E., Veeraiah, A., Swamy, D. T. & Veeraiah, V. First-Principles Study of Electronic Structure and Optical Properties of Cubic Perovskite CsCaF 3. Chinese Phys. Lett.29, 117102 (2012). [Google Scholar]
- 88.Dakin, T. W. Conduction and polarization mechanisms and trends in dielectric. Electr. Insul. Mag. IEEE22, 11–28 (2006). [Google Scholar]
- 89.Wemple, S. H. & DiDomenico, M. Behavior of the Electronic Dielectric Constant in Covalent and Ionic Materials. Phys. Rev. B3, 1338–1351 (1971). [Google Scholar]
- 90.Adar, R. M., Markovich, T., Levy, A., Orland, H. & Andelman, D. Dielectric constant of ionic solutions: Combined effects of correlations and excluded volume. J. Chem. Phys.149, 54504 (2018). [DOI] [PubMed] [Google Scholar]
- 91.Thahirunnisa, S. R. & Shameem Banu, I. B. Optical properties of novel ASiP2 (A=Ca, Sr) chalcopyrites: first-principle study. Appl. Phys. A124, 801 (2018). [Google Scholar]
- 92.Rahman, N. et al. First principle study of structural, electronic, optical and mechanical properties of cubic fluoro-perovskites: (CdXF3, X = Y, Bi). Eur. Phys. J. Plus136, 347 (2021). [Google Scholar]
- 93.Mir, S. A. & Gupta, D. C. Structural and mechanical stabilities, electronic, magnetic and thermophysical properties of double perovskite Ba2LaNbO6: Probed by DFT computation. Int. J. Energy Res.45, 14603–14611 (2021). [Google Scholar]
- 94.Born, M. On the stability of crystal lattices. I. Math. Proc. Cambridge Philos. Soc.36, 160–172 (1940). [Google Scholar]
- 95.Gao, J., Liu, Q.-J. & Tang, B. Elastic stability criteria of seven crystal systems and their application under pressure: Taking carbon as an example. J. Appl. Phys.133, (2023).
- 96.Helal, M. A. & Kojima, S. Structural instability and phase transition in BaZrO3 single crystals: Brillouin scattering and DFT study. Mater. Sci. Eng. B271, 115314 (2021). [Google Scholar]
- 97.Piskunov, S., Heifets, E., Eglitis, R. & Borstel, G. Bulk properties and electronic structure of SrTiO3, BaTiO3, PbTiO3 perovskites: An ab initio HF/DFT study. Comput. Mater. Sci.29, 165–178 (2004). [Google Scholar]
- 98.Song, X. et al. Thermophysical and mechanical properties of cubic, tetragonal and monoclinic ZrO2. J. Mater. Res. Technol.23, 648–655 (2023). [Google Scholar]
- 99.Khalil, R. M. A., Hayat, S., Hussain, M. I., Rana, A. M. & Hussain, F. DFT based first principles study of novel combinations of perovskite-type hydrides XGaH3 (X = Rb, Cs, Fr) for hydrogen storage applications. AIP Adv.11, 224104 (2021). [Google Scholar]
- 100.Hu, Z., Xu, W., Chen, C., Wen, Y. & Liu, L. First-Principles Calculations of the Structure Stability and Mechanical Properties of LiFeAs and NaFeAs under Pressure. Adv. Mater. Sci. Eng.2018, (2018).
- 101.Zhao, Y., Tian, J., Bai, G., Zhang, L. & Hou, H. First Principles Study on the Thermodynamic and Elastic Mechanical Stability of Mg2X (X = Si,Ge) Intermetallics with (anti) Vacancy Point Defects. Crystals10, 234 (2020). [Google Scholar]
- 102.Liu, L., Wang, D., Zhong, Y. & Hu, C. Electronic, Optical, Mechanical and Lattice Dynamical Properties of MgBi2O6: A First-Principles Study. Appl. Sci.9, 1267 (2019). [Google Scholar]
- 103.Kholil, M. I., Ali, M. S. & Aftabuzzaman, M. Structural, elastic, electronic and vibrational properties of BaRh2P2 and SrIr2As2 superconductors: A DFT study. J. Alloys Compd.740, 754–765 (2018). [Google Scholar]
- 104.Mayer, B. et al. Ab-initio calculation of the elastic constants and thermal expansion coefficients of Laves phases. Intermetallics11, 23–32 (2003). [Google Scholar]
- 105.Miah, M. K. et al. Comprehensive study on the physical properties of tetragonal La T Ge3 ( T = Rh, Ir, or Pd) compounds: An ab initio investigation. AIP Adv.11, (2021).
- 106.Hachemi, A., Hachemi, H., Ferhat-Hamida, A. & Louail, L. Elasticity of SrTiO 3 perovskite under high pressure in cubic, tetragonal and orthorhombic phases. Phys. Scr.82, 025602 (2010). [Google Scholar]
- 107.Parvin, F. & Naqib, S. H. Structural, elastic, electronic, thermodynamic, and optical properties of layered BaPd2As2 pnictide superconductor: A first principles investigation. J. Alloys Compd.780, 452–460 (2019). [Google Scholar]
- 108.Zhai, H., Li, X. & Du, J. First-Principles Calculations on Elasticity and Anisotropy of Tetragonal Tungsten Dinitride under Pressure. Mater. Trans.53, 1247–1251 (2012). [Google Scholar]
- 109.Hill, R. The Elastic Behaviour of a Crystalline Aggregate. Proc. Phys. Soc. Sect. A65, 349–354 (1952). [Google Scholar]
- 110.Namisi, M. M., Musembi, R. J., Mulwa, W. M. & Aduda, B. O. DFT study of cubic, tetragonal and trigonal structures of KGeCl3 perovskites for photovoltaic applications. Comput. Condens. Matter34, e00772 (2023). [Google Scholar]
- 111.Habib, A. et al. Insight into the Exemplary Physical Properties of Zn-Based Fluoroperovskite Compounds XZnF3 (X = Al, Cs, Ga, In) Employing Accurate GGA Approach: A First-Principles Study. Mater. (Basel).15, 2669 (2022). [DOI] [PMC free article] [PubMed] [Google Scholar]
- 112.Pugh, S. F. XCII. Relations between the elastic moduli and the plastic properties of polycrystalline pure metals. London, Edinburgh. Dublin Philos. Mag. J. Sci.45, 823–843 (1954). [Google Scholar]
- 113.Foletti, A. I., Cruz, J. S. & Vassilopoulos, A. P. Fabrication and curing conditions effects on the fatigue behavior of a structural adhesive. Int. J. Fatigue139, 105743 (2020). [Google Scholar]
- 114.Razzaq, M. A. & Islam, T. A. Optoelectronic study of double perovskite Rb2SnBr 6: A first principles calculations. Glob. J. Mater. Sci. Eng.2, 1–5 (2020). [Google Scholar]
- 115.Naeem, S., Murtaza, G., Khenata, R. & Khalid, M. N. First principle study of CsSrM3 (M=F, Cl). Phys. B Condens. Matter414, 91–96 (2013). [Google Scholar]
- 116.Liu, X. & Fu, J. Electronic and elastic properties of the tetragonal anatase TiO2 structure from first principle calculation. Optik (Stuttg).206, 164342 (2020). [Google Scholar]
- 117.Liu, X. & Fu, J. First principle study on electronic structure, elastic properties and debye temperature of pure and doped KCaF3. Vacuum179, 109504 (2020). [Google Scholar]
- 118.Mubarak, A. A. & Tariq, S. The optoelectronic application of CsSnI3 upon substitution with Pb: A DFT approach. Int. J. Quantum Chem.123, e27133 (2023). [Google Scholar]
- 119.Zhou, Y., Xiang, H., Lu, X., Feng, Z. & Li, Z. Theoretical prediction on mechanical and thermal properties of a promising thermal barrier material: Y4Al2O9. J. Adv. Ceram.4, 83–93 (2015). [Google Scholar]
Associated Data
This section collects any data citations, data availability statements, or supplementary materials included in this article.
Data Availability Statement
The datasets generated and/or analysed during the current study are not publicly available as the data also forms part of an ongoing study but are available from the corresponding author upon reasonable request.