

Abstract
Duchenne muscular dystrophy (DMD) is a congenital X-linked myopathy caused by lack of dystrophin protein expression. In DMD, the expression of many dystrophin-associated proteins (DAPs) is reduced along the sarcolemmal membrane, but the same proteins remain concentrated at the neuromuscular junction where utrophin, a dystrophin homologue, is expressed [Matsumura, K., Ervasti, J. M., Ohlendieck, K., Kahl, K. D. & Campbell, K. (1992) Nature (London) 360, 588–591]. This outcome has led to the concept that ectopic expression of a “synaptic scaffold” of DAPs and utrophin along myofibers might compensate for the molecular defects in DMD. Here we show that transgenic overexpression of the synaptic CT GalNAc transferase in the skeletal muscles of mdx animals (mdx/CT) increases the expression of utrophin and many DAPs, including dystroglycans, sarcoglycans, and dystrobrevins, along myofibers. Protein expression of utrophin and DAPs was equal to or above that of wild-type mice. In addition, α-dystroglycan was glycosylated with the CT carbohydrate antigen in mdx/CT but not in mdx muscles. mdx/CT mice have little or no evidence of muscular dystrophy by several standard measures; Serum creatine kinase levels, percentage of centrally located myofiber nuclei, and variance in myofiber diameter in mdx/CT muscles were dramatically reduced compared with mdx mice. These data suggest that ectopic expression of the CT GalNAc transferase creates a functional dystrophin-related complex along myofibers in the absence of dystrophin and should be considered as a target for therapeutic intervention in DMD.
Duchenne muscular dystrophy (DMD) is an X-linked recessive disorder caused by mutations or deletions in the dystrophin gene that abrogate dystrophin protein expression (1–3). Loss of dystrophin protein in DMD (4) or in the mdx mouse model for DMD (5) also leads to the reduced expression of a complex of membrane proteins that either bind to or associate with dystrophin. Among these are cytoplasmic membrane-associated proteins, including syntrophins and dystrobrevins, and transmembrane glycoproteins, including the dystroglycans and sarcoglycans (for review, see ref. 6). Through a series of intermolecular interactions, this complex of proteins ultimately links laminins in the extracellular matrix to the actin cytoskeleton. Mutations in genes encoding most of these proteins cause some form of muscular dystrophy. Mutations in dystrophin cause DMD (7) and Becker muscular dystrophy (8), mutations in sarcoglycans cause forms of limb-girdle muscular dystrophy (for review, see ref. 9), mutations in laminin α2 cause a form of congenital muscular dystrophy (10), and mutations in dystrobrevin (11), dystroglycan (12) and proteins that alter dystroglycan glycosylation (13, 14) cause muscular dystrophy.
Although the loss of dystrophin reduces the expression of dystrophin-associated proteins along myofibers, most of these proteins are still highly concentrated at the neuromuscular junction (5). In addition, utrophin, a protein homologue of dystrophin (15), is expressed at the neuromuscular junction in both mdx and wild-type mice (5, 16). Davies and coworkers have shown that transgenic overexpression of utrophin can cause the reexpression of sarcoglycans and dystroglycans along the myofiber membrane and can significantly reduce the degree of muscular dystrophy in mdx mice (17–19). These experiments support the idea that extrasynaptic expression of protein homologues of dystrophin and the dystrophin-related glycoproteins could be useful targets for developing therapies for treating DMD. Mice lacking utrophin (utrn) and dystrophin (mdx) have much more severe muscular dystrophy than mice lacking dystrophin alone (20), which also suggests that utrophin may ameliorate the severity of dystrophy in mdx muscles. The recent demonstration that overexpression of a normally synaptic integrin (α7B) in skeletal muscles ameliorates muscular dystrophy in utrophin-deficient mdx mice (21) and that an agrin minigene inhibits muscular dystrophy in the dy/dy mouse model of congenital muscular dystrophy (22) provide more support for the notion that ectopic expression of synaptic proteins may be a useful strategy for the treatment of these and related disorders.
Here we show that overexpression of the CT GalNAc transferase in skeletal muscles inhibits muscular dystrophy in mdx mice. The CT GalNAc transferase is an enzyme that is confined to the neuromuscular junction in adult animals (23). This enzyme produces the terminal β1,4GalNAc linkage on the CT (cytotoxic T cell) carbohydrate antigen [GalNAcβ1,4[NeuAcα2,3]Galβ1(3GalNAc or 4GlcNAc-R) (24), which is also localized to the neuromuscular junction in adult animals (25). Preliminary studies from our laboratory suggested that cultured mdx myotubes made to overexpress the CT GalNAc transferase had altered utrophin distribution and were more resistant to membrane rupture caused by osmotic shock.‡ To test whether expression of the CT GalNAc transferase would have similar effects in vivo, we created transgenic mice that overexpress this enzyme in the skeletal muscles of mdx animals.
Experimental Procedures
Materials.
Monoclonal antibody to γ sarcoglycan (35DAG2/B5) was purchased from Nova Castra (Newcastle-upon-Tyne, U.K.). All other antibodies, lectins, and reagents were made in our laboratory, purchased, or obtained as described (23).
Transgenic Mice.
Mice expressing the CT GalNAc transferase (CT) in skeletal muscles were made as previously described (23). Muscle-specific expression was achieved by use of the human skeletal α-actin promoter (27). Transgenic protein expression occurred in all skeletal muscles described, but expression was not present in brain, spinal cord, thymus, heart, kidney, lung, intestine, liver, spleen, lymph nodes, pancreas, stomach, bladder, testes, or skin (23). CT mice were bred to mdx mice (The Jackson Laboratory) to create mdx/CT animals. Although CT and mdx/CT animals were smaller than their nontransgenic littermates, they appeared otherwise normal and had normal levels of motor activity. All experiments compared Wt and CT or mdx and mdx/CT age-matched littermates.
Serum Creatine Kinase Assays.
Mice were anesthetized with metafane vapor. Tails were nicked with a razor and ≈200 μl of blood was collected. Blood was allowed to clot for 1 h at 37°C. Clotted cells were centrifuged at 1,500 × g for 3 min and serum was collected and analyzed immediately without freezing. Creatine kinase assays were done with enzyme-coupled assay reagent from Sigma (CK10) according to the manufacturer's instructions. Absorbance at 340 nm was measured every 30 sec for 4 min at 25°C to calculate enzyme activity.
Histology.
For hematoxylin/eosin and immunofluorescence staining of thin sections, muscles were snap frozen in liquid nitrogen-cooled isopentane and sectioned at 6 μm on a cryostat. All staining and morphometry analysis was done as previously described (23, 25).
Immunoblotting.
Skeletal muscle proteins were solubilized, quantitated, and analyzed as described (23, 25). For immunoblots, 20 μg of protein was loaded for each condition and densities quantitated as before (23).
Lectin Precipitation.
Leg muscles were solubilized in buffer containing nonionic detergent as described (23). Extracted protein (150 μg) was added to 20 μl of Wisteria floribunda agglutinin (WFA) or wheat germ agglutinin (WGA) agarose overnight with shaking at 4°C. Precipitated proteins were washed extensively in solubilization buffer and then boiled in SDS sample buffer (23). Proteins were separated and blotted as described (25, 28). In all cases, carbohydrate-specific binding was confirmed by lack of precipitation in the presence of exogenous sugar (0.3 M GalNAc for WFA, 0.3 M GlcNAc for WGA).
Statistics.
All determinations of significance were done with Student's paired t test.
Results
Expression of the CT GalNAc Transferase in the Skeletal Muscles of mdx Mice Inhibits Muscular Dystrophy.
Transgenic mice that express the mouse CT GalNAc transferase (CT) in their skeletal muscles were created as described (23) and bred to mdx mice to create mdx/CT mice. Expression of the CT GalNAc transferase and CT carbohydrate antigen was compared in wild-type (Wt), CT, mdx, and mdx/CT mice by immunostaining (Fig. 1). In wild-type and mdx mice, the CT antigen and the CT GalNAc transferase were expressed at the neuromuscular junction, but were absent from extrasynaptic regions of myofibers, as seen (23, 25). The CT carbohydrate was present in small blood vessels in both Wt and mdx muscles, and some myofiber expression was occasionally evident in mdx mice. Introduction of the CT transgene led to high expression of both the CT GalNAc transferase and the CT antigen in CT and mdx/CT muscles, where the CT antigen was primarily expressed around myofibers (Fig. 1). Intracellular aggregates of CT staining were also observed in some myofibers. Although the level of CT GalNAc transferase varied from fiber to fiber, the level of CT carbohydrate antigen around CT and mdx/CT fibers was fairly uniform. mdx/CT muscles generally expressed more CT antigen than CT muscles. In addition, both mdx and mdx/CT muscles expressed a significant amount of diffuse intracellular staining for the CT GalNAc transferase.
Figure 1.
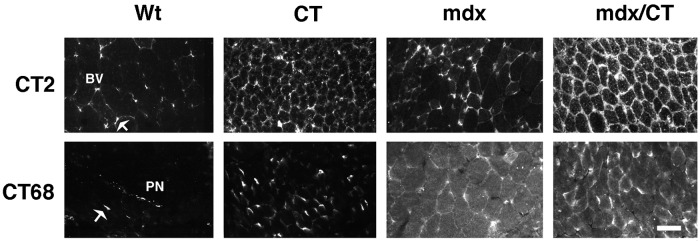
Expression of the CT carbohydrate antigen and the CT GalNAc transferase in transgenic (CT) and dystrophic (mdx) skeletal muscles. Skeletal muscles from 5-week-old mice that overexpress the CT GalNAc transferase (CT) in a wild-type (Wt) or mdx background were compared. Sections of gastrocnemius muscle were stained with antibodies to the CT antigen (CT2) or the CT GalNAc transferase (CT68) and costained α-bungarotoxin (not shown) to label neuromuscular junctions. CT2 stained small blood vessels (BV) and neuromuscular junctions (arrow) in Wt mice, but was expressed along myofibers in CT and mdx/CT transgenic mice. CT GalNAc transferase (CT68) was expressed at neuromuscular junctions and in peripheral nerves (PN) in Wt muscles. Most myofibers expressed the CT GalNAc transferase in CT and mdx/CT animals, whereas diffuse intracellular staining was also present in mdx and mdx/CT mice. (Bar = 25 μm.)
Hematoxylin/eosin staining of muscle sections taken from age-matched mdx and mdx/CT animals was done to assess muscle morphology at 5 weeks, 3 months, and 6 months of age (Figs. 2 and 3). Expression of the CT GalNAc transferase reduced myofiber diameter in transgenic myofibers for both CT and mdx/CT animals (Fig. 3A). This reduction was caused by an apparent inhibition of satellite cell fusion into myotubes during the early postnatal period and was maintained throughout adulthood (23). mdx muscles showed classic signs of muscular dystrophy, including hypertrophic fibers, small regenerating fibers, necrosis, centrally located nuclei, and occasionally fibrosis. An analysis of seven muscle groups from mdx/CT animals showed that they did not possess any of these characteristics of dystrophic muscles in mice as old as 6 months (Fig. 3).
Figure 2.

Comparison of skeletal muscles from mdx and mdx/CT animals. Sections of diaphragm (A and D), quadriceps femoris (B and E), and tibialis anterior (C and F) from mdx (A–F) and mdx/CT (A′–F′) animals were stained with hematoxylin/eosin at 5 weeks (A–C) or 6 months (D–F) of age. All muscles taken from mdx animals, with the exception of 5-week-old diaphragm, displayed increased central nuclei and variability in myofiber diameter. In addition, areas of necrosis and some regions of fibrosis were seen in 6-month-old mdx muscles, especially in the diaphragm. By contrast, muscles from mdx/CT animals displayed none of these characteristics of dystrophic muscles. (Bar = 25 μm.)
Figure 3.

Quantitation of reversal of dystrophic parameters in skeletal muscles of mdx/CT transgenic mice. Average myofiber diameter (A), coefficient of variance in myofiber diameter (B), and percentage of centrally located myofiber nuclei (C) were quantitated with hematoxylin/eosin-stained muscle sections from wild-type (Wt), transgenic (CT), dystrophic (mdx), and mdx/CT mice of various ages. Muscles analyzed (from left to right) were gastrocnemius, trapezius, diaphragm, triceps brachii, quadriceps femoris (vastus intermedius), tibialis anterior, and gluteus maximus. CT and mdx/CT myofibers were smaller on average than those of Wt and mdx muscles. The variance in myofiber diameter [(sd/mean) × 1000], was determined for n = 200 myofibers per muscle for four animals per condition. mdx mice had increased variance above the normal range (line at 250 or less) for all muscles (except 5-week-old diaphragm), whereas mdx/CT muscles were all within the normal range. Reduction in the coefficient of variance for mdx/CT myofibers compared with mdx myofibers was significant for gastrocnemius, trapezius, quadriceps, gluteus (P < 0.01 for all), and triceps (P < 0.05) at 5 weeks and for all muscles at 6 months (P < 0.001 for all). By 6 months, all mdx muscles had large increases in central nuclei (P < 0.001 compared with wild-type for all). mdx/CT mice had reduced central nuclei compared with mdx mice (P < 0.001 for all muscles except 5-week-old diaphragm), whereas levels between wild type, CT, and mdx/CT muscles were not significantly different (P > 0.05) at any age studied. Errors are standard errors of the mean for n = 250 fibers per muscle for three animals per condition.
To analyze this apparent inhibition of dystrophy further, we performed morphometric analysis of hematoxylin/eosin-stained muscle sections from mdx and mdx/CT littermates at 5 weeks, 3 months, and 6 months of age (Fig. 3). As expected, a significant reduction occurred in myofiber diameter between wild type and CT muscles and between mdx and mdx/CT muscles (Fig. 3A); however, the coefficient of variance in myofiber diameter was normal [250 or less (29)] in all mdx/CT muscles and was abnormal in all mdx muscles examined [except 5-week-old diaphragms, where dystrophy generally takes longer to occur (see ref. 30; Fig. 3B)]. Another indicator of muscular dystrophy is the increase in the percentage of centrally located myofiber nuclei (29). High concentrations of centrally located nuclei were observed in all mdx muscles examined (except 5-week-old diaphragms), and these levels were significantly reduced in all mdx/CT muscles (Fig. 3C). The percentage of central nuclei in mdx/CT muscles was always very near the 5% level that is considered normal for wild-type animals (29), and these levels did not increase with age.
Another assay for the presence of muscular dystrophy is evidence of increased creatine kinase activity in the serum (for review, see ref. 30). Accordingly, creatine kinase activity was measured on serum obtained from wild-type (Wt), CT, mdx, and mdx/CT mice of different ages (Fig. 4). mdx mice had an order of magnitude higher creatine kinase activity in their serum than wild-type mice. By contrast, both CT and mdx/CT transgenic mice had serum creatine kinase activity levels that were indistinguishable from wild-type mice (Fig. 4). Thus, although some microscopic evidence of dystrophy was present in mdx/CT muscles (Fig. 3C), as is also seen in mdx mice overexpressing utrophin (18), the results of the creatine kinase assay for dystrophy were completely normal.
Figure 4.

Expression of the CT transgene in mdx muscles inhibits elevations in serum creatine kinase activity. Serum creatine kinase activity was measured in Wt, CT, mdx, and mdx/CT animals at various ages. Serum creatine kinase activity was increased in mdx mice by an order of magnitude compared with Wt mice (P < 0.001 for all). Serum creatine kinase activity was reduced in mdx/CT mice (P < 0.001, compared with mdx, for all) and was not significantly different from wild-type levels (P > 0.05). For Wt, n = 40 (5 weeks) and 15 (6 months); CT, n = 32 (5 weeks) and 12 (6 months); mdx, n = 14 (5 weeks), 10 (3 months), and 14 (6 months); mdx/CT, n = 10 (5 weeks), 8 (3 months), and 14 (6 months).
Glycosylation of α-Dystroglycan with the CT Antigen and Expression of Dystrophin-Related and -Associated Proteins in mdx/CT Muscles.
Because expression of the CT GalNAc transferase significantly reduced the extent of muscular dystrophy in mdx mice, we wanted to begin to identify the potential molecular mechanisms that might explain this effect. We began by analyzing CT glycosylation in whole-cell extracts of Wt, CT, mdx, and mdx/CT muscles by using immunoblotting with the CT2 antibody (Fig. 5). As described, wild-type muscles have several CT2-positive bands (23); however, because most CT carbohydrate antigen expression in muscle is due to its presence in blood vessels (Fig. 1), these bands may not represent muscle glycoproteins. Muscles that overexpress the CT GalNAc transferase (CT and mdx/CT) had increased CT2 expression on several bands, whereas mdx muscles had some but not all of these increases as well (Fig. 5). We next analyzed the expression of the CT GalNAc transferase by staining with the CT68 antibody (Fig. 5). Because CT GalNAc transferase expression only occurs at the neuromuscular junction in adult skeletal muscles, CT68 expression was very difficult to observe by immunoblotting, but expression was greatly increased in CT and mdx/CT muscles. CT68 expression could be seen in Wt muscles if 60 μg of protein was loaded instead of 20 μg (data not shown). mdx muscles, like wild-type ones, expressed no detectable mature [≈70 kDa (24)], CT GalNAc transferase protein; however, an apparent 10-kDa proteolytic fragment was present (Fig. 5). This peptide fragment may explain the rather high intracellular staining observed in mdx and mdx/CT muscles (Fig. 1).
Figure 5.
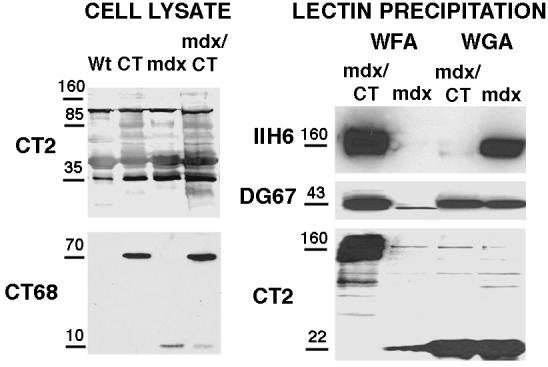
Characterization of CT and CT GalNAc transferase expression and glycosylation on α-dystroglycan with CT in mdx/CT muscles. 20 μg of protein from whole-cell lysates from wild-type (Wt), transgenic (CT), mdx, and mdx/CT muscles (gastrocnemius) were blotted with antibodies to the CT antigen (CT2) or the CT GalNAc transferase (CT68). For lectin precipitation, 150 μg of protein from nonionic detergent extracts of mdx and mdx/CT muscles was precipitated with WFA- or WGA-agarose. WFA binds to βGalNAc residues such as those on the CT antigen, while WGA typically binds GlcNAc. Precipitated proteins were then blotted with antibodies to α dystroglycan (IIH6), β dystroglycan (DG67), or the CT antigen (CT2). In cropped lanes, no other bands were present.
We had shown that α-dystroglycan can be glycosylated with the CT antigen in muscles from CT transgenic mice (23). To see if this glycosylation was the case in mdx/CT muscles, we precipitated proteins from nonionic detergent extracts of skeletal muscle by using WFA, a lectin that binds to βGalNAc, and WGA, a lectin that primarily binds GlcNAc and is commonly used to purify α-dystroglycan. WFA would be expected to recognize the CT antigen, because it is created by addition of a β1,4GalNAc linkage (24). WFA precipitated a large amount of α-dystroglycan from mdx/CT extracts. This band also could be blotted by the CT2 antibody. Although it is very difficult to use the CT antibodies in precipitation studies, because they are low-affinity anti-IgM molecules, we could elute α-dystroglycan from WFA and reprecipitate it with anti-CT antibodies (data not shown). β-Dystroglycan, which binds tightly to the α chain (31), was also precipitated from mdx/CT muscle, but contained little or no CT. By contrast, α-dystroglycan was precipitated specifically by WGA from mdx but not mdx/CT extracts, whereas β-dystroglycan and a low molecular weight (≈22 kDa) CT2-positive protein were precipitated in muscles from both animals. These data suggest that α-dystroglycan can contain the CT antigen in mdx/CT muscle.
The fact that the CT antigen is usually expressed at the neuromuscular junction (25) and that α-dystroglycan can be glycosylated with the CT antigen (23; Fig. 5) suggested that glycosylation of α-dystroglycan with CT may define its synaptic form. Therefore, we next tested whether ectopic expression of the CT antigen would alter the expression α-dystroglycan and proteins thought to associate with dystroglycan at the synapse. α- and β-dystroglycan, α-, β-, and γ-sarcoglycan, and dystrobrevin levels were reduced in mdx muscles, as shown (5), but were increased to or above levels found in wild-type mice in mdx/CT muscles (Fig. 6). In addition, expression of several dystrobrevin isoforms occurred specifically in CT and mdx/CT mice. These bands were consistent with the expression of dystrobrevin 3 or 4 (44 kDa) and dystrobrevin 5 (22 kDa), whereas bands consistent with dystrobrevin 1 (90 kDa) and 2 (65 kDa) were present in Wt, CT, and mdx/CT blots (32). Utrophin, which is normally synaptic (16), was expressed at much higher levels in CT and mdx/CT transgenic muscles than in wild-type muscles. Dystrophin, by contrast, was not present in mdx or CT/mdx mice, as would be expected. All mice had similar levels of the mature (53-kDa) form of desmin, but CT and mdx/CT animals also expressed a shorter 50-kDa product, whereas both mdx and CT muscles had increased levels of neural cell adhesion molecule (NCAM). Increases in utrophin (Fig. 6) and other DAPs (not shown) were equivalent at 5 weeks and 6 months of age. Immunostaining of skeletal muscles from mdx and mdx/CT mice showed reduced staining of DAPs in mdx muscles, as shown (5), whereas mdx/CT muscles expressed utrophin, α- and β-dystroglycan, α- and β-sarcoglycans, and dystrobrevins around myofibers (Fig. 7). Staining with γ-sarcoglycan antibody, which blotted well, was not reproducible (data not shown). Laminin α2 was expressed in the basal lamina surrounding myofibers in both mdx and mdx/CT mice, whereas dystrophin was not present (Fig. 7). NCAM was highly expressed in regenerating fibers in mdx muscles, but was relatively absent from nondystrophic areas, whereas NCAM was present around and sometimes within most mdx/CT myofibers. Desmin was expressed in both mdx and mdx/CT muscles, although mdx/CT muscles had significant higher intracellular expression, as previously reported for CT animals (23).
Figure 6.
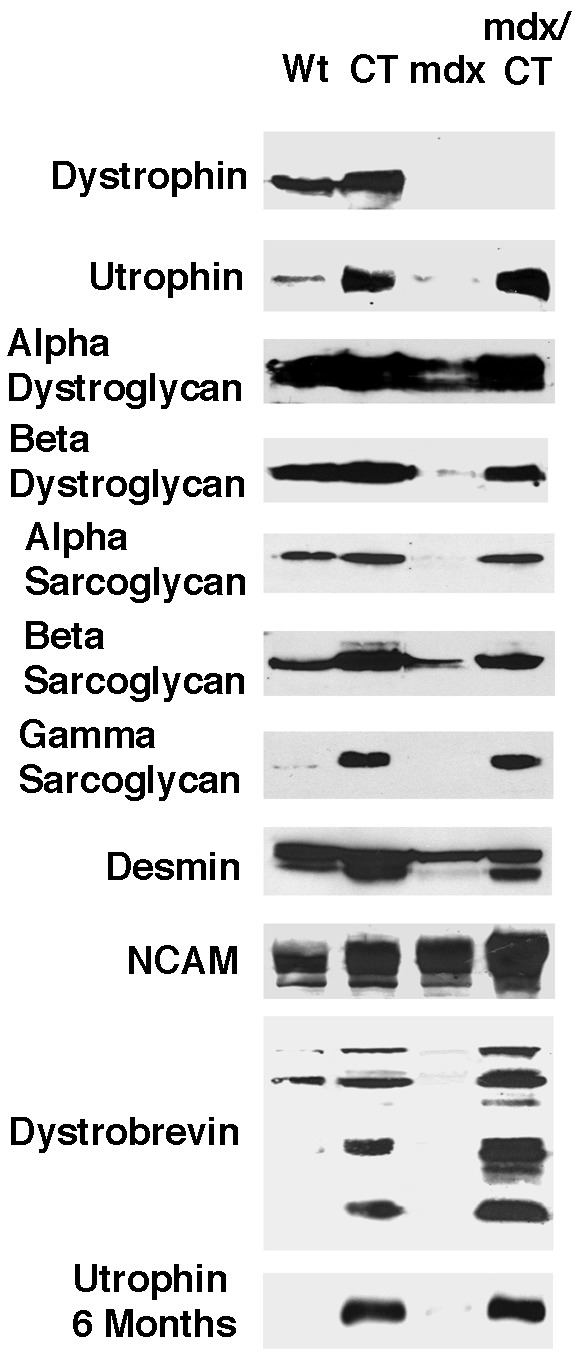
Rescue of utrophin, dystroglycan, sarcoglycan, and dystrobrevin expression in mdx/CT mice. Immunoblotting of 20 μg of muscle cell protein from 5-week-old wild-type (Wt), transgenic (CT), mdx, and mdx/CT animals showed that mdx/CT mice express levels of α- and β-dystroglycan, utrophin, α, β, and γ, sarcoglycan, and dystrobrevins that are equal to or higher than those found in Wt animals. Expression of all DAPs in mdx/CT were between −14% and + 30% of wild type levels, except for utrophin (+538%) and γ sarcoglycan (+660%), which were increased by very large amounts. Utrophin levels were also dramatically higher at 6 months of age. By contrast, all DAPs were reduced in expression in mdx muscles when compared with wild-type (−36% and −70% for α- and β-dystroglycan, −95%, −30%, and −50% for α, β, and γ sarcoglycan, and −78% for utrophin). Molecular weights shown are ≈400 kDa for utrophin and dystrophin. ≈160 kDa for α-dystroglycan, 43 kDa for β-dystroglycan, 50 kDa for α-sarcoglycan, 43 kDa for β-sarcoglycan, 35kDa for γ-sarcoglycan, 53 kDa for desmin (with 50 kDa lower band in CT and mdx/CT), ≈140–180 kDa for NCAM, and 90, 65, 44, and 22 kDa for dystrobrevin.
Figure 7.
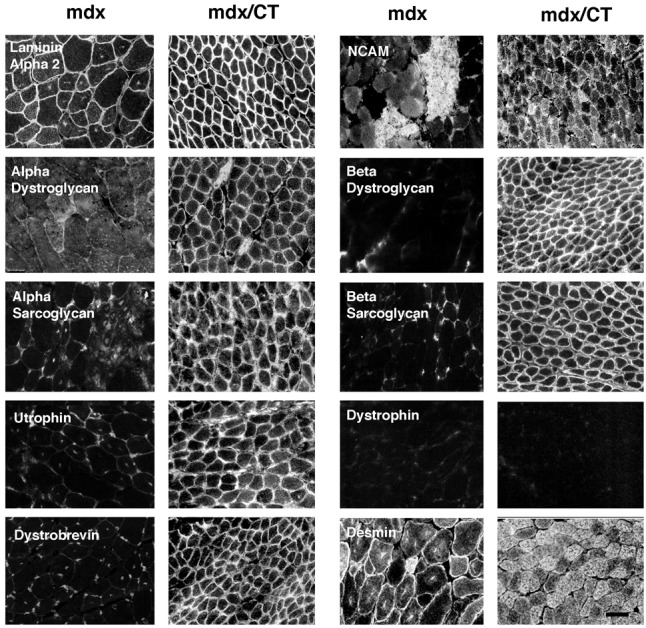
Immunostaining of dystrophin-associated proteins in mdx and mdx/CT mice. In mdx mice, very little if any expression of utrophin, α- and β-dystroglycan, α- and β-sarcoglycan, or dystrobrevin was evident in myofibers, In mdx/CT mice, by contrast, all of these proteins were highly expressed around and sometimes within myofibers. Laminin α2 was expressed in the basal lamina surrounding muscles from both mice. Desmin and NCAM were highly expressed in regenerating fibers in mdx muscles and were also highly expressed in mdx/CT muscles. (Bar = 25 μm.)
Discussion
A series of recent studies support the idea that muscular dystrophies, as a group, may be ameliorated by altering the expression of synaptic proteins that are not mutated in these diseases. Utrophin can rescue dystrophy in mdx mice (17–19), integrin α7B can ameliorate dystrophy in utrophin-deficient mdx mice (21), an agrin minigene can rescue dystrophy in dy/dy mice (23), and nitric oxide synthase can ameliorate dystrophy in mdx mice (33). We have provided further support for this contention here by showing that ectopic expression of the normally synaptic CT GalNAc transferase inhibits muscular dystrophy in mdx mice. The recovery of utrophin, dystroglycan, sarcoglycan, and dystrobrevin expression in transgenic mdx/CT mice suggests that ectopic CT glycosylation can mimic transgenic overexpression of utrophin (17–19) in inhibiting muscular dystrophy. Other mechanisms may also be at work, however, and analysis of CT transgenic utrophin-deficient mdx animals should aid in delineating the extent to which the effects we have observed are caused by utrophin.
The fact that α-dystroglycan can be glycosylated with the CT antigen specifically in CT transgenic (23) and mdx/CT muscles (Fig. 5) suggests that its ectopic glycosylation provides the nucleus for the extrasynaptic expression of dystrophin-related and dystrophin-associated proteins. It is striking that α-dystroglycan is not only specifically precipitated by βGalNAc-binding resins in mdx/CT animals, but that it seems to be the primary glycoprotein containing the CT carbohydrate. Although blots of whole-cell lysates with CT antibodies suggest that other proteins are also glycosylated with the CT antigen, precipitation studies found that at least one of these lower molecular weight bands was a proteolytic fragment of α-dystroglycan (23). Thus, some of these bands (Fig. 1) may also represent glycosylation of αdystroglycan with CT. Glycosylation of α-dystroglycan with the CT antigen is consistent with the fact that the mucin region of dystroglycan contains NeuAcα2,3Galβ1,4GlcNAcβ1,2Manα-O-Ser-linked structures in skeletal muscle (34). Such structures should be good substrates for the CT GalNAc transferase, which requires NeuAcα2,3Galβ1, -R for activity (24). Ectopic expression of the CT-containing form of α-dystroglycan may then allow association or expression of other dystroglycan-associated proteins along the myofiber membrane.
Two features of the CT GalNAc transferase make it especially enticing as a therapeutic target for DMD. First, the CT GalNAc transferase is an enzyme. As such, minor perturbations in CT transferase activity could lead to large changes in its function. By contrast, forced expression of dystrophin or utrophin, which are both very large structural proteins, will likely require high expression levels to be effective. Second, our results suggest that aberrant processing of the CT GalNAc transferase and glycosylation with the CT antigen occur in mdx mice (Fig. 5). Although it is unclear if these events contribute to muscle pathology or are consequences of them, it is possible that the CT GalNAc transferase may already be overexpressed in mdx muscles, but is simply not in a form that allows it to function properly.
Finally, the usage of the skeletal α-actin promoter, which turns genes on at an early stage of muscle development (35), has had an unwanted consequences in these experiments, namely reduced myofiber diameter as well as likely changes in neuromuscular structure (23). The failure of satellite cell fusion in CT muscles (23) should, if anything, make them more prone to dystrophy by eliminating their regenerative capacity. There are examples, however, where small fiber caliber is thought to correlate with diminished necrosis (26). Although such studies argue their point by comparing different muscles or developmental stages, this issue will need to be addressed by further transgenic experiments. Nevertheless, the rather striking inhibition of muscular dystrophy in mdx/CT animals, coupled with the recovery of expression of dystrophin-related and dystrophin-associated proteins, suggest that the CT GalNAc transferase should be given consideration in the design of therapies to treat DMD.
Acknowledgments
We thank John Lowe (Howard Hughes Medical Institute, University of Michigan), Kevin Campbell (Howard Hughes Medical Institute, University of Michigan), Leo Lefrancois (University of Connecticut), Jeffery Chamberlin (University of Washington), and Joshua Sanes (Washington University) for gifts of reagents used in these studies and Christine Kang and Anja Kammesheidt for technical assistance. This work was supported by grants from the Muscular Dystrophy Association, the March of Dimes, and the National Institutes of Health (NS37214 to P.T.M.).
Abbreviations
- DMD
Duchenne muscular dystrophy
- NeuAc
N-acetylneuraminic acid
- Gal
galactose
- Man
mannose
- GlcNAc
N-acetylglucosamine
- GalNAc
N-acetylgalactosamine
- WFA
Wisteria floribunda agglutinin
- WGA
wheat germ agglutinin
- CT
cytotoxic T cell
- DAPs
dystrophin-associated proteins
- NCAM
neural cell adhesion molecule
Footnotes
This paper was submitted directly (Track II) to the PNAS office.
Kammesheidt, A. & Martin, P. T. (1999) Soc. Neurosci. Abstr. 25, 1557.
References
- 1.Arahata K, Ishiura S, Ishiguro T, Tsukahara T, Suhara Y, Eguchi C, Ishihara T, Nonaka I, Ozawa E, Sugita H. Nature (London) 1988;333:861–866. doi: 10.1038/333861a0. [DOI] [PubMed] [Google Scholar]
- 2.Bonilla E, Samitt C E, Miranda A F, Hays A P, Salviati G, DiMauro S, Kunkel L M, Hoffman E P, Rowland L P. Cell. 1988;54:447–452. doi: 10.1016/0092-8674(88)90065-7. [DOI] [PubMed] [Google Scholar]
- 3.Hoffman E P, Fischbeck K H, Brown R H, Johnson M, Medori R, Loike J D, Harris J B, Waterston R, Brooke M, Speckt L, et al. N Engl J Med. 1988;318:1363–1368. doi: 10.1056/NEJM198805263182104. [DOI] [PubMed] [Google Scholar]
- 4.Ohlendieck K, Matsumura K, Ionasecu V V, Towbin J A, Bosch E P, Weinstein S L, Sernett S W, Campbell K P. Neurology. 1993;43:795–800. doi: 10.1212/wnl.43.4.795. [DOI] [PubMed] [Google Scholar]
- 5.Matsumura K, Ervasti J M, Ohlendieck K, Kahl K D, Campbell K P. Nature (London) 1992;360:588–591. doi: 10.1038/360588a0. [DOI] [PubMed] [Google Scholar]
- 6.Straub V, Campbell K P. Curr Opin Neurol. 1997;10:168–175. doi: 10.1097/00019052-199704000-00016. [DOI] [PubMed] [Google Scholar]
- 7.den Dunnen J Y, Frootscholten P M, Bakker E, Blonden L A, Ginjaar H B, Wapenaar M C, van Paassen H M, van Broekckhoven C, Pearson P L, van Ommen G J, et al. Am J Hum Genet. 1989;45:835–847. [PMC free article] [PubMed] [Google Scholar]
- 8.Beggs A H, Hoffman E P, Snyder J R, Arahata K, Specht L, Shapiro F, Angelini C, Sugita H, Kunkel L M. Am J Hum Genet. 1991;49:54–67. [PMC free article] [PubMed] [Google Scholar]
- 9.Lim L E, Campbell K P. Curr Opin Neurol. 1998;11:443–452. doi: 10.1097/00019052-199810000-00006. [DOI] [PubMed] [Google Scholar]
- 10.Helbling-Leclerc A, Zhang X, Topaloglu H, Cruaud C, Tesson F, Weissenbach J, Tome F M S, Schwartz K, Fardeau M, Tryggvason K, Guicheney P. Nat Genet. 1995;11:216–218. doi: 10.1038/ng1095-216. [DOI] [PubMed] [Google Scholar]
- 11.Grady R M, Grange R W, Lau K S, Maimone M M, Nichol M C, Stull J T, Sanes J R. Nat Cell Biol. 1999;1:215–220. doi: 10.1038/12034. [DOI] [PubMed] [Google Scholar]
- 12.Cote P D, Moukhles H, Lindenbaum M, Carbonetto S. Nat Genet. 1999;23:338–342. doi: 10.1038/15519. [DOI] [PubMed] [Google Scholar]
- 13.Grewal P K, Holzfeind P J, Bittner R E, Hewitt J E. Nat Genet. 1999;28:151–154. doi: 10.1038/88865. [DOI] [PubMed] [Google Scholar]
- 14.Hayashi Y K, Owawa M, Tagawa K, Noguchi S, Ishihara T, Nonaka I, Arahata K. Neurology. 2001;57:115–121. doi: 10.1212/wnl.57.1.115. [DOI] [PubMed] [Google Scholar]
- 15.Tinsley J M, Blake D J, Roche A, Fairbrother U, Riss J, Byth B C, Knight A E, Kendrick-Jones J, Suther G K, Love D R, Edwards Y H, Davies K E. Nature (London) 1992;360:591–592. doi: 10.1038/360591a0. [DOI] [PubMed] [Google Scholar]
- 16.Ohlendieck K, Ervasti J M, Matsumura K, Kahl S D, Leveille C J, Campbell K P. Neuron. 1991;7:499–508. doi: 10.1016/0896-6273(91)90301-f. [DOI] [PubMed] [Google Scholar]
- 17.Tinsley J M, Potter A C, Phelps S R, Fisher R, Trickett J I, Davies K E. Nature (London) 1996;384:349–353. doi: 10.1038/384349a0. [DOI] [PubMed] [Google Scholar]
- 18.Deconinck N, Tinsley J, De Backer F, Fisher R, Kahn D, Phelps S, Davies K, Gillis J-M. Nat Med. 1997;11:1216–1220. doi: 10.1038/nm1197-1216. [DOI] [PubMed] [Google Scholar]
- 19.Rafael J A, Tinsley J M, Potter A, Deconinck A E, Davies K E. Nat Genet. 1998;19:79–82. doi: 10.1038/ng0598-79. [DOI] [PubMed] [Google Scholar]
- 20.Grady R M, Teng H, Nichol M C, Cunningham J M, Wilkinson R S, Sanes J R. Cell. 1997;90:729–738. doi: 10.1016/s0092-8674(00)80533-4. [DOI] [PubMed] [Google Scholar]
- 21.Burkin D J, Wallace G Q, Nicol K J, Kaufman D J, Kaufman S J. J Cell Biol. 2001;152:1207–1218. doi: 10.1083/jcb.152.6.1207. [DOI] [PMC free article] [PubMed] [Google Scholar]
- 22.Moll J, Barzaghi P, Lin S, Bezakova G, Lochmuller H, Engvall E, Muller U, Ruegg M A. Nature (London) 2001;413:302–307. doi: 10.1038/35095054. [DOI] [PubMed] [Google Scholar]
- 23.Xia B, Hoyte K, Kammesheidt A, Deerinck T, Ellisman M, Martin P T. Dev Biol. 2002;242:58–73. doi: 10.1006/dbio.2001.0530. [DOI] [PubMed] [Google Scholar]
- 24.Smith P L, Lowe J B. J Biol Chem. 1994;269:15162–15171. [PubMed] [Google Scholar]
- 25.Martin P T, Scott L J B, Porter B, Sanes J R. Mol Cell Neurosci. 1999;13:105–118. doi: 10.1006/mcne.1999.0737. [DOI] [PubMed] [Google Scholar]
- 26.Karpati G, Carpenter S, Prescott S. Muscle Nerve. 1988;11:795–803. doi: 10.1002/mus.880110802. [DOI] [PubMed] [Google Scholar]
- 27.Muscat G E O, Kedes L. Mol Cell Biol. 1987;7:4089–4099. doi: 10.1128/mcb.7.11.4089. [DOI] [PMC free article] [PubMed] [Google Scholar]
- 28.Parkhomovskiy N, Kammesheidt A, Martin P T. Mol Cell Neurosci. 2000;15:380–387. doi: 10.1006/mcne.2000.0835. [DOI] [PubMed] [Google Scholar]
- 29.Banker B Q, Engel A G. In: Myology. Engel A G, Franzini-Armstrong C, editors. New York: McGraw–Hill; 1994. pp. 832–888. [Google Scholar]
- 30.De la Porte S, Morin S, Koenig J. Int Rev Cytol. 1999;191:99–148. doi: 10.1016/s0074-7696(08)60158-8. [DOI] [PubMed] [Google Scholar]
- 31.Ervasti J M, Campbell K P. Cell. 1991;66:1121–1131. doi: 10.1016/0092-8674(91)90035-w. [DOI] [PubMed] [Google Scholar]
- 32.Peters M F, Sadoulet-Puccio H M, Grady R M, Kramarcy N R, Kunkel L M, Sanes J R, Sealock R, Froehner S C. J Cell Biol. 1998;142:1269–1278. doi: 10.1083/jcb.142.5.1269. [DOI] [PMC free article] [PubMed] [Google Scholar]
- 33.Wehling M, Spencer M J, Tidball J G. J Cell Biol. 2001;155:123–131. doi: 10.1083/jcb.200105110. [DOI] [PMC free article] [PubMed] [Google Scholar]
- 34.Sasaki T, Yamada H, Matsumura K, Shimizu T, Kobata A, Endo T. Biochim Biophys Acta. 1998;1425:599–606. doi: 10.1016/s0304-4165(98)00114-7. [DOI] [PubMed] [Google Scholar]
- 35.Brennan K J, Hardeman E C. J Biol Chem. 1993;268:719–725. [PubMed] [Google Scholar]