

Abstract
We test the hypothesis that motivational and cognitive processes are linked by a specific neural system to reach maximal efficiency. We studied six normal subjects performing a working memory paradigm (n-back tasks) associated with different levels of monetary reward during an fMRI session. The study showed specific brain activation in relation with changes in both the cognitive loading and the reward associated with task performance. First, the working memory tasks activated a network including the dorsolateral prefrontal cortex [Brodmann area (BA) 9/46] and, in addition, in the lateral frontopolar areas (BA 10), but only in the more demanding condition (3-back task). This result suggests that lateral prefrontal areas are organized in a caudo-rostral continuum in relation with the increase in executive requirement. Second, reward induces an increased activation in the areas already activated by working memory processing and in a supplementary region, the medial frontal pole (BA 10), regardless of the level of cognitive processing. It is postulated that the latter region plays a specific role in monitoring the reward value of ongoing cognitive processes. Third, we detected areas where the signal decreases (ventral-BA 11/47 and subgenual prefrontal cortices) in relation with both the increase of cognitive demand and the reward. The deactivation may represent an emotional gating aimed at inhibiting adverse emotional signals to maximize the level of performance. Taken together, these results suggest a balance between increasing activity in cortical cognitive areas and decreasing activity in the limbic and paralimbic structures during ongoing higher cognitive processing.
Motivation (i.e., “that pushes one to act”) and executive processes (i.e., that provide the plan) are the two essential dimensions that determine one's goal-directed actions. The prefrontal cortex (PFC) is thought to play a central role in both dimensions. Converging data favor the existence of two parallel neural networks within the PFC: one, including the dorsolateral PFC (DLPFC), involved in working memory (WM) and planning and the other, including the ventral PFC (VPFC) and to some extent the ventral medial areas (MPFC), associated with reward sensitivity and motivation (1, 2). Nevertheless, one cannot conceive that these two neural networks are unrelated. To perform actions appropriate to a goal, an interface should be created between motivational and cognitive systems, and integrated behavioral responses require that these two networks have converging nodes.
One way to study interaction between cognition and motivation is to elaborate experimental paradigms that cross these two dimensions in one given series of tasks. For instance, a given complex cognitive task could be performed with different rewarding values associated to the level of performance. Only a few studies in humans have used this kind of paradigm (4–8). In the monkey, results obtained by recording some DLPFC neurons during WM tasks in association with different rewards indicate that context influences the level of activation of the DLPFC (9). This influence may be driven by neurons in the VPFC, given the putative role of the latter structure and recent data showing its connectivity with the DLPFC (10, 11).
Here, we tested the hypothesis that, even though Motivation and WM are mediated by different neural networks, a specific neural system should exist that bridges these two essential processes, to reach maximal efficiency. This hypothesis could be considered as validated if one detects: (i) a cerebral network specific to WM processing (i.e., regardless of the contextual value of the task); (ii) a cerebral network specific to the contextual value of the task but independent of the level of processing within WM; and (iii) areas in the WM networks modulated by reward associated with performance or areas activated by both the level of WM processing and the rewarding value of the tasks (i.e., where increase or decrease of hemodynamic signal is observed). To test this hypothesis, we used fMRI to study brain activation in normal subjects in the “n-back paradigm,” allowing us to manipulate the level of processing within WM and the values of real monetary reward associated with the performance of the task.
Materials and Methods
Subjects.
Six right-handed healthy volunteers (two women and four men, age ranging from 18 to 30 years old) with no history of neurological or psychiatric disease participated in this study. The experiment was approved by the Ethics Committee for Biomedical Research of the Salpêtrière Hospital.
Task Design.
Subjects performed a letter variant of the n-back procedure (12–14), according to which subjects were to indicate whether a letter presented on the screen (the “target” stimulus) was similar or different from a letter previously presented (the “cue stimulus”; see Fig. 1a). This procedure requires the participant to maintain and permanently update the relevant pieces of information in WM. Load and mental manipulation within WM were incremented by using three different levels of the n-back task: 1-back (maintenance of one piece of information in WM within the interval between the cue and the target stimuli) and 2- and 3-back (interposition of one or two distractors between the cue and the target stimuli, each distractor becoming a cue for the next trial). Letters were successively presented on a screen. Each presentation triggered a choice response: is this letter “different from” or “identical” to a previously presented letter? Subjects responded either by pressing the right or left button if the target was identical or different from the cue, irrespective of the case. Depending on which n-back condition (1-, 2-, or 3-back) was performed, the response was to match the current letter to the one seen 1, 2, or 3 presentation backward. In addition, subjects performed a control task (virtually without WM processes) called the 0-back task, which required subjects to simply identify a single prespecified letter (i.e., an “X”). All conditions consisted of a pseudorandom sequence of 12 consonants varying in case. The total duration of a given trial—from instruction to feedback—was 50 s. Trials were separated one from another by a 12-s interval (see Fig. 1b).
Figure 1.

(a) An example of a trial illustrating the schematic representation of the 3 WM (n-back) and the control (0-back) tasks. (b) Schematic representation of one run; in each run, there were two trials of each condition (0-, 1-, 2-, and 3-back). Rewarded conditions were pseudorandomly distributed across trials.
The n-back and control tasks were performed in association with different values of monetary reward. Therefore, the instruction panel delivered information regarding the type of cognitive task (0-, 1-, 2-, or 3-back) to be performed and information about the rewarding value of the ongoing trial. The symbols “0,” “10,” or “100” indicated that the trial would be no (0), weakly (10), or highly rewarded (100). However, subjects were not informed about the precise amount of money associated with these symbols to avoid the mental calculation of their putative gains. Subjects were told that the more accurate their responses, the more they would win. They could earn up to 2,000 French francs (≈285 U.S. dollars). Rewarded trials were randomly distributed among all of the trials. Each of the rewarded conditions was presented three times for each of the n-back tasks, whereas, the nonrewarded condition was presented four times. During fMRI acquisition, subjects were required to perform five separate runs. Each run was composed of two trials of each condition (0-, 1-, 2-, and 3-back; Fig. 1b). Practice trials were performed by the subjects outside and inside the scanner.
Functional Magnetic Resonance Imaging.
Visual stimuli were projected using an active matrix video projector (EGA mode, 70 Hz refresh rate; Eiki, Osaka, Japan) and presented on a screen viewed through mirror glasses. Two response buttons connected to a PC in the control room running EXPE 6 software (15) were given to the subjects. The subject's head was firmly positioned in a foam-rubber holder that minimized movement.
Functional images were acquired on a 3-Tesla whole-body scanner (Bruker), using T2* weighted gradient echo, echo-planar imaging sequence, sensitive to blood oxygen level-dependent (BOLD) contrast (repetition time 2,000 ms, echo time 40 ms, flip angle of 90°, matrix 64 × 64, field of view 220 × 220 mm). The images consisted of 30 contiguous axial slices (interleaved acquisition), with 5 mm thickness and 3.4 × 3.4 mm in plane resolution. To allow the equilibrium to reach its steady-state, four volumes corresponding to an 8-s delay were introduced before each run and were always discarded from analysis. Thus, during each run, 272 volumes of 30 slices were continuously acquired over a total duration of 544 s. High-resolution T1-weighted anatomical images were acquired in the same session (gradient-echo inversion-recovery sequence, repetition time 1,600 ms, echo time 5 ms, matrix 256 × 256 × 128, field of view 220 × 220 mm, slice thickness 1 mm).
Statistical Analysis.
All fMRI data were processed using the SPM99 software package (Wellcome Department of Cognitive Neurology, London) modified for fMRI (16). For each subject, anatomical images were transformed stereotactically with nine linear rigid transformations to the Talairach coordinate system (17). The functional scans, corrected for subject motion (18), were then normalized using the same transformations and smoothed with a 5-mm full-width half-maximum Gaussian filter. Then, all subjects were pooled together and statistical parametric maps (SPM) were computed using the general linear model with separate hemodynamic basis response function modeling MR signal responses of each period of the tasks (instruction, n-back, delay, feedback). Overall signal differences between runs were also modeled as covariates and a temporal cut-off of 1,072 s was applied to filter-subject-specific low-frequency drift, mostly related to subject biological rhythms and magnetic field drift. Estimates were obtained for each phase of the tasks, for each type of task and for each rewarding situation. An SPM {F} map was obtained, reflecting significant activated voxels according to the model used (P < 0.05). To test hypotheses about regionally specific condition effects, the estimates were compared using linear contrasts. The resulting set of voxel values for each contrast constituted an SPM {T} map. The resulting set of T values was then thresholded at P < 0.05, corrected for multiple comparisons across the volume. For areas with high anatomical a priori hypothesis, a P < 0.001 uncorrected threshold was also used.
Analyses were performed for estimates associated with the n-back phases of the tasks (i.e., excluding the period preceding and following the execution of the task). First, to determine the cerebral network associated with the n-back tasks, we only analyzed the nonrewarded conditions: the overall effect of the n-back was obtained by subtracting the 0-back to the 1-, 2-, and 3-back conditions. Effects of increase in load were measured by comparing the estimates of the different n-back tasks (1- vs. 0-back, 2- vs. 1-back, and 3- vs. 2-back). To extract the common cerebral network associated with all of the WM tasks, we used an inclusive mask technique aimed to determine the intersection of SPM {T} maps of the 1- vs. 0-back, 2- vs. 0-back, and 3- vs. 0-back comparisons. Brain areas where the signal significantly increased in a progressive mode from the 1- to the 3-back tasks were isolated by intersecting the SPM {T} maps of the 3- vs. 2-back, the 2- vs. 1-back, and the 1- vs. 0-back comparisons (“inclusive masking”). To detect deactivated areas associated with WM, we also compared the 0-back to the 1-, 2-, and 3-back.
To evince the cerebral regions activated in association with the monetary reward, we contrasted all of the high rewarded conditions to the nonrewarded conditions. To detect areas specifically activated by the reward, regardless of the n-back effect, we discarded activation related to the n-back by masking all voxels above threshold (P < 0.05 corrected; “exclusive masking”) activated by the contrast of n-back vs. control tasks. To show the areas commonly recruited by reward and WM, the exclusive mask was replaced by an inclusive one (i.e., selecting all voxels common to both reward and n-back effects).
To evince brain areas deactivated by the reward, we contrasted the nonrewarded to the highly rewarded conditions. Exclusive and inclusive masking were also applied using the results of the above contrast and those from the control vs. n-back comparison.
For each subject, signal-to-time curves were calculated for voxels with the highest T values in regions of interest (ROIs). These regions were chosen either because of their importance in the WM network [the DLPFC cortex; Brodmann area (BA) 9/46] or their putative role in motivation and emotion (the subgenual and MPFC [BA 25/32], the VPFC [BA 11/47], the frontopolar cortices [BA 10]) (2, 19, 20). These curves were obtained by dividing all data point value by the overall mean value of the subject's voxel signal. Curves obtained were then averaged across subjects to obtain a mean time course of fMRI signal for each cognitive task and reward value.
Response accuracy and reaction time were recorded. Both data were entered into repeated-measure ANOVAs with load (0-, 1-, 2-, and 3-back) or reward (high, low, and no reward) as within-subject factor.
Results
n-Back Tasks Without Monetary Reward.
Behavioral data.
The ANOVA showed a significant effect of load on response accuracy [F(3,60) = 49, 12; P < 0.001] and reaction time [F(3,60) = 36,30; P < 0.001].
fMRI data, activation.
The overall positive effect of the n-back (1- + 2- + 3-back vs. 0-back comparison) revealed a network including the intraparietal sulci (BA 7/39/40), the premotor (BA 6), the lateral and the ventral prefrontal cortices (BA 9/10/44/45/46), and the cerebellum. Compared with the 0-back, the 1-back revealed bilateral activation in the intraparietal sulcus (BA 7/40), the supplementary motor area (SMA; BA 6), the lateral premotor cortex (BA 6), the DLPFC cortex (BA 9), and the anterior insula. The 2- vs. 1-back comparison showed the same activated areas but at a larger extent, particularly in the DLPFC (BA 9/46). Activation was also observed in the left inferior PFC (BA 44/45), the fusiform gyrus (BA 37), and the cerebellum. The comparison of the 3- to the 2-back showed a large bilateral increase of activity extended, in its lateral aspect, from superior parietal lobule (BA 7) to the superior frontal gyrus (BA 9/10) and, in its medial aspect, to the MPFC (BA 6/8/10) and the anterior cingulate cortex (ACC; BA 32). All of the areas activated by the 1-back were included in the other WM tasks—namely, the parietal, premotor, and prefrontal cortices. Time-course curves in the DLPFC demonstrated the progressive increase of the hemodynamic signal associated with the increase in load (1-, 2-, and 3-back; Fig. 2a).
Figure 2.

Averaged fMRI signal time-course curves for selected voxels in (a) the right DLPFC (signal increased with task difficulty), (b) the SGPFC (signal decreased with task difficulty; ♦, 0-back; ■, 1-back; ▴, 2-back; ▵, 3-back); (c) the left lateral frontal pole and (d) the left rostral DLPFC (where signal increased with the increase of rewarding value); (e) the ventral striatum; and (f) the MPFC (where the signal decreased with the increase of rewarding valued; ♦, high reward; ●, low reward; ▵, no reward). Gray area corresponds to the n-back period per se. The time-scale unit is expressed as TR (repetition time; 2 s per TR).
fMRI data, deactivation.
Areas deactivated were assessed by contrasting the 0-back to the 1 + 2 + 3-back conditions. This contrast showed areas deactivated in the anterior MPFC (BA 10/11), the VPFC (BA 11/47), and the anterior insula. The amygdala, the hippocampus, the temporal pole (BA 20), and the posterior cingulate cortex (BA 23/24) were also deactivated, as well as the ventral striatum and the subgenual PFC (SGPFC; BA 25), but at a lower threshold (P < 0.001 uncorrected; Figs. 2b and 3).
Figure 3.
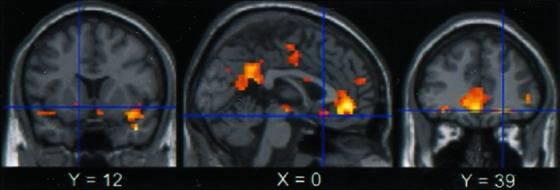
Cerebral deactivation associated with the increase of difficulty, as observed when the control task is compared with all of the working memory tasks (P < 0.001 uncorrected), superimposed on two coronal slices (y = 12 and y = 39) and one sagittal slice (x = 0). Deactivation can be observed in the ventral striatum (Left), in the SGPFC (Center), in the VPFC, and in the ACC (Right).
n-Back with Monetary Reward.
Behavioral data.
No significant effect of reward on response accuracy [F(2,60) = 0,73; P = 0.49] and reaction time [F(2,60) = 0.03; P = 0.96] was observed.
fMRI data, activation.
Exclusive mask (i.e., the detection of areas specifically activated by the reward effect) allowed us to isolate medial and polar PFC (BA 10), the posterior cingulate (BA 31), the middle temporal gyrus (BA 21), the body of the right caudate nucleus, and the cerebellum. At a lower threshold (P < 0.001 uncorrected), additional activation was found in the posterior aspect of the ACC (BA 24/32), the right hippocampus, the left superior temporal gyrus (BA 42), and the body of the left caudate nucleus (Table 1, Fig. 4a). Time curves of signal changes in the medial frontal pole (BA 10) showed a progressive increase of the hemodynamic signal associated with the increase of the rewarding value (no, low, or high reward; Fig. 2 c and d).
Table 1.
Activation and deactivation associated with reward
| Specific
|
Common
|
||||||||||||
|---|---|---|---|---|---|---|---|---|---|---|---|---|---|
| Brain area | BA | Stereotaxic
coordinates
|
T score | Brain area | BA | Stereotaxic
coordinates
|
T score | ||||||
| x | y | z | x | y | z | ||||||||
| Positive reward effect | |||||||||||||
| Cerebellum | R | 3 | −75 | 18 | 6.02 | Middle frontal gyrus | L | 10/46 | −39 | 54 | 12 | 6.35* | |
| Mesial frontal cortex | 10 | 0 | 57 | 0 | 5.90* | Parieto-occipital sulcus | R | 19 | 21 | −66 | 39 | 5.59* | |
| Superior frontal gyrus | L | 10 | −15 | 63 | 9 | 5.63* | Cerebellum | R | 48 | −51 | −21 | 5.22* | |
| Cerebellum | L | −54 | −57 | −18 | 5.86* | Cerebellum | L | −54 | −60 | −15 | 5.11* | ||
| Precuneus | R | 31 | 15 | −63 | 27 | 5.23* | Superior/middle frontal gyrus | R | 10 | 24 | 48 | 0 | 5.00* |
| Middle temporal gyrus | R | 21 | 57 | −42 | −12 | 5.09* | Middle frontal gyrus | L | 46 | −48 | 42 | 15 | 4.94* |
| Caudate nucleus | R | 15 | 3 | 24 | 4.98* | Inferior frontal gyrus | L | 44 | −60 | 12 | 27 | 4.39 | |
| Caudate nucleus | L | −18 | 9 | 24 | 4.06 | ACC | L | 32 | −3 | 27 | 33 | 4.20 | |
| Hippocampus | R | 33 | −27 | −18 | 4.59 | Inferior frontal gyrus | L | 10/44 | −48 | 48 | 0 | 4.07 | |
| Posterior ACC | L | 24/32 | −3 | 24 | 33 | 4.47 | Middle frontal gyrus | L | 9/46 | −33 | 51 | 27 | 3.77 |
| Superior temporal gyrus | L | 42 | −63 | −9 | 12 | 4.43 | |||||||
| Negative reward effect | |||||||||||||
| Hippocampus | L | −27 | −24 | −15 | 6.83* | Mesial frontal cortex | L | 10/32 | −12 | 45 | −6 | 6.84* | |
| Insula | R | 36 | −6 | 18 | 6.56* | Mesial frontal cortex | R | 10/32 | 6 | 42 | −3 | 5.93* | |
| Temporal pole | L | 21 | −48 | 6 | −24 | 6.56* | Temporal pole | L | 21 | −48 | 6 | −27 | 5.04* |
| Superior/middle frontal gyrus | L | 11 | −9 | 39 | −9 | 6.51* | Orbital sulcus | L | 11/47 | −27 | 39 | −12 | 4.75 |
| Middle temporal gyrus | R | 22 | 45 | −30 | 3 | 6.42* | Temporal pole | R | 21 | 42 | 6 | −30 | 4.02 |
| Hippocampus | R | 24 | −27 | −18 | 6.18* | Hippocampus | R | 36 | 3 | −18 | 3.71 | ||
| Orbital sulcus | L | 11 | −18 | 45 | −9 | 6.18* | |||||||
| Parital-occipital junction | R | 39 | 33 | −54 | 24 | 5.83* | |||||||
| Orbital gyrus | L | 47/11 | −27 | 24 | −6 | 5.60* | |||||||
| Anterior insula | L | −27 | 24 | −6 | 5.60* | ||||||||
| SGPFC/ventral striatum | 25 | 0 | 9 | −12 | 5.54* | ||||||||
| Insula | R | 51 | −3 | −12 | 5.09* | ||||||||
| Superior frontal gyrus | R | 8 | 27 | 3 | 42 | 4.85* | |||||||
| ACC | L | 24/32 | −12 | 39 | 6 | 4.69 | |||||||
| Superior frontal sulcus | L | 8 | −21 | 18 | 39 | 4.25 | |||||||
| Superior frontal sulcus | R | 8 | 12 | 45 | 36 | 4.08 | |||||||
ACC, anterior cingulate cortex; threshold, P < 0.001 uncorrected (T > 3.09);
, P < 0.05 corrected (T > 4.79).
Figure 4.
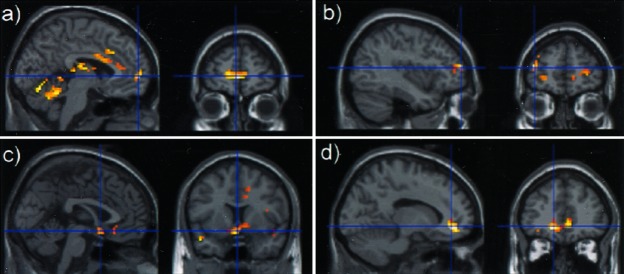
Cerebral activation and deactivation (P < 0.001 uncorrected) superimposed on sagittal views related to (a) activation associated with reward (slices are centered on the Talairach's coordinates: x = 0, y = 57, z = 0), (b) activation common to reward and WM (slices are centered on the Talairach's coordinates: x = 39, y = 54, z = 12), (c) deactivation associated with reward (slices are centered on the Talairach's coordinates: x = 0, y = 9, z = −12), and (d) deactivation common to the reward and WM (slices are centered on the Talairach's coordinates: x = −12, y = 42, z = −6).
Inclusive mask (i.e., areas activated by the increase of reward and load in the n-back tasks) isolated activation in the superior and middle frontal gyri (BA 10/46), the left middle frontal gyrus (BA 46), the occipital-parietal sulcus (BA 19), and the cerebellum. At a lower threshold (P < 0.001 uncorrected), activities extended to the left PFC (BA 44 and BA 9/46) and the ACC (BA 32) (Table 1, Fig. 4b).
fMRI data, deactivation.
Deactivation associated with reward (highly rewarded vs. nonrewarded conditions, “exclusive masking”) was observed in the medial and superior frontal gyrus (BA 10), the left VPFC (BA 11/47), the SGPFC (BA 25), the right superior frontal sulcus (BA 8), the right insula, the right middle and superior temporal gyri (BA 22), the temporal pole (BA 21), the hippocampus, and the ventral striatum. At a lower threshold (P < 0.001 uncorrected), the ACC (BA 24) and the left superior frontal sulcus (BA 8) were also deactivated (Table 1, Fig. 4c).
The common effect of reward and WM (inclusive masking) showed deactivation in the MPFC (BA 10/32) and in the left temporal pole (BA 21). At a lower threshold (P < 0.001, uncorrected), the left VPFC (BA 11/47), the right temporal pole (BA 21), and the right hippocampus were also deactivated (Table 1, Fig. 4d). Time curves of signal changes in the ventral striatum and the MPFC (BA 10/32) showed a decrease of the hemodynamic signal associated with the increase of the reward (no, low, or high reward; Fig. 2 e and f).
Discussion
Brain Areas Activated by Working Memory and by Associated Reward.
Congruent with the well defined neural architecture of WM (19), our study demonstrates activation in a cerebral network including: (i) a storage buffer mediated by the parietal cortex (BA 7/40) and at a lesser extent a subvocal rehearsal system mediated by the left inferior PFC (BA 44/45); and (ii) an executive component mediated by the DLPFC (BA 9/46). Also supportive of the previously published work (12, 21) is the progressive extension in size and intensity of activation in the above areas following the progressive increase in load and manipulation of information. Previous studies indicated that the DLPFC activation is related to the WM executive components (12–14, 21, 22), whereas the ACC activation may be associated partly with error monitoring (23) and/or attentional processes (24, 25).
In addition to these well recognized structures for WM, this study provides new insights that may help in the understanding of WM processing and its relation to the PFC. The more demanding WM task—the 3-back task—activated specific areas, in particular the lateral frontopolar region [i.e., the lateral portions of BA 10, which lie rostral to the DLPFC and the interim areas on the lateral borderline of area 10 (areas 10/46 and 9/10)] (26). It has recently been suggested that the lateral frontopolar areas are recruited when one needs to maintain a main goal while performing a concurrent task, such as a WM task (“cognitive branching”; ref. 27). The 3-back task is prototypic of this situation because subjects should at each moment: (i) decide which piece of information should be selected for the response, and (ii) keep in mind those to be used later and those to be deleted from WM. Our data, in accordance with previous observations in reasoning or planning tasks (for review, see ref. 28), suggest that the lateral frontopolar regions are recruited in tasks that maximize the demand in executive processing.
Coupling cognitive performance to monetary reward induced additional activation that provides useful information on the interaction between the neural network of reward and the one of WM. When the tasks associated with a high monetary rewarding value were compared with the same tasks with no money at stake, additional activation was observed in areas activated by WM (i.e., the DLPFC-BA 9/46). In these regions, an increase in activation resulted from the increase in the executive demand, as well as the rewarding value of the task (see Fig. 4 a and b). DLPFC is therefore not only activated by the cognitive aspect of the task but also modulated by changes of the contextual value. This hypothesis is supported by electrophysiological data obtained in monkeys that showed that a population of DLPFC neurons, responding to the cognitive aspects of a WM task, also had their activity modulated by the nature of the reward associated with the task (9, 10, 29). However, the signal that modulates these activities is most likely driven by brain areas that provide a contextual value to the ongoing task. Candidate areas are mainly those of the limbic system and more specially those in the VPFC (30, 31). In our study, areas activated by reward, regardless of the level of executive demand of the task, were not included in these limbic regions: activation was observed in the ACC (BA 24/32) and in the frontal pole (BA 10) where medial and lateral loci were found. We may consider that the maintenance of the stake of the task—i.e., its rewarding value—may act as another WM concurrent task efficient to activate the lateral frontopolar areas, as has already been discussed in view of the cognitive branching processing hypothesis (27). However, the extension of activation to the medial frontopolar areas may be interpreted relative to the contextual values of the tasks per se, because it was activated independently of the cognitive processes as shown by the exclusive masking procedure that we applied. In line with this view are recent functional studies showing that the MPFC (BA 32/10 and BA 10) is activated in association with reward (3, 8) and emotional processing (32). Moreover, several studies suggest that the MPFC (BA 10/32) intervenes in self-related (i.e., personally relevant contextual value) processing along an affective dimension (33–35). In addition, this area, strongly connected to the hypothalamus, also responds to autonomic markers (galvanic skin conductance responses) associated with reward during a guessing task (36). Taken together, these data highlight the role of the medial frontopolar area in monitoring the rewarding and contextual value of ongoing cognitive task, whereas the lateral frontopolar area insures the bridging between the higher cognitive aspects of goal-directed behaviors.
A closely interconnected limbic and paralimbic network including the VPFC and the MPFC, as well as the ventral striatum, is known to be essential to behavior adaptation in relation with changes of context induced by the reward (8, 37–39). Neurons in the VPFC of the monkey have been found to fire at different phases of tasks associated to reward (31, 40, 41), such as response to instruction, the anticipation and the delivery of the reward, and the response to reward (41, 42). In our study, analyses were focused on hemodynamic changes occurring during the time frame of the execution of the cognitive tasks and, consequently, no activation associated with reward was detected in these areas.
Brain Areas Deactivated as a Function of Cognitive Loading and of Variation in Monetary Reward.
According to Raichle and Colleagues (43), deactivation in specific brain areas can be observed during goal-directed behaviors and is likely assigned to a lower baseline of neuronal activity. In our study, deactivated areas belong to a paralimbic network, mainly the MPFC (SGPFC, BA 10/32) and the VPFC (BA 11/47) but also the hippocampus and the temporal pole. In the SGPFC, deactivation was inversely related to the increase in cognitive demand (the highest level of deactivation in the SGPFC corresponded to the 3-back task). Indeed, to be correctly performed, attentionally demanding cognitive tasks required the subjects to minimize the processing of competing signals such as emotional information or interfering thoughts. This inhibition of emotional processing (emotional gating) could result in decreased activity in areas that usually mediate emotional signals (44, 45). Recently, Simpson et al. (46, 47) have suggested that changes in activation in the ventro-medial PFC during cognitive tasks may not only be related to the concurrent attentional demand but also to the degree of anxiety induced by the task. It is likely that the 3-back task induced more performance anxiety than the two other WM tasks. One possible alternative explanation is that the deactivated areas are pathways to emotional signals (i.e., anxiety, fear of failure) that could negatively interfere with the performance of cognitive tasks. These areas should be deactivated to filter these confounding signals. Therefore, we suggest that a dynamic interplay is created between activated cognitive areas necessary to maintain a high level of cognitive performance (the network for WM and attention) and “affective” areas deactivated because they may process counterproductive signals interfering with performance.
In line with this hypothesis is the detection of deactivation of brain areas in rewarded conditions. Deactivation was observed in the VPFC, the SGPFC, and the ventral striatum and may also be considered as expressing an adaptive process. Indeed, when subjects performed the tasks, they had to inhibit the emotional signal associated with the contextual value to maximize their level of performance. Moreover, we found a deactivation in the same regions as those deactivated with the increase of executive demand, namely the MPFC and the VPFC. If one admits that one essential role of the positive reward is to act as behavioral reinforcer in simple tasks (48), the same reward could induce a counterproductive emotional signal during the processing of a more demanding cognitive task by increasing the level of performance anxiety associated with the task (46, 47). Therefore, the more one ignores the odd (i.e., seen as a negative interfering information), the more accuracy one could obtain. The fact that depressive patients with cognitive disorders exhibit deactivation in cognitive related areas (DLPFC and dorsal ACC) and activation in areas deactivated in our study, especially the SGPFC (44, 49), is in line with this interpretation. These changes were generally attributed to a particular allocation of cognitive resources with an excessive salience and abnormal attention to negative emotional signals (44, 50).
In summary, we described a neural network associated with changes in the contextual value of cognitive tasks. This network comprised activated areas common to those of the cognitive tasks, probably reflecting the modulation induced by the reward in areas necessary to elaborate the cognitive plan. Second, we also observed areas activated by the rewarding value of the task, regardless of the level of cognitive processing. These areas, particularly the medial frontal pole, may provide to these cognitive areas a signal associated with the contextual value of the task. Finally, we also found deactivated areas, mainly in paralimbic structures. Most of these areas were also deactivated with the increase of cognitive demand. A possible explanation for these deactivations is an emotional gating function necessary to free cognitive areas to maximize the level of performance and therefore to reach efficient behavior. Such a view appeals to further studies taking into account the subtle balance between activation in cortical cognitive areas and deactivation in the limbic system during ongoing cognitive processing.
Acknowledgments
We thank Prof. Martin Albert, Dr. Helen Mayberg, and Dr. Leon Tremblay for their helpful comments on previous versions of the manuscript. This work was supported by a grant from the Ministère de l'Education Nationale, de la Recherche et de la Technologie, and from Fondation pour la Recherche Médicale.
Abbreviations
- PFC
prefrontal cortex
- DLPFC
dorsolateral PFC
- MPFC
medial PFC
- SGPFC
subgenual PFC
- VPFC
ventral PFC
- WM
working memory
- BA
Brodmann area
References
- 1.Fuster J. The Prefrontal Cortex. 2nd Ed. New York: Raven; 1997. [Google Scholar]
- 2.Bechara A, Damasio H, Tranel D, Anderson S W. J Neurosci. 1999;18:428–437. doi: 10.1523/JNEUROSCI.18-01-00428.1998. [DOI] [PMC free article] [PubMed] [Google Scholar]
- 3.Thut G, Schultz W, Roelcke U, Nienhusmeier M, Missimer J, Maguire R P, Leenders K L. NeuroReport. 1997;8:1225–1228. doi: 10.1097/00001756-199703240-00033. [DOI] [PubMed] [Google Scholar]
- 4.Koepp M J, Gunn R N, Lawrence A D, Cunningham V J, Dagher A, Jones T, Brooks D J, Bench C J, Grasby P M. Nature (London) 1998;393:266–268. doi: 10.1038/30498. [DOI] [PubMed] [Google Scholar]
- 5.Elliot R, Friston K J, Dolan R J. J Neurosci. 2000;20:6159–6165. doi: 10.1523/JNEUROSCI.20-16-06159.2000. [DOI] [PMC free article] [PubMed] [Google Scholar]
- 6.Knutson B, Westdorp A, Kaiser E, Hommer D. NeuroImage. 2000;12:20–27. doi: 10.1006/nimg.2000.0593. [DOI] [PubMed] [Google Scholar]
- 7.Breiter H C, Aharon I, Kahneman D, Dale A, Shizgal P. Neuron. 2001;30:619–639. doi: 10.1016/s0896-6273(01)00303-8. [DOI] [PubMed] [Google Scholar]
- 8.O'Doherty J, Kringelbach M L, Rolls E T, Hornak J, Andrews C. Nat Neurosci. 2001;4:95–102. doi: 10.1038/82959. [DOI] [PubMed] [Google Scholar]
- 9.Watanabe M. Nature (London) 1996;382:629–632. doi: 10.1038/382629a0. [DOI] [PubMed] [Google Scholar]
- 10.Hikosaka K, Watanabe M. Cereb Cortex. 2000;10:263–271. doi: 10.1093/cercor/10.3.263. [DOI] [PubMed] [Google Scholar]
- 11.Groenewegen H J, Uylings H B. Prog Brain Res. 2000;126:3–28. doi: 10.1016/S0079-6123(00)26003-2. [DOI] [PubMed] [Google Scholar]
- 12.Braver T S, Cohen J D, Nystrom L E, Jonides J, Smith E E, Noll D C. NeuroImage. 1997;5:49–62. doi: 10.1006/nimg.1996.0247. [DOI] [PubMed] [Google Scholar]
- 13.Cohen J D, Perlstein W M, Braver T S, Nystrom L E, Noll D C, Jonides J, Smith E E. Nature (London) 1997;386:604–608. doi: 10.1038/386604a0. [DOI] [PubMed] [Google Scholar]
- 14.Smith E E, Jonides J. Cognit Psychol. 1997;33:5–42. doi: 10.1006/cogp.1997.0658. [DOI] [PubMed] [Google Scholar]
- 15.Pallier C, Dupoux E, Jeanin X. Behav Res Methods Instrum Comput. 1997;29:322–327. [Google Scholar]
- 16.Friston K J, Holmes A P, Poline J B, Grasby P J, Williams S C, Frackowiak R S, Turner R. NeuroImage. 1995;2:45–53. doi: 10.1006/nimg.1995.1007. [DOI] [PubMed] [Google Scholar]
- 17.Talairach J, Tournoux P. Coplanar Stererotactic Atlas of the Human Brain. New York: Thieme; 1988. [Google Scholar]
- 18.Friston K J, Ashburner J, Poline J B, Frith C D, Heather J D, Frackowiak R S J. Hum Brain Mapp. 1995;2:165–189. [Google Scholar]
- 19.Smith E E, Jonides J. Science. 1999;283:1657–1661. doi: 10.1126/science.283.5408.1657. [DOI] [PubMed] [Google Scholar]
- 20.Paradiso S, Johnson D L, Andreasen N C, O'Leary D S, Watkins G L, Boles Ponto L L, Hichwa R D. Am J Psychiatry. 1999;156:1618–1629. doi: 10.1176/ajp.156.10.1618. [DOI] [PubMed] [Google Scholar]
- 21.Smith E E, Jonides J, Marshuetz C, Koeppe R A. Proc Natl Acad Sci USA. 1998;95:876–882. doi: 10.1073/pnas.95.3.876. [DOI] [PMC free article] [PubMed] [Google Scholar]
- 22.Postle B R, Berger J S, D'Esposito M. Proc Natl Acad Sci USA. 1999;96:12959–12964. doi: 10.1073/pnas.96.22.12959. [DOI] [PMC free article] [PubMed] [Google Scholar]
- 23.Carter C S, Braver T S, Barch D M, Botvinick M M, Noll D, Cohen J D. Science. 1998;280:747–749. doi: 10.1126/science.280.5364.747. [DOI] [PubMed] [Google Scholar]
- 24.Pardo J V, Pardo P J, Janer K W, Raichle M E. Proc Natl Acad Sci USA. 1990;87:256–259. doi: 10.1073/pnas.87.1.256. [DOI] [PMC free article] [PubMed] [Google Scholar]
- 25.McDonald J J, Ward L M. Psychol Sci. 2000;11:167–171. doi: 10.1111/1467-9280.00233. [DOI] [PubMed] [Google Scholar]
- 26.Petrides M, Pandya D N. In: Handbook of Neurophysiology. Boller F, Grafman J, editors. Amsterdam: Elsevier Science; 1994. pp. 59–82. [Google Scholar]
- 27.Koechlin E, Basso G, Pietrini P, Panzer S, Grafman J. Nature (London) 1999;399:148–151. doi: 10.1038/20178. [DOI] [PubMed] [Google Scholar]
- 28.Christoff K, Gabrieli J D E. Psychobiology. 2000;28:168–186. [Google Scholar]
- 29.Leon M I, Shadlen M N. Neuron. 1999;24:415–425. doi: 10.1016/s0896-6273(00)80854-5. [DOI] [PubMed] [Google Scholar]
- 30.Damasio A R. Descarte's Error. New York: Avon; 1994. [Google Scholar]
- 31.Schultz W. Nat Rev Neurosci. 2000;1:199–207. doi: 10.1038/35044563. [DOI] [PubMed] [Google Scholar]
- 32.Lane R D, Reiman E M, Axelrod B, Yun L S, Holmes A, Schwartz G E. J Cognit Neurosci. 1998;10:525–535. doi: 10.1162/089892998562924. [DOI] [PubMed] [Google Scholar]
- 33.Posner M I, Rothbart M K. Philos Trans R Soc London B. 1998;353:1915–1927. doi: 10.1098/rstb.1998.0344. [DOI] [PMC free article] [PubMed] [Google Scholar]
- 34.Kircher T T, Senior C, Phillips M L, Benson P J, Bullmore E T, Brammer M, Simmons A, Williams S C, Bartels M, David A S. Brain Res Cognit Brain Res. 2000;10:133–144. doi: 10.1016/s0926-6410(00)00036-7. [DOI] [PubMed] [Google Scholar]
- 35.Luu P, Collins P, Tucker D M. J Exp Psychol Gen. 2000;129:43–60. doi: 10.1037//0096-3445.129.1.43. [DOI] [PubMed] [Google Scholar]
- 36.Critchley H D, Elliot R, Mathias C J, Dolan R J. J Neurosci. 2000;20:3033–3040. doi: 10.1523/JNEUROSCI.20-08-03033.2000. [DOI] [PMC free article] [PubMed] [Google Scholar]
- 37.Rolls E T. J Exp Biol. 1989;146:141–164. doi: 10.1242/jeb.146.1.141. [DOI] [PubMed] [Google Scholar]
- 38.Rolls E T, Hornak J, Wade D, McGrath J. J Neurol Neurosurg Psychiatry. 1994;57:1518–1524. doi: 10.1136/jnnp.57.12.1518. [DOI] [PMC free article] [PubMed] [Google Scholar]
- 39.Bechara A, Damasio H, Damasio A R. Cereb Cortex. 2000;10:295–307. doi: 10.1093/cercor/10.3.295. [DOI] [PubMed] [Google Scholar]
- 40.Hollerman J R, Tremblay L, Schultz W. Prog Brain Res. 2000;126:193–215. doi: 10.1016/S0079-6123(00)26015-9. [DOI] [PubMed] [Google Scholar]
- 41.Schultz W, Tremblay L, Hollerman J R. Cereb Cortex. 2000;10:272–284. doi: 10.1093/cercor/10.3.272. [DOI] [PubMed] [Google Scholar]
- 42.Tremblay L, Schultz W. J Neurophysiol. 2000;83:1864–1876. doi: 10.1152/jn.2000.83.4.1864. [DOI] [PubMed] [Google Scholar]
- 43.Raichle M E, MacLeod A M, Snyder A Z, Powers W J, Gusnard D A, Shulman G L. Proc Natl Acad Sci USA. 2001;98:676–682. doi: 10.1073/pnas.98.2.676. [DOI] [PMC free article] [PubMed] [Google Scholar]
- 44.Shulman G L, Corbetta M, Buckner R L, Raichle M E, Fiez J A, Miezin F M, Petersen S E. Cereb Cortex. 1997;7:193–206. doi: 10.1093/cercor/7.3.193. [DOI] [PubMed] [Google Scholar]
- 45.Mayberg H S, Liotti M, Brannan S K, McGinnis S, Mahurin R K, Jerabek P A, Silva J A, Tekell J L, Martin C C, Lancaster J L, Fox P T. Am J Psychiatry. 1999;156:675–682. doi: 10.1176/ajp.156.5.675. [DOI] [PubMed] [Google Scholar]
- 46.Simpson J R, Jr, Snyder A Z, Gusnard D A, Raichle M E. Proc Natl Acad Sci USA. 2001;98:683–687. doi: 10.1073/pnas.98.2.683. [DOI] [PMC free article] [PubMed] [Google Scholar]
- 47.Simpson J R, Jr, Drevets W C, Snyder A Z, Gusnard D A, Raichle M E. Proc Natl Acad Sci USA. 2001;98:688–693. doi: 10.1073/pnas.98.2.688. [DOI] [PMC free article] [PubMed] [Google Scholar]
- 48.Berns G S, McClure S M, Pagnoni G, Montague P R. J Neurosci. 2001;21:2793–2798. doi: 10.1523/JNEUROSCI.21-08-02793.2001. [DOI] [PMC free article] [PubMed] [Google Scholar]
- 49.Simpson J R, Ongur D, Akbudak E, Conturo T E, Ollinger J M, Snyder A Z, Gusnard D A, Raichle M E. J Cognit Neurosci. 2000;12:157–170. doi: 10.1162/089892900564019. [DOI] [PubMed] [Google Scholar]
- 50.Drevets W C. Ann NY Acad Sci. 1999;877:614–637. doi: 10.1111/j.1749-6632.1999.tb09292.x. [DOI] [PubMed] [Google Scholar]