

Abstract
Objective:
This study aimed to evaluate the association of conicity index (C-index), a marker of abdominal obesity, with hearing impairment (HI) in US adults using data from the National Health and Nutrition Examination Survey (NHANES).
Methods:
We conducted a cross-sectional investigation using data from nine NHANES cycles spanning from 2001 to 2018. The C-index was used as the independent variable, whereas HI—defined as a pure-tone average hearing threshold exceeding 25 dB HL—was the outcome measure. Multivariable logistic regression models were used to assess the association between C-index and HI, adjusting for potential confounders including age, sex, race/ethnicity, hypertension, diabetes, total cholesterol, haemoglobin and blood urea nitrogen. Dose–response relationships were evaluated using trend tests (P for trend) and restricted cubic spline (RCS) analysis. Subgroup analyses were performed to assess potential interaction effects.
Results:
A total of 7394 adults aged 20–69 were included. Higher C-index values were significantly associated with an increased prevalence of HI. In the fully adjusted model, each unit increase in C-index was associated with 7.35-fold higher odds of HI (95% CI: 3.03–17.82, P < 0.01). When stratified into tertiles, individuals in the highest tertile had a 57% higher likelihood of HI compared to the lowest tertile (Odds Ratio = 1.57, 95% Confidence Interval: 1.14–2.18, P < 0.01). RCS analysis indicated a significant non-linear association (P for non-linearity < 0.05) with an inflection point at a C-index of 1.17. Subgroup analysis revealed significant interaction effects of C-index with gender, diabetes and hypertension (P for interaction < 0.05) but not with age (P > 0.05).
Conclusion:
Higher C-index values are independently associated with greater odds of HI. Given the rising burden of obesity and its metabolic consequences, the C-index may serve as a practical tool for HI risk assessment, especially in populations with cardiometabolic risk factors.
Keywords: Conicity index, cross-sectional analysis, hearing impairment, obesity, NHANES
KEY MESSAGES
-
(1)
The conicity index (C-index) is a significant predictor of hearing impairment (HI), with higher values indicating increased odds of HI.
-
(2)
A non-linear association exists between the C-index and HI, with a risk inflection point at 1.17.
-
(3)
Subgroup analyses reveal significant interactions with gender, hypertension, and diabetes.
-
(4)
Monitoring the C-index could guide interventions to prevent HI in at-risk populations.
INTRODUCTION
Hearing impairment (HI) affects approximately 1.57 billion people worldwide and ranks as the fourth leading cause of disability.[1,2] Despite its impact, routine screening for HI remains infrequent due to high costs and a common perception of low urgency among affected individuals, leading to delayed diagnosis and treatment.[2,3]
Obesity, another major public health issue, has been strongly linked to metabolic and cardiovascular conditions, such as diabetes and hypertension, which have been identified as potential risk factors for HI.[4,5,6,7,8] Biological mechanisms underlying this association are well-supported; that is, obesity-related metabolic disorders may lead to reduced microvascular circulation, diminishing cochlear blood flow, damaging hair cells and ultimately leading to hypoxic injury.[9,10,11]
Fat distribution, rather than overall obesity, appears to play a critical role in metabolic health.[12,13,14] The conicity index (C-index) is an emerging anthropometric measure of abdominal obesity and offers a more refined assessment than body mass index, waist circumference (WC), or waist-to-hip ratio.[15] Higher C-index values are strongly associated with vascular dysfunction and cardiometabolic risks, which may impact hearing.[16,17,18] However, the association between C-index and HI remains unexplored.
To address this research gap, we conducted a cross-sectional analysis using nine National Health and Nutrition Examination Survey (NHANES) cohorts to investigate the C-index–HI association while controlling for key covariates related to vascular health, metabolism and auditory function.[19,20,21,22] Understanding this association may provide insights into preventive strategies for HI, particularly among individuals at risk for metabolic disorders.
MATERIALS AND METHODS
Study design and participant selection
This cross-sectional study used publicly available data from NHANES (https://wwwn.cdc.gov/nchs/nhanes/), which was conducted by the U.S. National Centre of Health Statistics (NCHS) and Centers for Disease Control and Prevention. The NHANES program employs a complex multi-stage probability sampling design to generate a dataset representative of the non-institutionalised US population. As NHANES data are publicly available and de-identified, additional ethical approval was not required.
Data from nine NHANES cycles (2001–2018) were included, and these cycles provided comprehensive audiometric and anthropometric data required for analysis. The inclusion criteria were as follows: adults aged 20–69 years (to focus on non-elderly adult HI); participants with complete audiometry data; availability of WC, weight, and height measurements for C-index calculation; and complete data for key covariates (age, gender, race, hypertension, diabetes, blood cholesterol, haemoglobin and urea nitrogen). The following strict exclusion criteria were applied: participants with missing or unreliable audiometric assessments; individuals with self-reported ear infections, exposure to ototoxic drugs, or a history of ear surgery; and participants with occupational noise exposure history (as noise-induced hearing loss could confound results). After implementing these criteria, 7394 eligible participants from an initial pool of 91,351 were included in the final analysis [[Figure 1].
Figure 1.
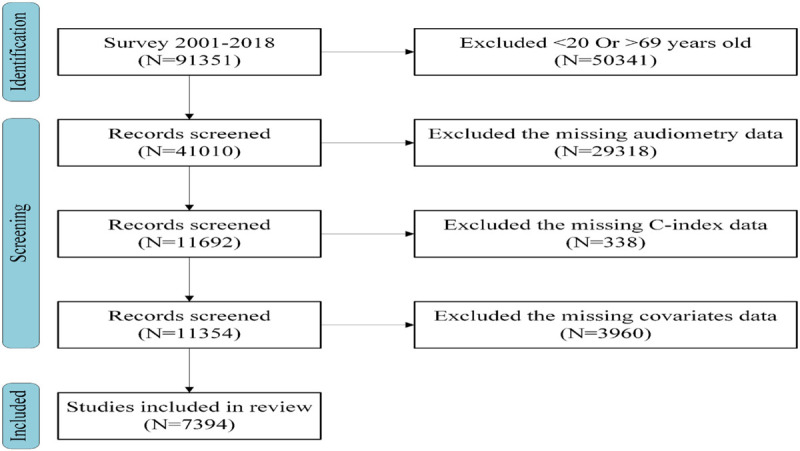
Flowchart of data enrolment in this study.
C-index measurement
The C-index, used as the exposure variable in this study, was calculated from WC, weight, and height measurements,[18] following the formula: 0.109−1 × WC (m) × [weight (kg)/height (m)]−1/2.[13] All anthropometric measurements were conducted by certified health technicians at a Mobile Examination Centre using standardised protocols.
Definition of HI
HI was defined as an average pure-tone hearing threshold exceeding 25 dB HL in the better-hearing ear, consistent with previous epidemiological studies.[23,24] Audiometric testing was conducted in a soundproof mobile unit by using a calibrated audiometer to measure air conduction thresholds at 0.5, 1, 2, 3, 4, 6 and 8 kHz. Instrumentation for the audiometry component included an Audiometric Research Tool (ART) system with standard TDH-49P headphones (Telephonics Corporation, CA, USA) and Etymotic EarTone 3A insert earphones (Lucid Hearing Holding Company, TX, USA). Data from the ART system were captured electronically and uploaded into the NHANES database automatically. To ensure accuracy, each ear was tested twice at 1 kHz to assess test reliability; if discrepancies >10 dB HL were observed, then additional verification was performed.[25,26]
Selection of covariates
A multivariate-adjusted model was developed to account for potential covariates. The following covariates were included in the analysis based on their biological relevance to both obesity and HI: (1) demographic variables: age, gender and race; (2) age: <44 years or ≥44 years; (3) race: Non-Hispanic White and Non-Hispanic Black or others and (4) health conditions: (i) hypertension and diabetes: based on the medical history filled in by the respondents themselves; (ii) blood cholesterol: measured using an enzymatic assay (normal range: <200 mg/dL); (iii) haemoglobin: analysed via a Beckman Coulter DxH 800 instrument (Beckman Coulter, Inc., USA), normal: 13.8–17.2 g/dL for men; 12.1–15.1 g/dL for women and (iv) urea nitrogen: quantified using high-performance liquid chromatography (normal: 2.5–7.1 mmol/L). The measured values for these biomarkers are cholesterol 77–545 mg/dL, haemoglobin 6.4–19.9 g/dL and urea nitrogen 0.71–28.2 mmol/L.
Statistical analysis
Continuous variables were first tested for normality using the Shapiro–Wilk test. Variables following a normal distribution were expressed as mean ± standard deviation (x̄ ± s), while non-normally distributed variables were presented as median and interquartile range (P25, P75). Categorical variables were expressed as frequencies and percentages.
Group comparisons for continuous variables were conducted using independent sample t-test for normally distributed data and Mann–Whitney U test for non-normally distributed data. For categorical variables, chi-square test was used.
Adjustments were made to account for clustering and stratification effects because of the complex multiple-stage probability sampling strategy design of the NHANES. To assess the robustness and predictive ability of our logistic regression models, we conducted model fitting evaluations: (1) Hosmer–Lemeshow test: used to evaluate the goodness-of-fit of the logistic regression models (P > 0.05 indicates a well-fitting model); (2) Akaike Information Criterion (AIC): a method of assessing how well a model fits the data it generates, with lower values indicating a better fit; (3) area under the Receiver Operating Characteristic curve (AUC): measures discrimination ability (values closer to 1.0 indicate stronger predictive power). The C-index values were categorised into tertiles, and binary logistic regression models were employed to evaluate the associations of the C-index with HI. Three progressively adjusted models were created for comprehensive analysis. Model 1 was left unadjusted. Model 2 was adjusted for demographic variables (age, gender, and race). Model 3 was adjusted for all covariates, including age, gender, race, diabetes, hypertension, blood cholesterol, haemoglobin and urea nitrogen. Analyses of subgroups defined by age, gender, hypertension and diabetes were conducted using the fully adjusted model. Interaction tests were performed to evaluate the degree of heterogeneity within these subgroups. Data analysis and drawing were conducted by using R 4.3.2 (University of Auckland, New Zealand) and DecisionLinnc1.0 software (Hangzhou Apes Information Technology Co., Ltd., China). A visual interface was used to facilitate data processing, analysis, and machine learning in DecisionLinnc1.0, a platform that unifies various programming language environments.[27] A two-tailed P-value < 0.05 was considered statistically significant.
RESULTS
Baseline characteristics of the study cohort
Among the 7394 individuals included, the mean age was 44.00 (31.00–56.00) years, with 20.85% overall prevalence of HI. The gender distribution was balanced, comprising 49.66% females and 50.34% males. Participants aged over 44 years accounted for 58.89% of the cohort, while those under 44 comprised 41.11%. Regarding racial distribution, 32.73% of participants were non-Hispanic whites, 23.72% were non-Hispanic blacks, and 43.55% belonged to other racial groups. Statistically significant differences (P < 0.01) were observed across gender, race, age, hypertension, diabetes, blood cholesterol, haemoglobin, urea nitrogen and C-index when stratified by hearing status. Males had a higher incidence of HI compared to females. The HI group was notably older and demonstrated higher rates of diabetes and hypertension. Additionally, this group exhibited elevated levels of blood cholesterol, haemoglobin, urea nitrogen and C-index values compared with those without HI. Details can be found in the supplementary material Table S1.
Association of the C-index with HI
Table 1 demonstrates a positive association of the C-index with HI in the fully adjusted model (odds ratio [OR] = 7.35, 95% confidence interval [CI]: 3.03–17.82), indicating that for each unit increasing in the C-index, the likelihood of experiencing HI increased by 7.35 times. According to the model fitting evaluation, a satisfactory fit was shown by the Hosmer–Lemeshow test (P = 0.399). The AIC for a fully adjusted model is 1245.32, which is lower than unadjusted models, indicating improved performance. The AUC is 0.82, indicating that the model demonstrates excellent discriminatory power in identifying individuals with HI.
Table 1.
Association of the C-index with HI
| Model 1 | Model 2 | Model 3 | ||||
|---|---|---|---|---|---|---|
|
|
|
|
||||
| C-index | OR (95% CI) | P-value | OR (95% CI) | P-value | OR (95% CI) | P-value |
| Continuous | 933.97 (476.28, 1845.76) | <0.001 | 9.94 (4.24, 23.33) | <0.001 | 7.35 (3.03, 17.82) | <0.001 |
| Tertile | ||||||
| Tertile 1 | Reference | Reference | Reference | Reference | Reference | Reference |
| Tertile 2 | 3.99 (3.19, 5.05) | <0.001 | 1.24 (0.96, 1.61) | 0.104 | 1.20 (0.93, 1.57) | 0.161 |
| Tertile 3 | 7.71 (5.90, 10.16) | <0.001 | 1.74 (1.27, 2.39) | 0.001 | 1.57 (1.14, 2.18) | 0.006 |
| P for trend | <0.001 | <0.001 | <0.001 | |||
C-index, conicity index; Model 1: no adjustment; Model 2: adjusted for age, gender, and race; Model 3: adjusted for all potential confounders.
Notes: OR, odds ratio; CI, confidence interval.
The C-index was analysed as a three-level categorical variable derived from a continuous variable. The results showed that individuals in the highest tertile had a higher incidence of HI compared to the lowest tertile (OR = 1.57, 95% CI: 1.14–2.18, P for trend <0.01). This trend reinforces the observation that elevated C-index levels correspond to greater odds of HI.
Non-linear correlation between C-index and HI
Restricted cubic spline (RCS) analysis was used to illustrate the correlation between the C-index and HI [[Figure 2]. The results revealed a significant non-linear positive correlation between the C-index and HI. A threshold effect analysis and identified an inflection point at a C-index of 1.17 in Model 3. The analysis showed that when the C-index exceeded 1.17, the risk of HI increased sharply.
Figure 2.

The correlation between HI and C-index.
Note: Restricted cubic spline showed a non-linear correlation between the C-index and HI. Solid yellow represented the fitted regression line; 95% CI was shown by the blue region; OR equal to 1 was indicated by a grey dashed line. C-index, conicity index; HI, hearing impairment.
Subgroup analyses
Subgroup analysis was conducted to investigate the complex correlation between C-index and HI across different categories of gender, age, diabetes and hypertension [Table 2]. The results indicated statistically significant interaction effects between the C-index and HI with respect to gender, diabetes and hypertension (P < 0.05); no significant interaction was found for age (P > 0.05). These findings highlight that the association of the C-index with HI varies across specific subgroups, particularly influenced by gender, the presence of diabetes, and hypertension status.
Table 2.
Subgroup analyses for the association of the C-index with HI
| Variable | OR (95% CI) | P-value | P for interaction |
|---|---|---|---|
| Gender | <0.001 | ||
| Male | 4016.31 (1527.16,10562.62) | <0.001 | |
| Female | 131.49 (46.36,373) | <0.001 | |
| Age (year) | 0.092 | ||
| <44 | 9.49 (1.11,81.43) | 0.04 | |
| ≥44 | 86.29 (37.84,196.79) | <0.001 | |
| Diabetes | 0.012 | ||
| Yes | 35.47 (5.91,212.89) | <0.001 | |
| No | 494.51 (226.5,1079.63) | <0.001 | |
| Hypertension | 0.039 | ||
| Yes | 102.12 (32.72,318.76) | <0.001 | |
| No | 467.94 (184.78,1185.04) | <0.01 |
DISCUSSION
Our findings demonstrate a strong, nonlinear correlation between the C-index and HI via RCS analysis. This suggests that abdominal obesity may be a more critical risk factor for HI than overall body fat.
To our knowledge, this is the first study to specifically examine the association of C-index with HI. Previous research has explored the broader association between obesity and HI. Kim et al.[28] discovered in the mouse study that diet-induced obesity and metabolic changes reduced auditory sensitivity in male mice. These results suggest that managing visceral fat distribution could potentially reduce the risk of HI.
The C-index has been proposed as an index of body fat distribution, with the value increases in the accumulation of abdominal fat in the body, had a higher diagnostic accuracy for obesity.[29] Higher C-index values reflect visceral fat accumulation, which promotes chronic inflammation, leading to vascular dysfunction and cochlear hypoxia.[30,31] These metabolic disturbances have been linked to microcirculatory impairment and cochlear hair cell damage, thereby increasing HI risk.[32,33] The inner ear, known for its high metabolic rate, is particularly vulnerable, and reduced cochlear blood perfusion due to endothelial dysfunction can exacerbate damage.[34,35,36] These mechanisms include diabetic neuropathy brought on by damage to the auditory system, reactive oxidative stress and cochlear damage brought on by microangiopathy.[13,37]
The association of C-index with HI was more pronounced in males, diabetics and hypertensive individuals, consistent with studies showing worse vascular outcomes in these groups. A retrospective study of 2602 individuals found that gender differences may stem from varying adiponectin levels, with females generally exhibiting higher concentrations.[38] Adiponectin, an adipokine secreted by adipose tissue, has anti-apoptotic, microcirculation-regulating and hearing-protective properties.[39,40] Furthermore, oestrogen has been reported to provide protective effects on the auditory system in females.[41] The lack of an age interaction may be due to NHANES sampling limitations (age cap of 69 years) and strong independent effects of age on HI.[42,43]
Our findings highlight the importance of abdominal obesity as a modifiable risk factor for HI, particularly among high-risk subgroups (men, diabetics and hypertensive individuals). Given the global rise in obesity, monitoring C-index as part of routine metabolic assessments could help identify high-risk individuals before a significant auditory decline occurs. Interventions targeting visceral fat reduction (e.g., diet, exercise and metabolic control) may help mitigate HI risk. Clinicians should consider taking C-index as one of routine physical examinations, particularly for patients with metabolic disorders.
This study has several strengths. First, it is based on NHANES data, a national representative sample collected using standardised procedures. Additionally, the study controlled for multiple covariates and included subgroup analyses to assess the robustness of the association of the C-index with HI across different demographic groups.
This study also has limitations. The cross-sectional design precludes establishing a definitive causal correlation between C-index and HI. Additionally, only four factors (age, gender, diabetes and hypertension) were selected for subgroup analysis. This selection was based on biological relevance and prior literature, which identified these factors as key effect modifiers in the correlation between obesity and HI. Although other variables (e.g., cholesterol, haemoglobin and race) were adjusted for in the model, they were not included in the subgroup analysis due to a lack of significant interaction effects in preliminary analyses. Future studies should explore additional subgroup analyses in larger populations. Lastly, despite adjusting for multiple covariates, unmeasured variables such as medication use, occupational noise exposure and dietary habits could still influence the observed associations.
CONCLUSION
High C-index values are significantly associated with increased risk of HI, with a nonlinear correlation and stronger effects in males, diabetics and hypertensive individuals. These findings underscore the importance of addressing abdominal obesity as a modifiable risk factor for HI. Early screening and intervention strategies may help reduce the burden of HI, particularly in at-risk populations.
Availability of data and materials
The National Health and Nutrition Examination Survey (NHANES) database hosts all study datasets, which are openly available through its official portal: https://wwwn.cdc.gov/nchs/nhanes/.
Author contributions
Guifen Cai: Research architecture formulation, study protocol orchestration, primary data procurement, analytical modeling and hermeneutics and initial manuscript composition. Xiaoyan Xu: Designed research framework and executed study protocols. Xiaokun Li: Verified outcomes and supervised project implementation. Qiong Fang: Conceptualized the study, revised the manuscript with critical insights. All authors critically reviewed the manuscript, approved the final version and assumed full responsibility for its integrity.
Ethics approval and consent to participate
The National Center for Health Statistics (NCHS) Research Ethics Review Board reviewed and approved all NHANES protocols involving human participants, with written informed consent obtained from each subject. As the current study constitutes a secondary analysis of NHANES data, it was granted an exemption by the institutional ethics committee.
Conflicts of Interest
The authors have no conflicts of interest to declare.
Acknowledgment
The authors are deeply indebted to the volunteers and research assistants whose unwavering commitment enabled the successful implementation of this scientific endeavour.
Funding Statement
None.
REFERENCES
- 1.Chadha S, Kamenov K, Cieza A. The world report on hearing, 2021. Bull World Health Organ. 2021;99((4)):242–242A. doi: 10.2471/BLT.21.285643. [DOI] [PMC free article] [PubMed] [Google Scholar]
- 2.Shen P, Hu D, Shen M, Du T, Zhao L, Han M, et al. Association of mixed polycyclic aromatic hydrocarbons exposure with hearing loss and the mediating role of blood cell markers of inflammation in U.S. adults. Front Public Health. 2024;12:1410601. doi: 10.3389/fpubh.2024.1410601. [DOI] [PMC free article] [PubMed] [Google Scholar]
- 3.GBD 2015 Disease and Injury Incidence and Prevalence Collaborators. Global, regional, and national incidence, prevalence, and years lived with disability for 310 diseases and injuries, 1990-2015: a systematic analysis for the Global Burden of Disease Study 2015. Lancet. 2016;388:1545–602. doi: 10.1016/S0140-6736(16)31678-6. [DOI] [PMC free article] [PubMed] [Google Scholar]
- 4.Mayoral LP, Andrade GM, Mayoral EP, Huerta TH, Canseco SP, Rodal Canales FJ, et al. Obesity subtypes, related biomarkers & heterogeneity. Indian J Med Res. 2020;151:11–21. doi: 10.4103/ijmr.IJMR_1768_17. [DOI] [PMC free article] [PubMed] [Google Scholar]
- 5.Stadler JT, Marsche G. Obesity-related changes in high-density lipoprotein metabolism and function. Int J Mol Sci. 2020;21:8985. doi: 10.3390/ijms21238985. [DOI] [PMC free article] [PubMed] [Google Scholar]
- 6.Haidar A, Horwich T. Obesity, cardiorespiratory fitness, and cardiovascular disease. Curr Cardiol Rep. 2023;25:1565–71. doi: 10.1007/s11886-023-01975-7. [DOI] [PMC free article] [PubMed] [Google Scholar]
- 7.Gadde KM, Martin CK, Berthoud HR, Heymsfield SB. Obesity: pathophysiology and management. J Am Coll Cardiol. 2018;71:69–84. doi: 10.1016/j.jacc.2017.11.011. [DOI] [PMC free article] [PubMed] [Google Scholar]
- 8.Dowd K. The role of audiology in the care of persons with diabetes. Semin Hear. 2019;40:279–80. doi: 10.1055/s-0039-1697031. [DOI] [PMC free article] [PubMed] [Google Scholar]
- 9.Li J, Zhu YM, Wang YQ, Gu XC. Associations of blood lipids with the risk and prognosis of sudden sensorineural hearing loss: a meta-analysis. J Int Adv Otol. 2024;20:431–8. doi: 10.5152/iao.2024.241601. [DOI] [PMC free article] [PubMed] [Google Scholar]
- 10.Oussoren FK, Schermer TR, van Leeuwen RB, Bruintjes TD. Cardiovascular risk factors, cerebral small vessel disease, and subsequent risk of stroke in patients with idiopathic sudden sensorineural hearing loss: systematic review and meta-analyses of the current literature. Audiol Neurootol. 2024;29:1–29. doi: 10.1159/000530686. [DOI] [PMC free article] [PubMed] [Google Scholar]
- 11.Clark DPQ, Zhou Z, Hussain SM, Tran C, Britt C, Storey E, et al. Low-dose aspirin and progression of age-related hearing loss: a secondary analysis of the Aspree randomized clinical trial. JAMA Netw Open. 2024;7:e2424373. doi: 10.1001/jamanetworkopen.2024.24373. [DOI] [PMC free article] [PubMed] [Google Scholar]
- 12.Powell-Wiley TM, Poirier P, Burke LE, Després JP, Gordon-Larsen P, Lavie CJ, et al. Obesity and cardiovascular disease: a scientific statement from the American Heart Association. Circulation. 2021;143:e984–e1010. doi: 10.1161/CIR.0000000000000973. [DOI] [PMC free article] [PubMed] [Google Scholar]
- 13.Wang D, Chen Z, Wu Y, Ren J, Shen D, Hu G, et al. Association between two novel anthropometric measures and type 2 diabetes in a Chinese population. Diabetes Obes Metab. 2024;26:3238–47. doi: 10.1111/dom.15651. [DOI] [PubMed] [Google Scholar]
- 14.Guo X, Ding Q, Liang M. Evaluation of eight anthropometric indices for identification of metabolic syndrome in adults with diabetes. Diabetes Metab Syndr Obes. 2021;14:1431–43. doi: 10.2147/DMSO.S294244. [DOI] [PMC free article] [PubMed] [Google Scholar]
- 15.Zhang A, Li Y, Ma S, Bao Q, Sun J, Cai S, et al. Conicity-index predicts all-cause mortality in Chinese older people: a 10-year community follow-up. BMC Geriatr. 2022;22:971. doi: 10.1186/s12877-022-03664-6. [DOI] [PMC free article] [PubMed] [Google Scholar]
- 16.Endukuru CK, Gaur GS, Dhanalakshmi Y, Sahoo J, Vairappan B. Cut-off values and clinical efficacy of body roundness index and other novel anthropometric indices in identifying metabolic syndrome and its components among Southern-Indian adults. Diabetol Int. 2022;13:188–200. doi: 10.1007/s13340-021-00522-5. [DOI] [PMC free article] [PubMed] [Google Scholar]
- 17.Deng B, Liu Z, Huang Q, Feng X, Liao D, Yu F, et al. Conicity index and sex differences in relation to carotid plaque instability in Chinese community residents: conicity index and carotid plaque. J Stroke Cerebrovasc Dis. 2025;34:108193. doi: 10.1016/j.jstrokecerebrovasdis.2024.108193. [DOI] [PubMed] [Google Scholar]
- 18.Milagres LC, Martinho KO, Milagres DC, Franco FS, Ribeiro AQ, Novaes JF. Waist-to-height ratio and the conicity index are associated to cardiometabolic risk factors in the elderly population. Cien Saude Cole. 2019;24:1451–61. doi: 10.1590/1413-81232018244.12632017. [DOI] [PubMed] [Google Scholar]
- 19.Mick PT, Kabir R, Pichora-Fuller MK, Jones C, Moxham L, Phillips N, et al. Associations between cardiovascular risk factors and audiometric hearing: findings from the Canadian longitudinal study on aging. Ear Hear. 2023;44:1332–43. doi: 10.1097/AUD.0000000000001370. [DOI] [PMC free article] [PubMed] [Google Scholar]
- 20.Nam DW, Park MH, Jeong SJ, Lee KL, Kim JW, Jeong JB. Sex differences in associated factors for age-related hearing loss. PLoS One. 2024;19:e0298048. doi: 10.1371/journal.pone.0298048. [DOI] [PMC free article] [PubMed] [Google Scholar]
- 21.Koo JS, Kim SY. Association of body mass index with hearing loss in Korean adult population. Pers Med. 2022;12:786. doi: 10.3390/jpm12050786. [DOI] [PMC free article] [PubMed] [Google Scholar]
- 22.Ye L, Lai D, Tai J. The association between anemia and sensorineural hearing loss: a review. Medicine (Baltimore. 2024;103:e40326. doi: 10.1097/MD.0000000000040326. [DOI] [PMC free article] [PubMed] [Google Scholar]
- 23.Lasica AB, Sheppard J, Yu RC, Livingston G, Ridgway N, Omar R, et al. Association between adult-onset hearing loss and dementia biomarkers: a systematic review. Ageing Res Rev. 2025;104:102647. doi: 10.1016/j.arr.2024.102647. [DOI] [PubMed] [Google Scholar]
- 24.Kim DO, Lee Y, Lee SY, Lee JG, Yi YH, Cho YH, et al. Correlation between hearing impairment and the triglyceride glucose index in middle-aged female based on a Korean National Health and Nutrition Examination Survey. Medicina (Kaunas. 2024;60:1596. doi: 10.3390/medicina60101596. [DOI] [PMC free article] [PubMed] [Google Scholar]
- 25.Nagayama D, Fujishiro K, Watanabe Y, Yamaguchi T, Suzuki K, Saiki A, et al. A Body Shape Index (ABSI) as a variant of conicity index not affected by the obesity paradox: a cross-sectional study using arterial stiffness parameter. J Pers Med. 2022;12:2014. doi: 10.3390/jpm12122014. [DOI] [PMC free article] [PubMed] [Google Scholar]
- 26.Liu L, Qin M, Ji J, Wang W. Correlation between hearing impairment and the Triglyceride Glucose Index: based on a national cross-sectional study. Front Endocrinol (Lausanne. 2023;14:1216718. doi: 10.3389/fendo.2023.1216718. [DOI] [PMC free article] [PubMed] [Google Scholar]
- 27.DecisionLinnc Core Team. https://www.statsape.com/ [Google Scholar]
- 28.Kim SJ, Gajbhiye A, Lyu AR, Kim TH, Shin SA, Kwon HC, et al. Sex differences in hearing impairment due to diet-induced obesity in CBA/Ca mice. Biol Sex Differ. 2023;14:10. doi: 10.1186/s13293-023-00493-z. [DOI] [PMC free article] [PubMed] [Google Scholar]
- 29.Ruperto M, Barril G, Sánchez-Muniz FJ. Usefulness of the conicity index together with the conjoint use of adipocytokines and nutritional-inflammatory markers in hemodialysis patients. J Physiol Biochem. 2017;73:67–75. doi: 10.1007/s13105-016-0525-1. [DOI] [PubMed] [Google Scholar]
- 30.Yang JR, Hidayat K, Chen CL, Li YH, Xu JY, Qin LQ. Body mass index, waist circumference, and risk of hearing loss: a meta-analysis and systematic review of observational study. Environ Health Prev Med. 2020;25:25. doi: 10.1186/s12199-020-00862-9. [DOI] [PMC free article] [PubMed] [Google Scholar]
- 31.Park CH, Yoon KJ, Lee YT, Jin SM, Lee SH, Kim TH. Impact of low skeletal muscle mass and obesity on hearing loss in asymptomatic individuals: a population-based study. Healthcare (Basel. 2022;10:2022. doi: 10.3390/healthcare10102022. [DOI] [PMC free article] [PubMed] [Google Scholar]
- 32.Díaz-Franco MV, Díaz S, Carrasco KH, Curinao BP, Urrea JS, Montecinos JS, et al. [Association between metabolic syndrome and risk of hearing loss: a systematic review and meta-analysis] Rev Med Chil. 2023;151:1125–42. doi: 10.4067/s0034-98872023000901125. [DOI] [PubMed] [Google Scholar]
- 33.Rinaldi M, Cavallaro G, Cariello M, Scialpi N, Quaranta N. Metabolic syndrome and idiopathic sudden sensori-neural hearing loss. PLoS One. 2020;15:e0238351. doi: 10.1371/journal.pone.0238351. [DOI] [PMC free article] [PubMed] [Google Scholar]
- 34.Zhang C, Wang W, Chang X, Zhan S, Wang S, Feng L, et al. Obesity and risk of hearing loss in the middle-aged and elderly: a national cohort of Chinese adults. BMC Public Health. 2023;23:1048. doi: 10.1186/s12889-023-15974-4. [DOI] [PMC free article] [PubMed] [Google Scholar]
- 35.Jung SY, Shim HS, Hah YM, Kim SH, Yeo SG. Association of metabolic syndrome with sudden sensorineural hearing loss. JAMA Otolaryngol Head Neck Surg. 2018;144:308–14. doi: 10.1001/jamaoto.2017.3144. [DOI] [PMC free article] [PubMed] [Google Scholar]
- 36.Gioacchini FM, Pisani D, Viola P, Astorina A, Scarpa A, Libonati F, et al. Diabetes mellitus and hearing loss: a complex relationship. Medicina (Kaunas) 2023;59:269. doi: 10.3390/medicina59020269. [DOI] [PMC free article] [PubMed] [Google Scholar]
- 37.Horváth M, Herold Z, Küstel M, Tamás L, Prekopp P, Somogyi A, et al. Changes in the cochlear and retrocochlear parts of the auditory system in 19-39 and 40-60 years old patients with type 1 diabetes mellitus. PLoS One. 2023;18:e0285740. doi: 10.1371/journal.pone.0285740. [DOI] [PMC free article] [PubMed] [Google Scholar]
- 38.Lee Y, Park M. Relationships among factors relevant to abdominal fat and age-related hearing loss. Clin Exp Otorhinolaryngol. 2017;10:309–14. doi: 10.21053/ceo.2017.00017. [DOI] [PMC free article] [PubMed] [Google Scholar]
- 39.Lee YP, Chang CH, Chen CY, Wen CJ, Huang HL, Peng JK, et al. Correlation between plasma ZAG and adiponectin in older adults: gender modification and frailty specificity. BMC Geriatr. 2021;21:442. doi: 10.1186/s12877-021-02379-4. [DOI] [PMC free article] [PubMed] [Google Scholar]
- 40.Xiao J, Zhang Y, Zhang W, Zhang L, Li L, Si J, et al. Protective effects of adiponectin against cobalt chloride-induced apoptosis of smooth muscle cells via cAMP/PKA pathway. Biomed Res Int. 2020:7169348. doi: 10.1155/2020/7169348. [DOI] [PMC free article] [PubMed] [Google Scholar]
- 41.Yang H, Li J, Sun X, Li W, Wang Y, Huang C. The association of sex steroid hormone concentrations with hearing loss: a cross-sectional study. Acta Otolaryngol. 2023;143:582–8. doi: 10.1080/00016489.2023.2224398. [DOI] [PubMed] [Google Scholar]
- 42.Ruencharoen S, Lertsukprasert K, Suvanich R, Seesangnom J, Chockboondee M, Aekplakorn W, et al. Hearing health survey of the population in Bangkok. BMC Public Health. 2024;24:1024. doi: 10.1186/s12889-024-18424-x. [DOI] [PMC free article] [PubMed] [Google Scholar]
- 43.Stonkute D, Vierboom Y. Educational disparities in age-related hearing loss and hearing aid use across age, gender, and European Region. J Gerontol B Psychol Sci Soc Sci. 2025;80:gbae202. doi: 10.1093/geronb/gbae202. [DOI] [PMC free article] [PubMed] [Google Scholar]
Associated Data
This section collects any data citations, data availability statements, or supplementary materials included in this article.
Data Availability Statement
The National Health and Nutrition Examination Survey (NHANES) database hosts all study datasets, which are openly available through its official portal: https://wwwn.cdc.gov/nchs/nhanes/.