Abstract
We investigated naked mole-rat somatosensory cortex to determine how brain areas are modified in mammals with unusual and extreme sensory specializations. Naked mole-rats (Heterocephalus glaber) have numerous anatomical specializations for a subterranean existence, including rows of sensory hairs along the body and tail, reduced eyes, and ears sensitive to low frequencies. However, chief among their adaptations are behaviorally important, enlarged incisors permanently exterior to the oral cavity that are used for digging, object manipulation, social interactions, and feeding. Here we report an extraordinary brain organization where nearly one-third (31%) of primary somatosensory cortex is devoted to the representations of the upper and lower incisors. In addition, somatosensory cortex is greatly enlarged (as a proportion of total neocortical area) compared with closely related laboratory rats. Finally, somatosensory cortex in naked mole-rats encompasses virtually all of the neocortex normally devoted to vision. These findings indicate that major cortical remodeling has occurred in naked mole-rats, paralleling the anatomical and behavioral specializations related to fossorial life.
Naked mole-rats (Heterocephalus glaber) are rodents in the family Bathyergidae that lead an almost entirely subterranean existence. They are best known for their eusocial colony structure with morphological castes, division of labor, and a single breeding female or “queen” (1–5). In addition to their unique social organization, naked-mole rats are renowned for their unusual physical appearance—a consequence of their many adaptations to underground life. They exhibit a suite of anatomical traits that set them apart from most other rodents. These traits include reduced eyes and small ears with a hearing range restricted primarily to the low frequencies that are easily transmitted through soil (6, 7). Naked mole-rats also have sensory and motor specializations related to touch.
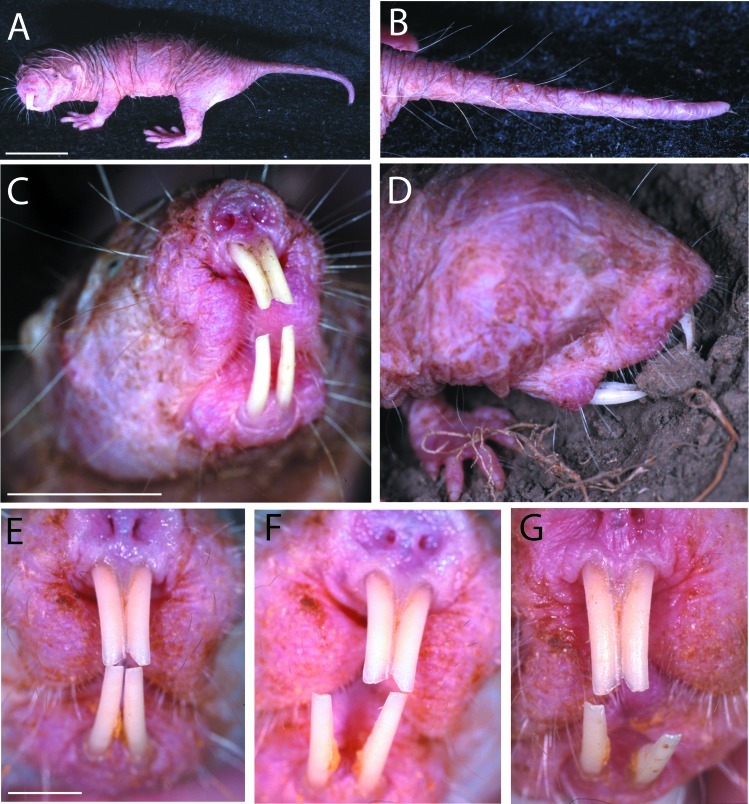
Most rodents have an array of sensory vibrissae on the face and distal snout, and this is also true for naked mole-rats. In addition, naked mole-rats have unique rows of sensory hairs covering their otherwise furless bodies and tail (Fig. 1). Using these postcranial sensory hairs they have little trouble navigating without eyesight and are easily able to travel both forward and backward through their underground tunnels. But the hallmark specialization of mole-rats is the enlarged incisors that are located permanently exterior to the oral cavity. This dentition plays an important role in the daily lives of the mole-rat worker caste, and it has been reported that 25% of their total musculature is devoted to the jaws (8). To examine how mole-rats use these teeth, we filmed them manipulating small wooden sticks and chewing through obstructions within a Plexiglas tunnel system. Slow-motion analysis revealed their remarkable ability to move the lower pair of incisors independently of one another (Fig. 1 F and G). This ability presumably allows for greater versatility in a range of behaviors, including tunnel excavation, carrying and manipulating food and objects, moving the young, social interactions, and of course feeding (9).
Figure 1.
The unusual anatomy of the naked mole-rat (H. glaber). (A) An adult mole-rat demonstrating the lack of fur and general proportions of the body. (B) The sensory hairs covering the tail that are used for navigation while traveling backward through tunnels. (C) Front view of a naked mole-rat showing the enlarged incisors that are located permanently exterior to the oral cavity. Note also the sensory whiskers covering the front part of the face and mouth region. (D) A mole-rat moves a small piece of earth with the teeth. (E–G) A remarkable feature of the lower incisors is their ability to move independently. This is possible because of a flexible mandibular symphysis connecting the two halves of the lower jaw. The specimen shown here was anesthetized to document their mobility in the dorso-ventral and medio-lateral planes. Analysis of slow-motion videotaped behavior shows that independent movements in these different directions are common. (Scales bars: 2 cm in A; 1 cm in C; 5 mm in E.)
The goal of this study was to assess the degree to which cortical areas may undergo extensive reorganizations, in the course of evolution, that parallel physical and behavioral adaptations to a specific habitat. Of particular interest in naked mole-rats is the organization of cortical areas related to touch (somatosensory areas), because touch is expected to be of paramount importance in dark underground tunnels and because the mole-rats' use of teeth is so unusual.
Methods
To determine how somatosensory cortex was organized in naked mole-rats (H. glaber), microelectrodes were used to record multiunit neuronal activity at over 1,100 different cortical sites in four adult mole-rats. Mole-rats were anesthetized with an i.p. injection of 15% urethane diluted in PBS at a dosage of 1.5 g/kg. Body temperature was maintained with a heating pad and the cortex was exposed over one hemisphere, the dura was removed, and the cortex was protected with a layer of silicon. Multiunit microelectrode recordings were made from cortex by using low impedance tungsten microelectrodes (1.0–1.5 MΩ at 1,000 Hz). Each electrode penetration site was marked on an enlarged photograph of the brain and selected penetration sites were marked with a microlesion (10 μA while withdrawing the electrode at 70 μm/s). The skin surface was stimulated with small probes, fine paint brushes, and calibrated von Frey hairs to determine the location and size of receptive fields on the body for neurons at each electrode penetration. Receptive fields were drawn on an enlarged schematic of the body, and selected penetration sites were marked in cortex with microlesions. Sites in caudal cortex were checked for visual responses. After recordings, mole-rats were given an overdose of sodium pentobarbital (100 mg/kg) and perfused with phosphate buffered 0.9% saline (pH 7.4) followed by 4% paraformaldehyde in phosphate buffer. The cortex was postfixed for 30 min, separated from the underlying white matter, transferred to 30% sucrose, and flattened between glass slides for 12 h. The cortex was cut parallel to the surface at 40–60 μm and sections were processed for cytochrome oxidase histochemistry, a metabolic enzyme most heavily expressed in sensory areas (10).
Cortical areas were measured in naked mole-rats by relating the distribution of microelectrode penetrations to sections of flattened cortex by using cortical microlesions visible in tissue sections to align the physiological map to the cortical histology. For laboratory rats, four adult Long–Evans rat hemispheres were analyzed. The hemispheres were processed and flattened as described above. The extent of primary somatosensory cortex (S1) was measured from the distinctive histochemical pattern that is congruent with the representation of the contralateral body representation in S1 (11, 12). The tooth representation in laboratory rats has been localized to the rostral-most region of barrels, overlapping the representation of the microvibrissae (13). In both naked mole-rats and Long–Evans rats, limbic cortex from the medial wall was not included in the area calculations and all measurements were made after tissue fixation.
Results and Discussion
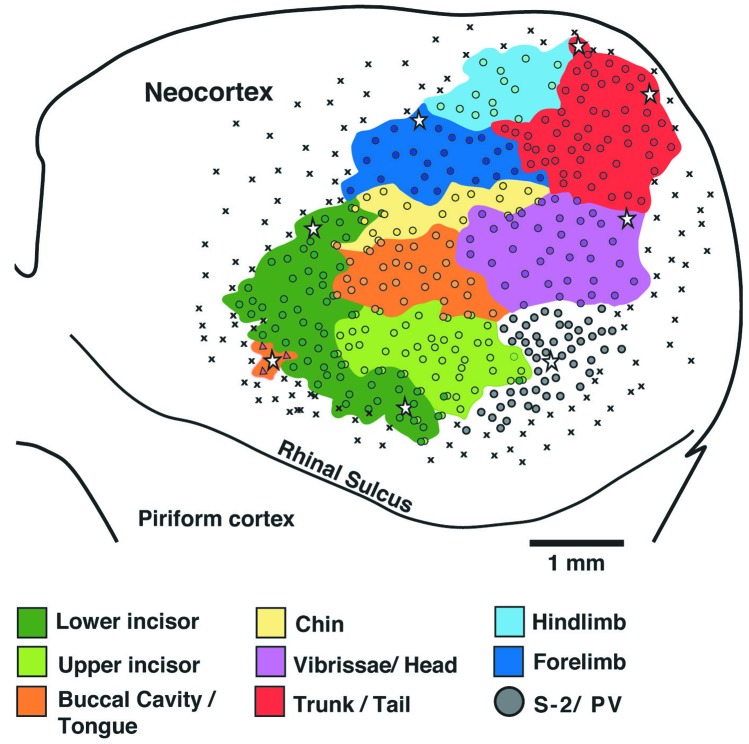
S1 was located in a large oval in the caudal two-thirds of neocortex. As in other mammals, S1 consisted of a complete topographic representation of the contralateral body surface. Additional representations of body parts were found in lateral cortex corresponding to secondary somatosensory cortex (S2) and perhaps PV, the parietal ventral area (14, 15). No visual responses were found in caudal cortex. The topographic sequence of representation in mole-rat S1 was similar to that found in virtually all other mammals (16, 17), with caudal body parts such as tail and hindlimb represented medially in cortex, ventral body parts represented rostrally, dorsal body parts represented caudally, and rostral body parts (head and face) represented laterally in cortex (Fig. 2). But S1 was very unusual in a number of other respects.
Figure 2.
Results of microelectrode recordings from naked mole-rat case 4 showing the extent of S1 and the location of the representations for different body parts in the left hemisphere. Each circle marks an electrode penetration where neurons responded to tactile stimulation of the body surface. Each colored region indicates the extent of the representation of a different body part. The representation of the dentition (Green) was found to be greatly expanded in naked mole-rats, taking up approximately 31% of S1. Note also the relatively large size of S1 overall, and its extension into far caudal and medial cortex where visual cortex is usually located in other mammals. ⋆, microlesions; ×, unresponsive sites. Medial is up and rostral is to the left.
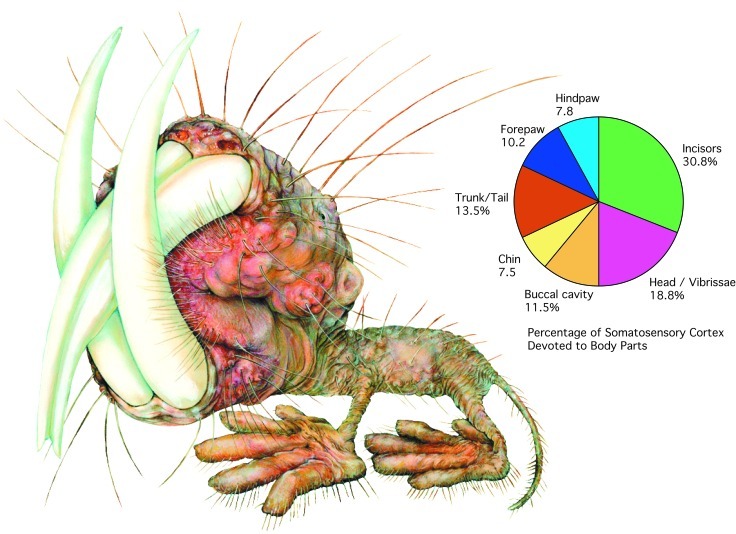
The most obvious specialization was an extreme cortical magnification of the incisors. Nearly one-third of S1 (31%) was taken up by separate representations of the upper and lower front teeth (Figs. 2 and 3; Table 1). The incisor region was located at the rostro-lateral extreme of S1 in an area normally occupied by a representation of facial microvibrissae in other investigated rodents (18). The lower incisor representation was located rostral to the upper incisor, consistent with the typical topography in S1, where ventral body parts are represented more rostrally in cortex than dorsal body parts. At the border between the two teeth representations, neurons responded to stimulation of both the upper and lower incisors. Neurons in more dorsal and caudal cortex responded to stimulation of the small hairs—located just behind the incisors—that surround the opening to the mouth. In all four cases the lower incisor, which can be moved independent of its contralateral counterpart, had a larger representation than the upper incisor. Neurons throughout this region of cortex responded to light tactile stimulation of the upper or lower incisors and generally responded to von Frey filament 3.22 corresponding to a force of less than 0.2 g. In the case of the lower incisor representation, responses were obtained primarily from the contralateral tooth. This determination was more difficult for the upper incisors because both upper incisors make close contact with one another. Thus, responses to stimulation of either of the upper incisors were common. However, stimulation with fine von Frey filaments often yielded responses solely to the contralateral tooth, suggesting that many responses to the ipsilateral tooth were a consequence of inadvertent stimulation of both incisors. Alternatively, a proportion of the neurons in the upper tooth representation might be bilaterally activated, as has been shown for slowly adapting dental receptors in cats (19) and for oral receptive fields in primates (20). As a whole, the amount of cortex devoted to the incisor representations occupied an average of 10% of the total neocortical area.
Figure 3.
The relative sizes of different sensory representations in naked mole-rats S1. The chart on the right shows the percentage of cortex devoted to different body parts. On the left the different body parts are illustrated according to their cortical proportions. This “mole-ratunculus” provides a graphic illustration of the cortical magnification of the incisors and head (illustration by Lana Finch).
Table 1.
Proportions of S1 devoted to different body parts
| Body part | Case 1, mm2 | Case 2, mm2 | Case 3, mm2 | Case 4, mm2 | Average, mm2 | SD, mm2 |
|---|---|---|---|---|---|---|
| Incisors | 27.1% (2.9) | 30.4% (2.4) | 34.7% (4.2) | 30.8% (3.5) | 30.8% (3.2) | ± 3.1% (0.8) |
| Head/vibrissae | 23.3% (2.5) | 20.9% (1.7) | 14.7% (1.8) | 16.0% (1.8) | 18.7% (1.9) | ± 4.0% (0.4) |
| Buccal cavity | 10.6% (1.1) | 11.6% (0.9) | 12.9% (1.6) | 10.8% (1.2) | 11.5% (1.2) | ± 1.0% (0.3) |
| Chin | 5.5% (0.6) | 10.5% (0.8) | 7.3% (0.9) | 6.6% (0.8) | 7.5% (0.8) | ± 2.2% (0.1) |
| Trunk/tail | 12.0% (1.3) | 11.3% (0.9) | 14.1% (1.7) | 16.7% (1.9) | 13.5% (1.4) | ± 2.4% (0.4) |
| Forepaw | 11.3% (1.2) | 10.5% (0.8) | 7.7% (0.9) | 11.4% (1.3) | 10.2% (1.1) | ± 1.7% (0.2) |
| Hindpaw | 10.2% (1.1) | 4.7% (0.4) | 8.7% (1.0) | 7.7% (0.9) | 7.8% (0.8) | ± 2.3% (0.3) |
| Total S1 | (10.6) | (7.9) | (12.0) | (11.4) | (10.5) | ± (1.8) |
| Total neocortex | (39.8) | (25.3) | (37.2) | (32.5) | (33.7) | ± (6.4) |
A second obvious specialization of S1 in naked mole-rats was its much larger size compared with most other mammal species (21). In a previous study of the blind mole-rat (Spalax ehrenbergi), Necker et al. (22) were able to map much of the sensory cortex. Their preliminary estimates suggested that Spalax somatosensory cortex was at least 20% larger than laboratory rats and was shifted caudally in cortex to occupy part of the area usually devoted to vision. However, the dentition was not mapped and the borders of sensory areas were estimated in limited detail and not related to cortical histology. Nevertheless, the results strongly suggested that S1 in blind mole-rats is enlarged and displaced caudally.
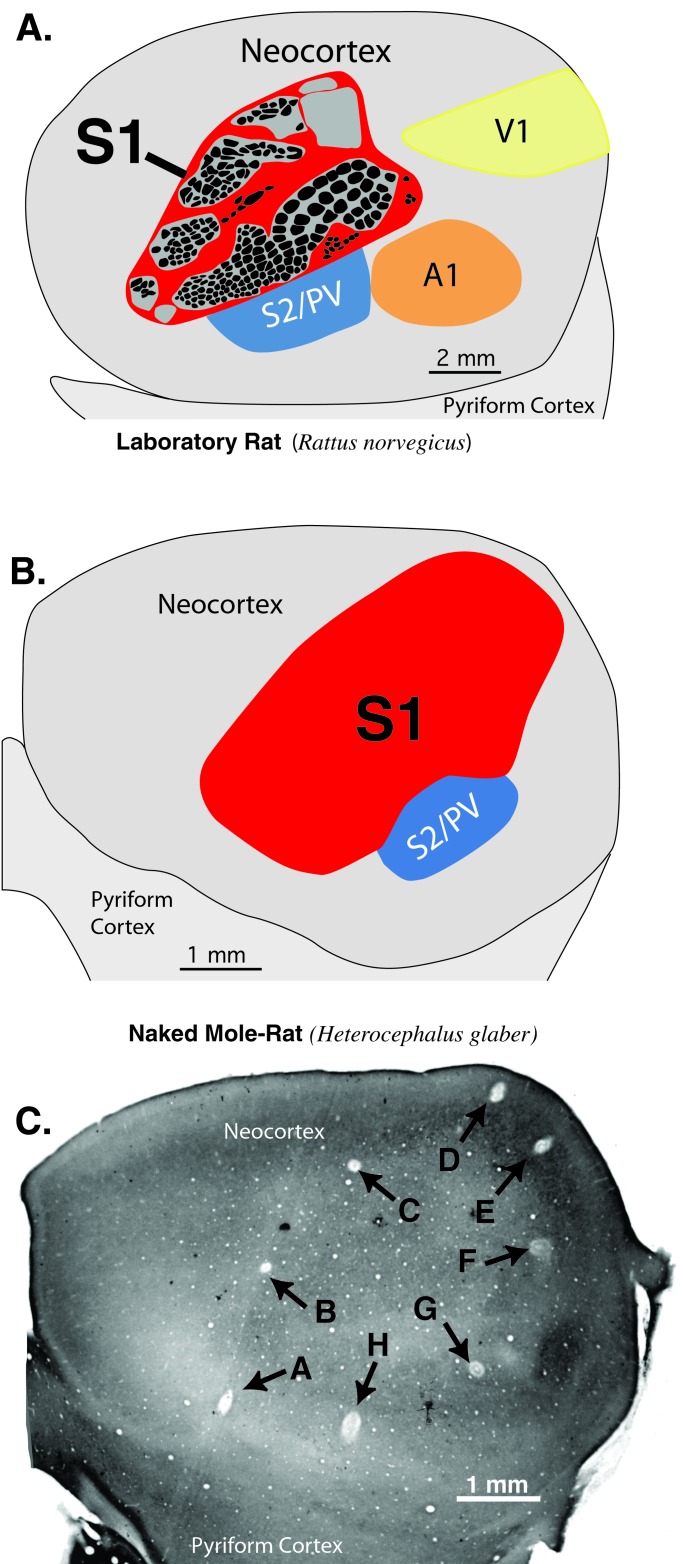
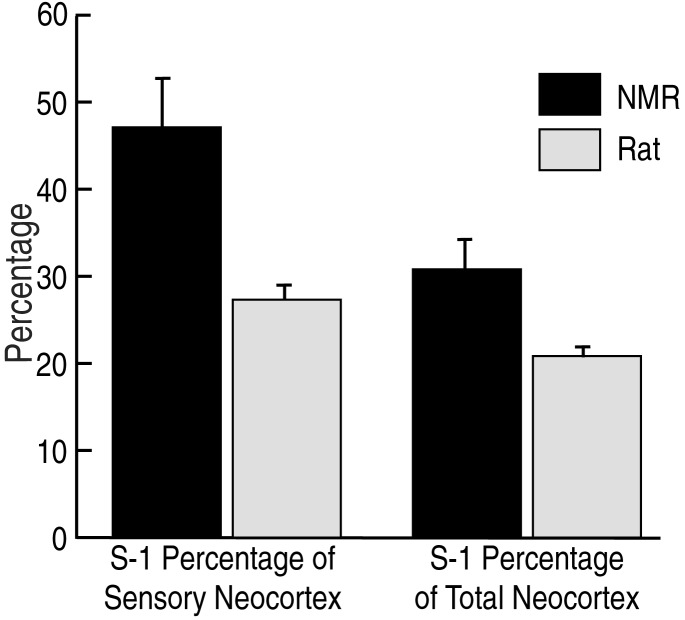
By sampling cortex with a high density of microelectrode penetrations and relating microlesions to flattened cortical histology, we were able to revisit this issue in much greater detail for naked mole-rats. Our results reveal a remarkable expansion of the proportion of the neocortex taken up by the primary somatosensory area (S1), far greater than previously reported in any other rodent (Fig. 4). S1 in naked mole-rats took up approximately 31% of total neocortex and at least 47% of all possible sensory cortex (cortex caudal to the rostral border of S1). In contrast, S1 in laboratory rats takes up approximately 21% of neocortex and only 27% of all possible sensory cortex (Fig. 5). Assuming the sensory cortex of rats to be more typical of ancestral rodents, naked-mole rat somatosensory cortex appears to have increased by as much as 50% (as a proportion of total neocortical area) as mole-rats became specialized for fossorial life (Fig. 5).
Figure 4.
A comparison of the size and location of primary somatosensory cortex between laboratory rats (Long–Evans) and the naked mole-rat. (A) The location and size of S1 in a rat drawn from a section of layer 4 cortex processed for cytochrome oxidase histochemistry. Black ovals within S1 reflect the locations of cytochrome oxidase dark modules that represent whiskers and skin surfaces (30). S1 takes up approximately 21% of the neocortex in rats and is located rostral to primary visual (V1) and auditory cortex (A1). (B) The location and size of S1 in the naked mole-rat. S1 takes up approximately 31% of neocortex and extends far caudal and medial, occupying cortical territory usually taken up by visual areas in other mammals. (C) A section of flattened cortex from a naked mole-rat showing microlesions made where neurons responded to mechanosensory stimulation of body parts and outlining much of S1. Note the caudo-medial location of lesions D and E. Neurons at the lesions responded in the following sequence: A, tongue; B, lower incisor; C, forelimb; D and E, tail; F, facial vibrissae; G, hindlimb (in S2/PV); H, lower incisor.
Figure 5.
Comparison of the overall proportion of neocortex taken up by S1 in the naked mole-rat and Long–Evans laboratory rat. S1 was approximately 50% larger, as a proportion of total neocortex, in the naked mole-rat (Right). A second comparison is the proportion of sensory cortex taken up by S1 in the two species (Left). Total sensory cortex here was defined as cortex caudal to the rostral border of S1, which necessarily includes all visual cortex (V1 and V2), auditory cortex, and the secondary somatosensory area (S2) and parietal ventral somatosensory area (PV). Because mole-rats have less sensory cortex overall, S1 takes up a larger proportion of neocortex devoted to all sensory areas. Bars indicate SD.
A final specialization of mole-rat somatosensory cortex was its far caudal and medial extension. This extension is perhaps best appreciated by noting the locations of microlesions where neurons responded to mechanosensory stimulation of the tail in a section of flattened cortex (Fig. 4C). In most other mammals (Fig. 4A), much of caudal cortex is occupied by primary and secondary visual cortex (23, 24). In naked mole-rats, somatosensory cortex extended to the caudo-medial pole of neocortex, clearly occupying most of the area that usually processes visual information in other species.
This somatosensory expansion seems analogous to the compensatory plasticity and corresponding cortical reorganization that has been observed when normally sighted animals are experimentally deprived of vision (25–28). Of course the degree of somatosensory expansion is much greater in naked mole-rats. This is to be expected given the millions of years they have had to evolve innate developmental mechanisms that bias their sensory system to process information related to touch. These findings also raise the question of how subcortical structures might be similarly specialized. In blind mole-rats (S. ehrenbergi), which depend heavily on their auditory system to detect low frequencies transmitted through soil, the dorsal lateral geniculate body was found to respond to auditory stimuli (29). This finding suggests that in addition to changes in overall size, nuclei and areas might be rewired to respond to new modalities in the course of evolution.
The somatosensory cortex of naked-mole rats extends much further medially and caudally than in blind mole-rats (22) and appears to take up a much greater proportion of the brain (30). It is not clear why naked and blind mole-rats appear to differ in this respect. Part of the explanation for the larger expansion of naked mole-rat S1 may be related to the important postcranial sensory hairs that uniquely cover much of the naked mole-rat body and could require a large somatosensory territory much like the facial whiskers of other rodents (31). Presumably the dentition is also of great importance to blind mole-rats, but this has not yet been explored.
Naked mole-rats have diverged extensively from their nonfossorial relatives and exhibit a number of unusual physical and behavioral adaptations for their underground habitat. Here we demonstrate that brain organization has evolved in parallel with these physical and behavioral changes, resulting in an equally specialized and unusual cortical organization (Fig. 3). These specializations include major changes in the proportion of cortex devoted to touch and the location of somatosensory cortex, as well as the extreme magnification of the behaviorally most important parts of the mole-rat periphery—the incisors. Although the dentition is important in virtually all mammals, the degree of cortical magnification of mole-rat incisors is unprecedented. Such magnification is usually associated with a specialized sheet of sensory receptors (e.g., retina or skin surface) rather than the receptors at the base of the tooth that are activated by transmitting distant contact along a rigid surface.
These findings raise a number of important questions regarding cortical evolution, plasticity, and development. For example, investigations of rodent somatosensory “barrel” cortex have revealed a close relationship between innervation density and cortical representational area (32, 33). This finding would suggest that mole-rats may have a particularly large set of densely innervated periodontal mechanoreceptors. A second possibility, suggested by more recent investigations in primates (34, 35), is that activity patterns may have influenced the size of cortical representations in mole-rat cortex. Perhaps, for example, greater use of the incisors by naked mole-rats relative to other mammals has shaped the size of cortical representations throughout their lifetime. Alternatively, the incisors and their innervation may have an important influence on the cortex primarily during early critical periods of development (36–38). Finally, whatever the mechanism of cortical magnification, it remains to be seen what is gained by devoting so much cortex to the teeth. Can mole-rats use the dentition for a range of subtle sensory discriminations? We believe these interesting small mammals will be useful in answering a number of basic questions about the sensorimotor function of dentition.
Acknowledgments
Special thanks to Fiona Remple for help with the experiments, processing tissue, and for comments on the manuscript. Thanks also to Jennifer Jarvis for her help and advice with mole-rat husbandry and to Lana Finch for illustrating the Mole-Ratunculus. M.S.R. was supported by the Center for Cognitive and Integrative Neuroscience and the Vanderbilt Neuroscience Graduate Program. This research was supported by National Institutes of Health Grant MH 58909 and a grant from the Searle Scholars Program (to K.C.C.).
References
- 1.Jarvis J U M. Science. 1981;212:571–573. doi: 10.1126/science.7209555. [DOI] [PubMed] [Google Scholar]
- 2.Jarvis J U M, O'Riain M J N, Bennett C, Shermman P W. Trends Ecol Evol. 1994;9:47–51. doi: 10.1016/0169-5347(94)90267-4. [DOI] [PubMed] [Google Scholar]
- 3.O'Riain M J, Jarvis J U, Faulkes C G. Nature (London) 1996;380:619–621. doi: 10.1038/380619a0. [DOI] [PubMed] [Google Scholar]
- 4.O'Riain M J, Jarvis J U, Alexander R, Buffenstein R, Peeters C. Proc Natl Acad Sci USA. 2000;97:13194–13197. doi: 10.1073/pnas.97.24.13194. [DOI] [PMC free article] [PubMed] [Google Scholar]
- 5.Faulkes C G, Bennett N C. Trends Ecol Evol. 2001;16:184–190. doi: 10.1016/s0169-5347(01)02116-4. [DOI] [PubMed] [Google Scholar]
- 6.Heffner R S, Heffner H E. Hear Res. 1992;62:206–216. doi: 10.1016/0378-5955(92)90188-s. [DOI] [PubMed] [Google Scholar]
- 7.Credner S, Burda H, Ludescher F. J Comp Physiol A. 1997;180:245–245. doi: 10.1007/s003590050045. [DOI] [PubMed] [Google Scholar]
- 8.Sherman P W, Jarvis J U M, Braude S H. Sci Am. 1992;267:42–48. [Google Scholar]
- 9.Lacey E A, Alexander R D, Braude S H, Sherman P W, Jarvis J U M. In: The Biology of The Naked Mole-Rat. Sherman P W, Jarvis J U M, Alexander R D, editors. Princeton: Princeton Univ. Press; 1991. pp. 209–242. [Google Scholar]
- 10.Wong-Riley M T, Carroll E W. J Comp Neurol. 1984;222:18–37. doi: 10.1002/cne.902220103. [DOI] [PubMed] [Google Scholar]
- 11.Welker C. J Comp Neurol. 1976;166:173–189. doi: 10.1002/cne.901660205. [DOI] [PubMed] [Google Scholar]
- 12.Dawson D R, Killackey H P. J Comp Neurol. 1987;256:246–256. doi: 10.1002/cne.902560205. [DOI] [PubMed] [Google Scholar]
- 13.Hayama T, Hashimoto K, Ogawa H. Neurosci Lett. 1993;164:13–16. doi: 10.1016/0304-3940(93)90845-c. [DOI] [PubMed] [Google Scholar]
- 14.Krubitzer L A, Sesma M A, Kaas J H. J Comp Neurol. 1986;250:403–430. doi: 10.1002/cne.902500402. [DOI] [PubMed] [Google Scholar]
- 15.Krubitzer L A. Trends Neurosci. 1995;18:408–417. doi: 10.1016/0166-2236(95)93938-t. [DOI] [PubMed] [Google Scholar]
- 16.Kaas J H. Physiol Rev. 1983;63:206–231. doi: 10.1152/physrev.1983.63.1.206. [DOI] [PubMed] [Google Scholar]
- 17.Kaas J H. In: Frontiers in Physiological Research. Garlick D G, Komer P I, editors. Canberra: Australian Academy of Science; 1984. pp. 300–305. [Google Scholar]
- 18.Woolsey T A, Welker C, Schwartz R H. J Comp Neurol. 1975;164:79–94. doi: 10.1002/cne.901640107. [DOI] [PubMed] [Google Scholar]
- 19.Nishiura H, Tabata T, Watanabe M. Arch Oral Biol. 2000;45:833–842. doi: 10.1016/s0003-9969(00)00054-6. [DOI] [PubMed] [Google Scholar]
- 20.Jain N, Qi H X, Catania K C, Kaas J H. J Comp Neurol. 2001;429:455–468. doi: 10.1002/1096-9861(20010115)429:3<455::aid-cne7>3.0.co;2-f. [DOI] [PubMed] [Google Scholar]
- 21.Johnson J I. In: Cerebral Cortex. Jones E G, Peters A, editors. 8B. New York: Plenum; 1990. pp. 335–449. [Google Scholar]
- 22.Necker R, Rehkamper G, Nevo E. NeuroReport. 1992;3:505–508. doi: 10.1097/00001756-199206000-00012. [DOI] [PubMed] [Google Scholar]
- 23.Kaas J H. Annu Rev Psychol. 1987;38:129–151. doi: 10.1146/annurev.ps.38.020187.001021. [DOI] [PubMed] [Google Scholar]
- 24.Rosa M G P, Krubitzer L A. Trends Neurosci. 1999;22:242–248. doi: 10.1016/s0166-2236(99)01398-3. [DOI] [PubMed] [Google Scholar]
- 25.Rauschecker J P, Tian B, Korte M, Egert U. Proc Natl Acad Sci USA. 1992;89:5063–5067. doi: 10.1073/pnas.89.11.5063. [DOI] [PMC free article] [PubMed] [Google Scholar]
- 26.Bronchti G, Schonenberger N, Welker E, Van der Loos H. NeuroReport. 1992;3:489–492. doi: 10.1097/00001756-199206000-00008. [DOI] [PubMed] [Google Scholar]
- 27.Zheng D, Purves D. Proc Natl Acad Sci USA. 1995;92:1802–1806. doi: 10.1073/pnas.92.6.1802. [DOI] [PMC free article] [PubMed] [Google Scholar]
- 28.Rauschecker J P. Trends Neurosci. 1995;18:36–43. doi: 10.1016/0166-2236(95)93948-w. [DOI] [PubMed] [Google Scholar]
- 29.Bronchti G, Heil P, Scheich H, Wollberg Z. J Comp Neurol. 1989;284:253–274. doi: 10.1002/cne.902840209. [DOI] [PubMed] [Google Scholar]
- 30.Mann M D, Rehkamper G, Reinke H, Frahm H D, Necker R, Nevo E. J Hirnforsch. 1997;38:47–59. [PubMed] [Google Scholar]
- 31.Woolsey T A, Van der Loos H. Brain Res. 1970;17:205–242. doi: 10.1016/0006-8993(70)90079-x. [DOI] [PubMed] [Google Scholar]
- 32.Welker E, Van der Loos H. Exp Brain Res. 1986;63:650–654. doi: 10.1007/BF00237487. [DOI] [PubMed] [Google Scholar]
- 33.Welker E, Van der Loos H. J Neurosci. 1986;6:3355–3373. doi: 10.1523/JNEUROSCI.06-11-03355.1986. [DOI] [PMC free article] [PubMed] [Google Scholar]
- 34.Jenkins W M, Merzenich M M, Ochs M T, Allard T, Guic-Robles E. J Neurophysiol. 1990;63:82–104. doi: 10.1152/jn.1990.63.1.82. [DOI] [PubMed] [Google Scholar]
- 35.Recanzone G H, Merzenich M M, Jenkins W M, Grajski K A, Dinse H R. J Neurophysiol. 1992;67:1031–1056. doi: 10.1152/jn.1992.67.5.1031. [DOI] [PubMed] [Google Scholar]
- 36.Hubel D H, Wiesel T N, LeVay S. Philos Trans R Soc London B. 1977;278:377–409. doi: 10.1098/rstb.1977.0050. [DOI] [PubMed] [Google Scholar]
- 37.Stryker M P, Harris W A. J Neurosci. 1986;6:2117–2133. doi: 10.1523/JNEUROSCI.06-08-02117.1986. [DOI] [PMC free article] [PubMed] [Google Scholar]
- 38.Catania K C. Nat Neurosci. 2001;4:353–354. doi: 10.1038/85992. [DOI] [PubMed] [Google Scholar]


