Abstract
Because leptin stimulates nitric oxide (NO) release from the hypothalamus and anterior pituitary gland, we hypothesized that it also might release NO from adipocytes, the principal source of leptin. Consequently, plasma concentrations of leptin and NO, estimated from its metabolites NO3 and NO2 (NO3-NO2), were measured in adult male rats. There was a linear increase of both leptin and NO3-NO2 with body weight that was associated with a parallel rise in fat mass. These findings indicate that release of leptin and NO is directly related to adipocyte mass. Furthermore, there was a parallelism in circadian rhythm of both substances, with peaks at 0130 h and nadirs at 0730 h. Measurement of both leptin and NO3-NO2 in plasma from individual rats revealed that NO3-NO2 increased linearly with leptin. Incubation of epididymal fat pads with leptin or its i.v. injection in conscious rats increased NO3-NO2 release. The release of NO3-NO2 in vivo and in vitro exceeded that of leptin by many fold, indicating that leptin activates NO synthase. Leptin increased tumor necrosis factor (TNF)-α release at a 100-fold lower dose than required for NO release in vitro and in vivo, suggesting that it also may participate in leptin-induced NO release. However, because many molecules of leptin were required to release a molecule of TNF-α in vivo and in vitro, we believe that leptin-induced TNF-α release is an associated phenomenon not involved in NO production. The results support the hypothesis that adipocytes play a major role in NO release by activating NO synthase in the adipocytes and the adjacent capillary endothelium.
Keywords: TNF-α‖ketamine‖epididymal fat pad‖nitrate and nitrite
Our previous studies have shown that leptin controls the release of nitric oxide (NO) by activating NO synthase (NOS), both in the basal hypothalamus and also in the anterior pituitary gland (1, 2). Although leptin has been localized to the hypothalamic arcuate nucleus, in the very region where it controls NO release (3), the major storehouse of leptin is in the adipocytes (4). Therefore, it occurred to us that leptin released from the adipocytes might also activate NOS and cause release of NO.†
It has been shown that endothelial (e) NOS is present on the cell membrane of adipocytes (5), that leptin receptors are on their cell surface (4), and that they contain a significant storehouse of leptin in small pinocytotic vesicles beneath the cell membrane (4). We hypothesized that leptin is extruded by exocytosis from these vesicles and acts on its receptors on the surface of the adipocytes and on adjacent capillary endothelial cells to activate eNOS. The activation of eNOS increases NO that is released into the interstitial fluid and diffuses into the capillaries, adjacent arterioles and venules. The released NO would diffuse into the smooth muscle of these small vessels and activate guanylyl cyclase causing generation of cyclic GMP (cGMP) from GTP. cGMP acts by protein kinase G to relax vascular smooth muscle (6). Thus, if leptin releases NO as hypothesized, it would dilate arterioles and venules, increasing blood flow to the adipocytes.
Vasodilatation also is produced by release of acetyl choline from parasympathetic terminals that activate eNOS in vascular endothelium. The NO released dilates vascular smooth muscle thereby lowering blood pressure. Under resting conditions there is tonic NO-ergic vasodilatory tone because blockade of NOS by inhibition of the enzyme elevates blood pressure (7). NO also plays a role in renal function and the metabolites of NO produced in the kidney also would reach the circulation and diffuse into the urine (8). In fact, NO plays a role in the function of nearly all organs in the body. It is rapidly metabolized to its principal metabolites nitrite [NO2] and nitrate [NO3] that diffuse into the circulation and serve as an index of NO production. Consequently, plasma NO3-NO2 concentration [NO3-NO2] would be an index of the sum total of NO released from all of the organs of the body that would include brain, pituitary, heart, vascular system, kidney, adipose tissue, and immune cells.
Proinflammatory cytokines, such as IL-1, IL-6, and tumor necrosis factor (TNF)-α, that are secreted in response to infection also increase NO production by inducing the expression of inducible NOS not only from monocytes and macrophages but also from parenchymal cells in many other organs (9–11). Leptin is a cytokine (12) that is synthesized and released principally by adipocytes in adipose tissue that constitutes 10–25% of body weight (13). We hypothesize that release of leptin from the adipocytes stimulates significant release of NO that would make an important contribution to the plasma levels of NO3-NO2. Moreover, unlike the classical cytokines that are hardly measurable during baseline conditions and reach concentrations in the picoMolar range only during stress, such as inflammatory stress provoked by lipopolysaccharide (14, 15) or surgical stress (16), baseline concentrations of leptin in plasma are in the nanoMolar range, suggesting that leptin might be a major factor to control NO release and consequently plasma NO3-NO2 concentrations.
Therefore, both plasma leptin and NO3-NO2 in blood samples from individual rats were measured to determine whether there was any correlation between the plasma levels of leptin and [NO3-NO2] under a variety of conditions. The effect of leptin on release of NO from epididymal fat pads (EFP) incubated in vitro and on plasma NO3-NO2 in conscious male rats also was determined. In addition, TNF-α release from EFP and in plasma was determined because we recently discovered that adipose tissue produces significant amounts of TNF-α together with leptin during the inflammatory stress produced by lipopolysaccharide (C.A.M., W.H.Y., and S.M.M., unpublished data), and TNF-α is also an important stimulator of NO production (9). The results support the hypothesis that leptin stimulates the release of NO from adipose tissue and that this NO is a major contributor to plasma NO3-NO2 and accounts for the parallel circadian rhythm of both substances.
Materials and Methods
Animals.
Adult male rats (350–400 g) of the Holtzman strain (Harlan, Sprague–Dawley) were used in the experiments except in one experiment in which rats of different sizes were decapitated to determine any effect of body weight on plasma leptin and NO3-NO2. On arrival, the animals were allowed to acclimate for 2 wk and were housed two per cage in a room with controlled temperature (23–25°C) and lighting (lights on from 0700 to 1900 h). A standard pellet diet and tap water were available ad libitum. Procedures involving animals were approved by the Pennington Biomedical Research Center Institutional Animal Care and Use Committee, protocol 97.
Drugs.
Rat leptin was purchased from R & D Systems. It was dissolved according to the specifications of the vendor and stored at −70°C at a concentration of 10−4M. On the day of the in vitro experiment, it was dissolved to the final concentration according to the treatment between 10−5M and 10−7M in Krebs buffer. On the day of the in vivo experiment, leptin was dissolved in NaCl 0.15 M containing heparin 500 units/ml until reaching a concentration of 6 or 60 nmol/kg in the volume of injection namely, 0.5 ml.
Decapitated Animals.
Ten rats were decapitated (large, n = 4) and (larger, n = 6) by a guillotine, and trunk blood was collected in sterile 15-ml capacity plastic tubes containing 6 μl of heparin 5,000 units/ml.
Determination of the Diurnal Rhythm of Plasma Leptin and NO3-NO2.
In this experiment, animals were removed from the vivarium and immediately decapitated in another room and trunk blood was collected. A group of eight rats were removed from the animal room every 3 h. It took 3 min for transport to the experimental room. The rats were then immediately decapitated in sequence, so that the last one was decapitated by 12 min from the time of removal from the vivarium. Therefore, the time from removal of rats from the animal room to decapitation varied from 3 to 12 min.
Repeated Blood Sampling.
The rats were brought to the laboratory from the vivarium and housed individually on the morning of the experiment. After resting for 3 h, they were anesthetized by i.p. injection of 0.1 ml/100 g body weight of ketamine/acepromazine/xylazine (90 + 2 + 6 mg/ml, respectively). After the animals were completely anesthetized, a skin incision was made and a silastic catheter was introduced into the right external jugular vein and advanced to the right atrium according to the technique of Harms and Ojeda (17). Immediately after the operation, polyethylene tubing was connected to the silastic catheter. Thirty min after completion of surgery, 0.5 ml of blood was withdrawn, collected in 12 × 75-mm glass tubes containing 5 μl of heparin 1,000 units/ml, and replaced with an equal volume of either 0.9% NaCl containing 500 units/ml of heparin (saline) or one dose of leptin (6 nmol/kg or 60 nmol/kg), and blood samples were collected at 15, 30, 60, 90, and 120 min during the first day and replaced with equal volumes of saline containing heparin 50 units/ml. Blood was centrifuged (700 × g) for 15 min and the plasma was stored at −70°C until assays for determination of TNF-α and NO3-NO2 were performed.
In Vitro Experiments.
Rats (350–400 g) were killed by decapitation and EFP were removed and cut longitudinally into halves. Each explant (0.5–0.7 g) was preincubated in vitro in 1.5 ml of Krebs-Ringer bicarbonate buffer (pH 7.4, ascorbic acid 10 mg/liter) in an atmosphere of 95% O2/5% CO2 in a Dubnoff shaker (50 cycles/min) for a period of 1 h. After this preincubation, the EFP were incubated for 3 h in fresh Krebs-Ringer bicarbonate buffer alone or containing graded concentrations of leptin (10−7, 10−6, or 10−5 M). At the end of the incubation, the medium was aspirated and the tissues were weighed. Thereafter, the medium was stored at (−70°C) until measurement of NO3-NO2.
NO3-NO2 Determination.
Five hundred microliters of each sample was evaporated in a speedvac centrifuge Savant (Farmingdale, NY) reconstituted in 62.5 μl of NO3-NO2 buffer, and NO3-NO2 was determined by using a kit purchased from Cayman Chemicals (Ann Arbor, MI). The optical density was determined at 540 nm by using a microplate reader (Bio-Rad model 550). Because samples were concentrated 8-fold (500/62.5) after complete evaporation and reconstitution, the NO3-NO2 concentration obtained at the end of the assay was divided by eight. Thereafter, this value was normalized by tissue weight.
TNF-α Measurement.
TNF-α was determined by the sandwich enzyme immunoassay technique by using a rat TNF-α kit bought from Quantikine Immunoassay R&D Systems, Minneapolis. The optical density was determined at 450 nm with a wavelength correction set at 540 nm by using a microplate reader (Bio-Rad model 550).
Statistical Analysis.
Statistical differences between two means were calculated by Student's t test when the data passed the normality and equal variance test. When the data failed to pass this test, a nonparametric test was performed, namely the Mann–Whitney U test. In the case of measurement of plasma leptin in the in vivo experiments, the data are expressed as “percentage of the initial value” in which the initial concentration of plasma leptin was considered 100%.
Results
Correlation of Plasma Leptin with Body Weight.
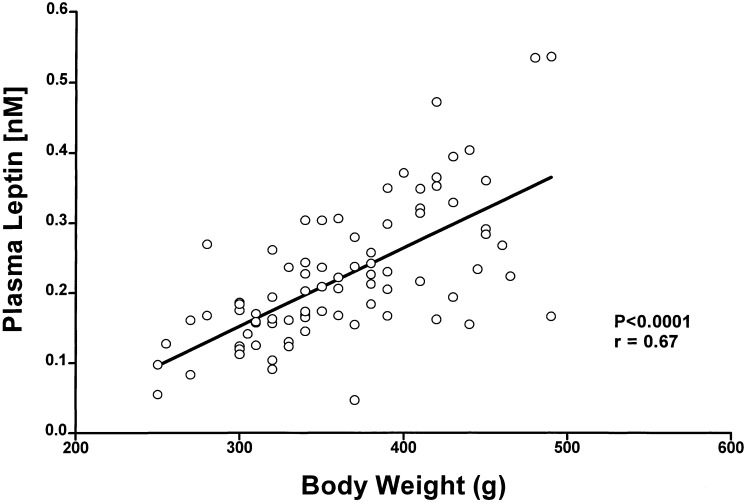
There was a highly significantly positive correlation between body weight and plasma leptin concentrations from cannulated rats with body weights ranging between 250 and 500 g (Fig. 1).
Figure 1.
Correlation between plasma leptin concentration and body weight. Blood samples were obtained from conscious, freely moving male rats bearing a jugular catheter (n = 88); plasma leptin was determined and plotted vs. body weight. There was a significant correlation: r = 0.67, P < 0 0001.
Comparison of the Relationship of NO3-NO2 and Leptin with Body Weight.
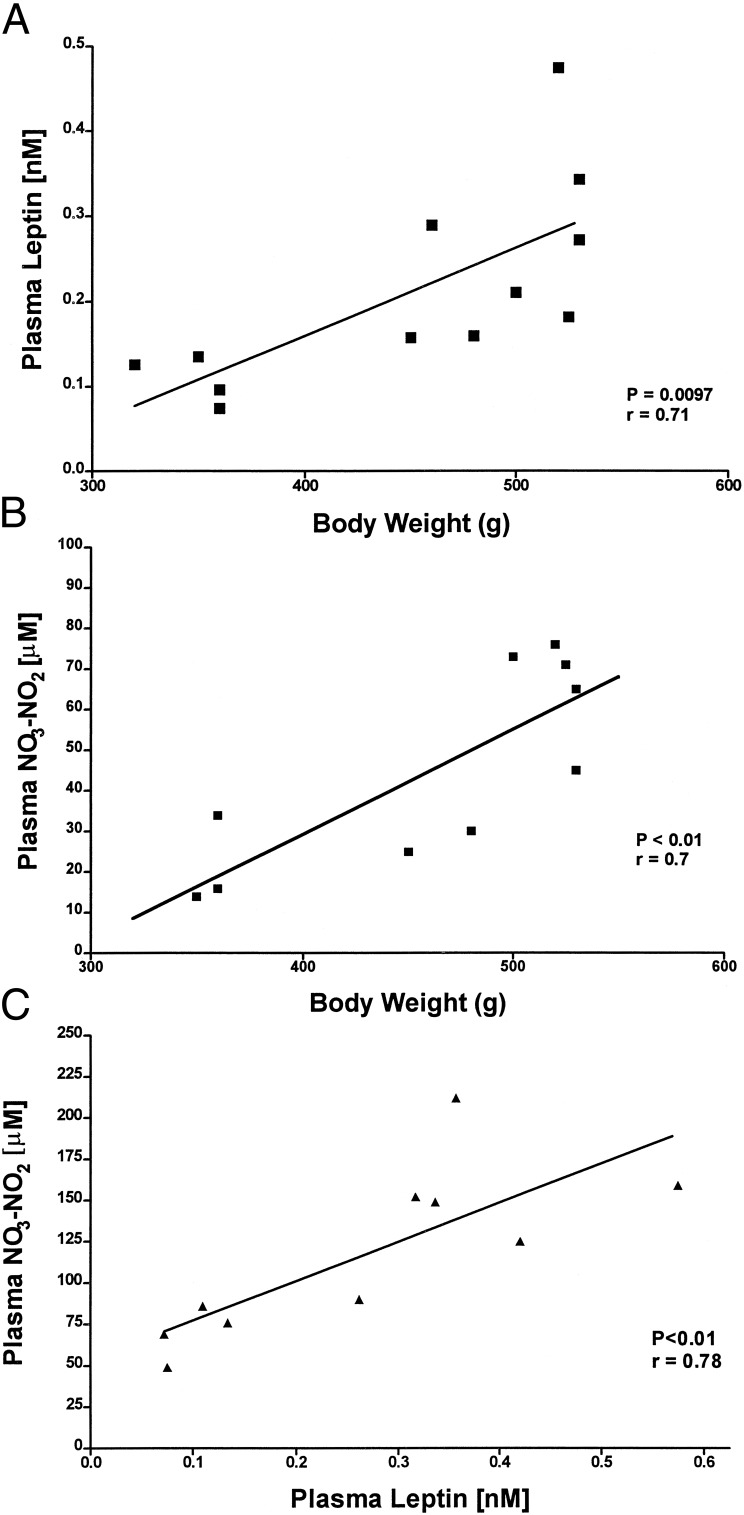
To determine whether plasma NO3-NO2 as well as leptin were related to body weight, concentrations of both substances were determined in trunk blood from individual decapitated rats. When plasma NO3-NO2 and leptin were correlated with body weight under these conditions, there was a highly significant positive correlation of both plasma NO3-NO2 and leptin with body weight (Fig. 2 A and B). Consequently, we correlated plasma leptin and NO3-NO2 values in individual rats. This revealed a highly significant correlation between the two (Fig. 2C). Indeed, as body weight increased, both leptin and NO3-NO2 levels increased linearly, but the slope was 75,000 times greater for NO3-NO2 than for leptin (P < 0.0001).
Figure 2.
Correlations among leptin, NO3-NO2, and body weight in decapitated rats. Ten male rats were decapitated, and trunk blood was collected to determine leptin and NO3-NO2. (A) Correlation between plasma leptin and body weight: r = 0.71, P < 0.01. (B) Correlation between plasma NO3-NO2 and body weight: r = 0.7, P < 0.01. (C) Correlation between plasma concentrations of NO3-NO2 and leptin: r = 0.78, P < 0.01.
Circadian Variation of NO3-NO2 and Leptin.
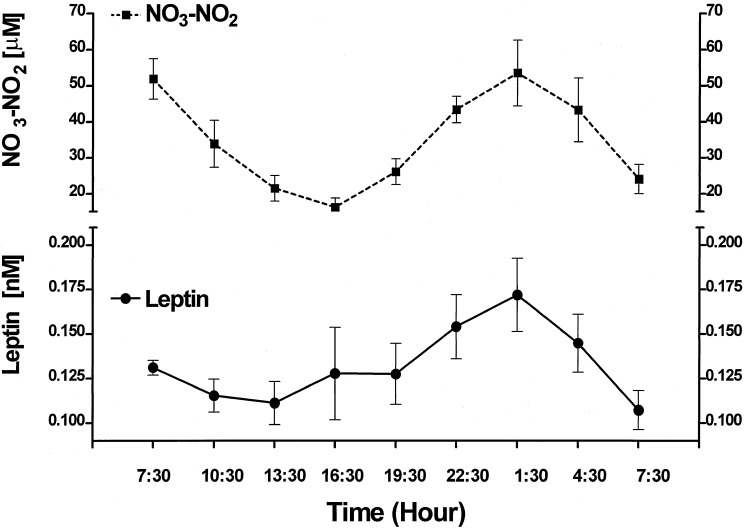
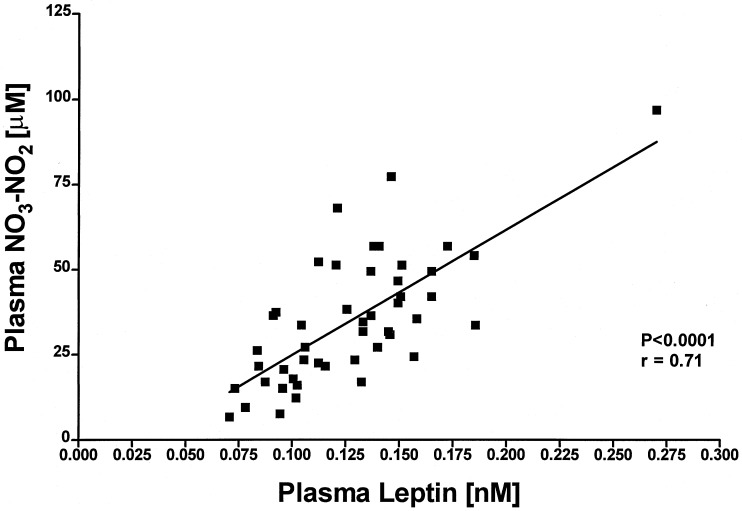
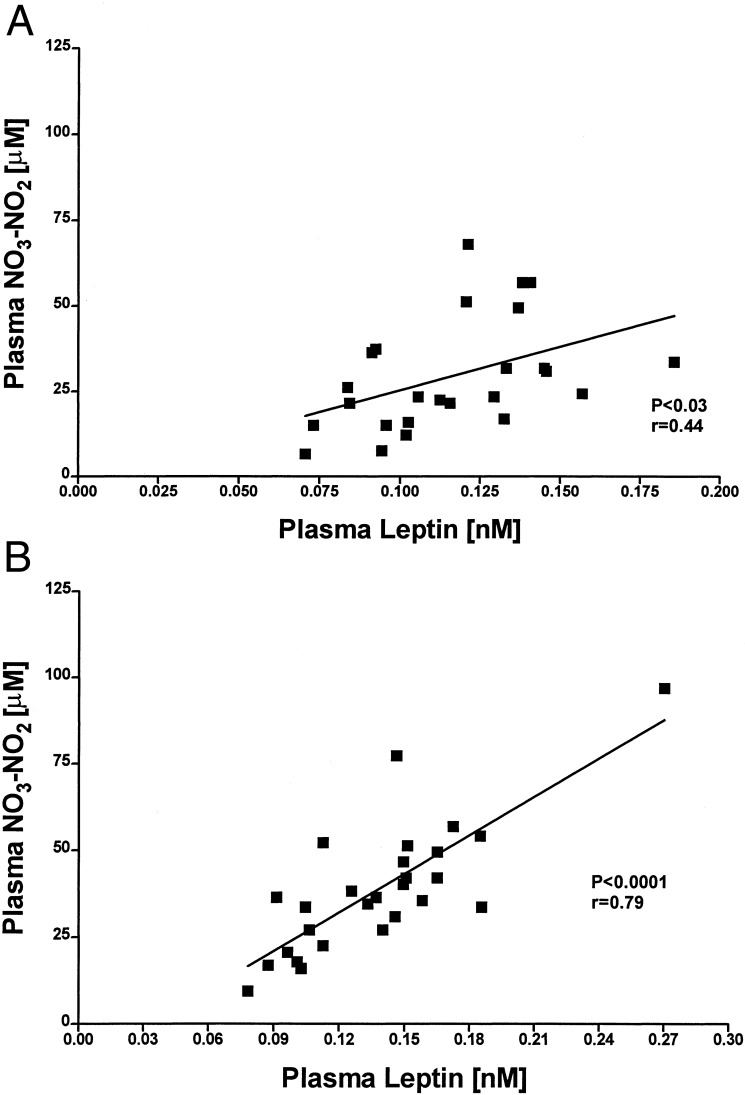
We have previously reported a significant circadian rhythm of plasma leptin (18). When NO3-NO2 was measured in the same plasma samples (Fig. 3), the results revealed a similar circadian rhythm of NO3-NO2; however, the magnitude of the rhythm was 300,000 times greater (P < 0.0001) than that of leptin (Fig. 3). There was a highly significant difference between the minimal values of NO3-NO2 at 1630 h and the maximal at 0130 h (P < 0.01) in the following night after which the values returned to a minimum at 0730 hours. When plasma leptin was correlated with plasma NO3-NO2 over the 24-h period there was a highly significant correlation (P < 0.001, r = 0.71) (Fig. 4). The correlation was much less significant between 0730 and 1930 hours, than from 1930 to 0730 hours (Fig. 5). because of significantly greater variance around the regression line than that from 1930 to 0730 hours. Concentrations of leptin and NO3-NO2 were lower at 0730 hours at the end of the experiment than those at the same time on the preceding day at the start of the experiment but this difference was significant only in the case of NO3-NO2 (P < 0.01) (Fig. 3).
Figure 3.
Profiles of the circadian variations of plasma NO3-NO2 and leptin. In this and subsequent figures, values are means ± SEM. The number of rats was eight at each time point.
Figure 4.
Correlation between plasma leptin and NO3-NO2 during their circadian variation.
Figure 5.
Correlation between plasma leptin and NO3-NO2 between: 0730 h and 1930 h (A), r = 0.44 and P < 0.03; and 1930 h and 0730 h (B), r = 0.79 and P < 0.0001.
Effect of Leptin on NO3-NO2 Released from EFPs Incubated in Vitro.
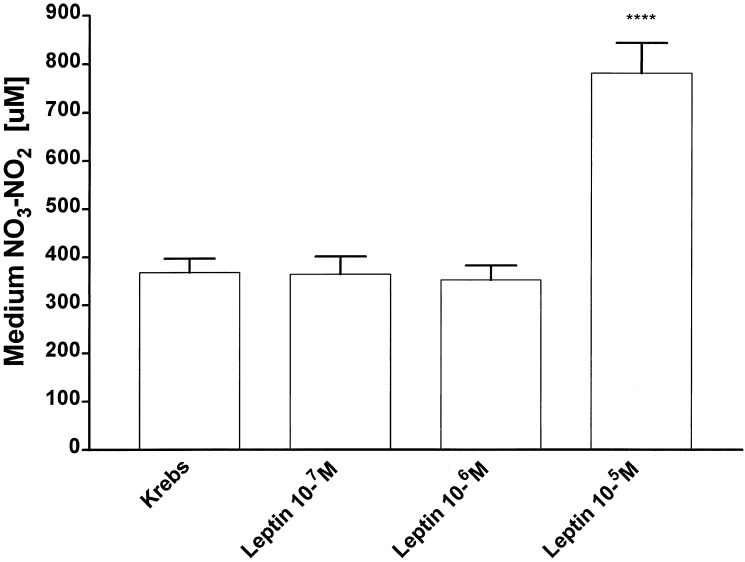
To evaluate the effect of leptin on NO3-NO2 production in vitro, EFPs were preincubated for a period of 1 h in Krebs buffer alone. The preincubation medium was discarded and replaced by Krebs alone (control group) or Krebs containing different concentrations of leptin (10−7M–10−5M) and thereafter the EFPs were incubated for 3 h (Fig. 6). Incubation with the two lower concentrations of leptin (10−7M–10−6M) had no effect on NO3-NO2 output by EFPs, but the highest concentration (10−5M) increased the production of NO3-NO2 by 100% over that of the control group (P < 0.0001) (Fig. 6). This means that each molecule of leptin induced the production of ≈35 molecules of NO3-NO2.
Figure 6.
Effect of leptin on NO release from EFP in vitro. Eight hemi-EFP were incubated in each experimental group. *, significant differences vs. saline. ****, P < 0.0001.
Effect of Leptin on Plasma NO3-NO2 in Vivo.
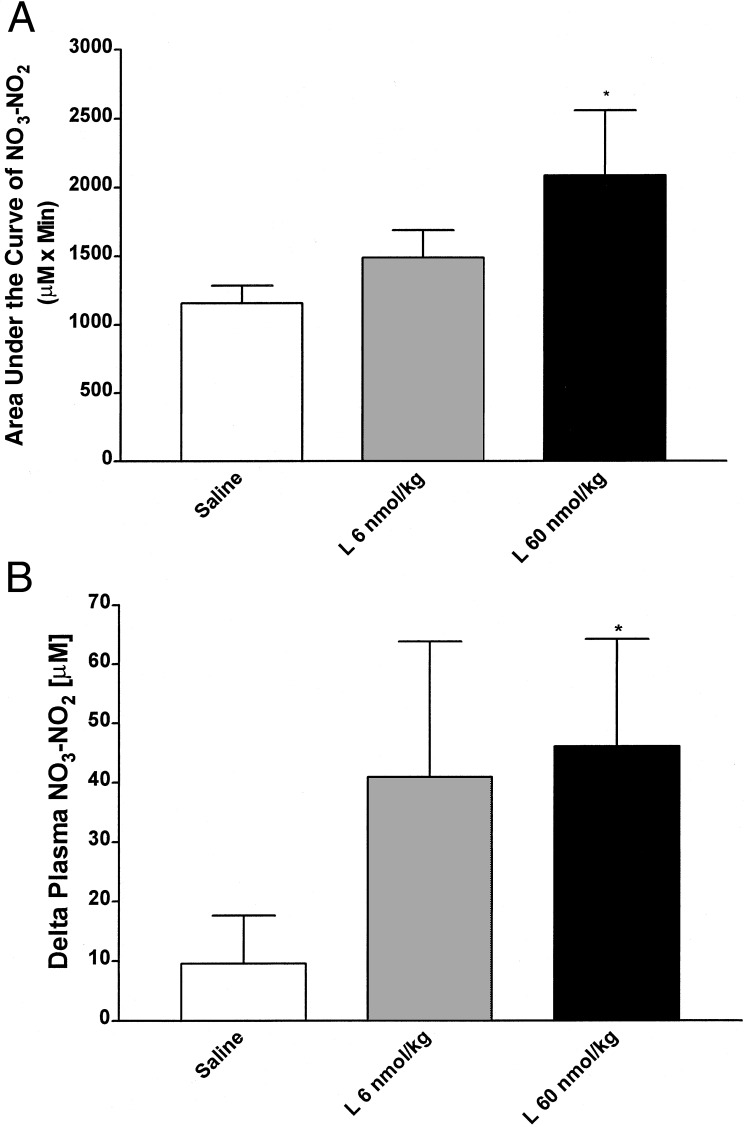
At 30 min after placement of the jugular catheter, the first blood sample was collected, and 0.5 ml of saline (control group) or leptin (6 or 60 nmol/kg) was injected (Fig. 7). Thereafter, blood samples were collected at 15, 30, 60, 90, and 120 min after surgery. Injection of saline in five rats increased NO3-NO2 concentration at 90 min, 2-fold in two rats and 3-fold in one rat. In the other two rats, there was no change (one rat) or a decline of 3-fold (one rat) in plasma NO3-NO2 concentration. There was no significant change in mean NO3-NO2. Injection of leptin (6 nmol/kg) induced variable increases in plasma NO3-NO2 in all five rats varying in magnitude from 0.5- to 14-fold. Administration of 60 nmol/kg leptin also provoked increases of different magnitudes in plasma NO3-NO2 concentration in all of the rats (six) at different times (15–90 min) between 0.5- and 18-fold. Thus, in three of five control rats, plasma NO3-NO2 was increased, whereas it was increased in all 11 rats given leptin [P < 0.05, data not shown (χ2)]. Because there was great variance in the leptin-injected rats at nearly every time point, the Δ maximum and area under the curve were calculated. Both of these analyses gave significant differences between leptin 60 nmol/kg-treated rats and saline-injected rats (P < 0.05) (Fig. 7), but there was no significant difference between leptin 6 nmol/kg-treated rats and saline-treated rats.
Figure 7.
Effect of leptin (L) on plasma NO3-NO2 in vivo. There were five saline-injected and leptin 100 μg/kg-injected rats and six leptin 1,000 μg/kg-injected rats. *, significant differences vs. saline. *, P < 0.05. (A) Area under the plasma NO3-NO2 concentration curve between 15 and 90 min. (B) Maximum increase of leptin observed regardless of the time (Δ maximum).
Effect of Leptin on TNF-α Release from EFPs Incubated in Vitro.
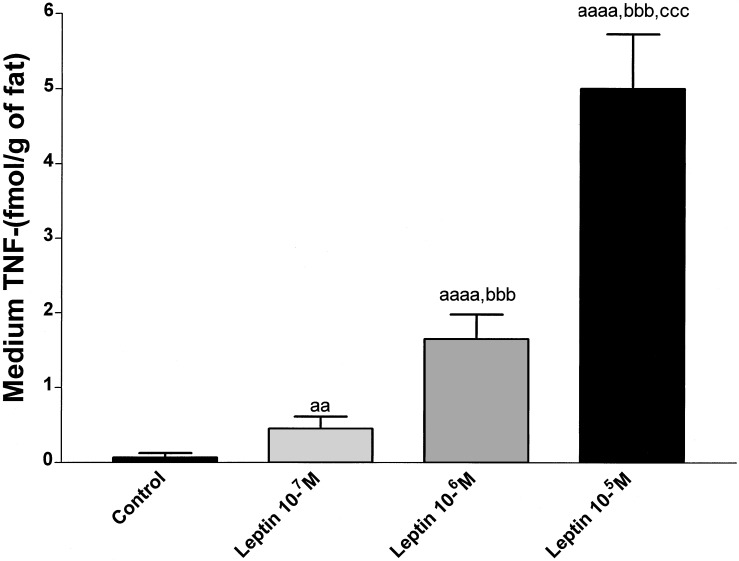
To evaluate the effect of leptin on TNF-α production in vitro, TNF-α was measured in the medium of the same in vitro experiment that was performed to determine the effect of leptin on NO3-NO2 (Fig. 8). Leptin increased TNF-α secretion in a dose-related fashion from 4-fold (10−7M) (P < 0.01 vs. control) to 40-fold (10−5M) (P < 0.001 vs. control) (Fig. 8). In all of the cases there were significant differences among the different doses (P < 0.001) (Fig. 8).
Figure 8.
Effect of leptin on TNF-α release from EFP incubated in vitro. Eight EFP were incubated in each experimental group. Lower case “a” indicates significance vs. Krebs (control group): aa, P < 0.01; aaaa, P < 0.0001. Lower case “b” indicates significance vs. leptin 10−7 M: bbb, P < 0.001. Lower case “c” indicates significance vs. leptin 10−6 M: ccc, P < 0.001.
Effect of Leptin on Plasma TNF-α in Vivo.
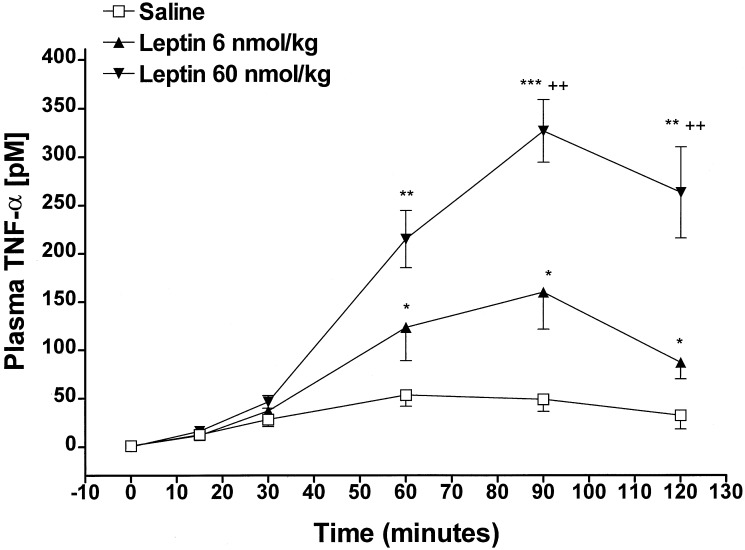
TNF-α was measured in the same plasma samples used to measure NO3-NO2. Injection of saline increased plasma TNF-α by 6-fold within 15 min (P < 0.02 vs. time 0) and values gradually increased, reaching maximum at 60 min (P < 0.001 vs. time 0), and reached a plateau between 60 and 120 min (Fig. 9). Administration of leptin increased plasma TNF-α in a dose-related fashion. Both doses of leptin (6 and 60 nmol/kg) increased plasma TNF-α concentrations in parallel with that of the control rats between 0 and 30 min. Thereafter, leptin provoked dose-dependents increases in plasma TNF-α above those of the control between 60 and 120 min. Both doses provoked the maximum plasma TNF-α concentration at 90 min, when the increase above that of control group was 3-fold in the leptin (6 nmol/kg)-injected rats (P < 0.05) and 6- fold in the leptin (60 nmol/kg)-injected rats (P < 0.001), and the difference between doses was 2-fold (P < 0.01) (Fig. 9).
Figure 9.
Effect of leptin on plasma TNF-α concentration in vivo. The number of animals were seven saline-injected and six leptin-injected rats. *, significant differences vs. saline-injected rats. *, P < 0.05; **, P < 0.01; ***, P < 0.001. +, significant differences vs. leptin 6 nmol/kg-treated rats. ++, P < 0.01.
Discussion
Because leptin increased the release of luteinizing hormone-releasing hormone from the hypothalamus and the gonadotropins, luteinizing hormone and follicle-stimulating hormone, from the pituitary by activating NOS and releasing NO (1, 2), we hypothesized that leptin also might control the release of NO into the blood stream. Therefore, our first experiment was to determine whether a correlation existed between plasma levels of leptin and NO, measuring NO3-NO2 as an index of NO production. As the body weight of the rats increased, the concentrations of both leptin and NO3-NO2 linearly increased in plasma; however, the rate of increase of NO3-NO2 was 75,000-fold greater than that of leptin. This remarkably greater increase in NO3-NO2 than leptin can be explained by hypothesizing that leptin directly or indirectly activates NOS. If this is the case, one molecule of leptin might activate one molecule of NOS, which could by its enzymatic action convert 75,000 molecules of arginine into 75,000 molecules of NO metabolized to the same number of molecules of NO3-NO2. The plasma concentration of NO3-NO2 is an estimate of NO production because it is metabolized stoichiometrically to NO3-NO2. However, the plasma concentration of NO3-NO2 is the balance of production minus excretion in the urine and further metabolism of NO3-NO2. There have been no studies of the clearance of NO3-NO2 from plasma; however, physical stress decreases plasma NO3-NO2 with a half life of 10 min (16), indicating that its removal by further metabolism and renal excretion is very rapid. We hypothesize that the concomitant increase in leptin with body weight is related to increased size of the fat stores of the animals as they grew. Indeed, it has been recently reported that the fat stores increase in proportion to weight gain even in male rats of the size range used herein that are quite young (19).
Because there was a positive linear correlation between plasma leptin and NO3-NO2 and we showed that leptin fluctuates in a circadian rhythm in the rat (18), as in humans (20), we hypothesized that NO3-NO2 would also fluctuate in parallel with leptin. Indeed, there was a circadian variation of plasma NO3-NO2 that correlated throughout the 24 h with that of plasma leptin. Because we have shown that lipopolysaccharide-induced leptin release is not mediated by NO (21), it is unlikely that NO increases leptin release. On the contrary, on the basis of our hypothesis leptin would stimulate NO secretion. Therefore, we determined the effect of leptin on NO3-NO2 by performing in vitro and in vivo experiments. Because the main source of leptin is the adipocytes, that have leptin receptors on their cell membranes (4) and express both the inducible NOS and the constitutive eNOS isoforms (5), we hypothesized that leptin would increase NO release from incubated EFP.
The highest dose of leptin tested (10−5M) increased NO3-NO2 release into the medium, indicating that leptin directly or indirectly activates NOS causing release of NO. Although the concentration required was quite high, such concentrations probably exist adjacent to adipocytes after exocytosis of pinocytotic vesicles containing leptin that is sufficient for autocrine activation of NOS by leptin receptors on adipocytes and paracrine activation of eNOS by leptin receptors on vascular endothelium adjacent to the adipocytes. Therefore, leptin release from adipocytes would increase NO production leading to increased plasma NO3-NO2. The released NO would diffuse to adjacent arterioles and venules relaxing their smooth muscle via activation of guanylyl cyclase and generation of cGMP from GTP. Relaxation would be induced by protein kinase G, resulting in dilatation of vessels and increased blood flow to the adipocytes. As was the case in vivo, each molecule of leptin added to the incubation medium, once the threshold concentration was reached, released 12 molecules/h of NO, suggesting that leptin activated NOS. Surprisingly, the in vivo experiments suggested that the number of molecules of NO released by a single leptin molecule was ≈1,030 molecules/h. This suggests that leptin was much more effective to activate NOS in vivo than in vitro for some unexplained reasons. In a recent paper published while our research was in progress, it was also shown in anesthetized rats that i.v. administration of leptin into the femoral vein increased plasma NO3-NO2 (22). Similar to our results, the increase in plasma NO3-NO2 in their experimental paradigm was nearly 100% (22).
Furthermore, because in recent research we have determined that the EFP is an important source of TNF-α (C.A.M., W.H.Y., and S.M.M., unpublished data), we also studied the possible role of leptin to alter TNF-α secretion. Surprisingly, we determined that a 100-fold lower concentration of leptin (10−7M) than the one that elicited the increase in NO3-NO2 was effective to increase TNF-α by 4-fold, and the highest concentration of leptin (10−5M) increased TNF-α 60-fold, suggesting that leptin-induced TNF-α might directly activate NOS resulting in release of NO that was metabolized to NO3-NO2. TNF-α has been demonstrated to be a potent stimulator of NO (9) by inducing the expression of inducible NOS that is present in adipose tissue (5).
The in vitro results were confirmed in vivo because i.v. administration of leptin into conscious rats bearing a jugular catheter also increased plasma NO3-NO2 and TNF-α. As was the case in vitro, the dose of leptin to increase plasma NO3-NO2 was higher (10-fold) than that which released TNF-α supporting the hypothesis that leptin released TNF-α that in turn activates NOS to release NO. However, if this is the case, why does the dose of leptin have to be increased 100-fold before there is significant release of NO in vitro? Perhaps the two act together to activate NOS inducing NO release.
Interestingly, in contrast to NO where each molecule of leptin released many NO molecules; >700 molecules of leptin were required to release a molecule of TNF-α in vivo and ≈107 molecules were required in vitro. These findings suggest that the release of TNF-α by leptin does not contribute to leptin-induced NO secretion but is an associated event.
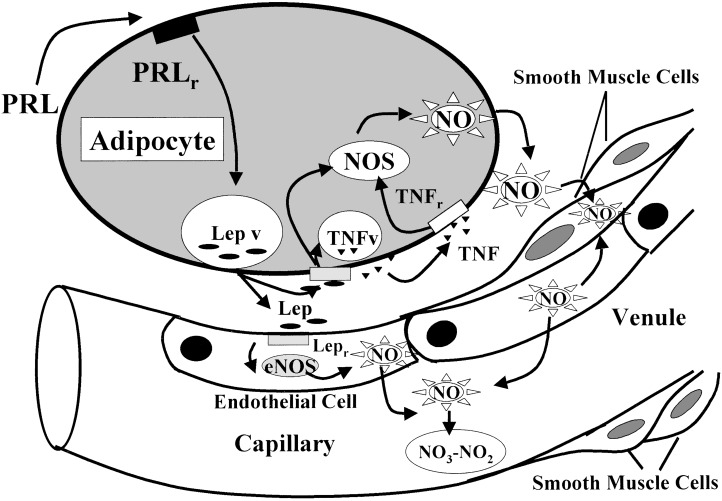
In summary, we hypothesize (Fig. 10) that prolactin stimulates leptin release from the adipocytes (18). Leptin combines with its transducing leptin receptor (OB-Rb) present on the cell membrane of both adipocytes and endothelial cells to increase the activity of eNOS by increasing intracellular free calcium that combines with calmodulin and activates eNOS. The NO released into the interstitium diffuses into the smooth muscle cells of the adjacent arterioles and venules. There it activates guanylyl cyclase that converts GTP into cGMP that relaxes the myocytes, thereby dilating the vessels and increasing the blood flow to adipose tissue required for metabolism.
Figure 10.
For description see last paragraph of Discussion. Closed arrows indicate stimulation. Prolactin (PRL), PRL receptor (PRLr), leptin (Lep), Lep vesicles (Lep v), Lep receptor (Lepr), TNF vesicle (TNFv), and TNF receptor (TNFr).
Acknowledgments
We would like to thank Judy Scott and Natasha Hunter for their excellent secretarial assistance. This work was supported by National Institutes of Health Grant MH51853.
Abbreviations
- eNOS
endothelial NOS
- NO3-NO2
nitrate and nitrite
- cGMP
cyclic GMP
- EFP
epididymal fat pads
- TNF
tumor necrosis factor
Footnotes
Preliminary reports of this research were presented at the Society for Neuroscience Annual Meeting, New Orleans, 2000; International Allergy Society, New York, 2001; International Neuropeptide Society, Antalaya, Turkey, 2001; and the Psycho Neuroendocrinoimmunology Symposium, Regensburg, Germany, 2001.
References
- 1.Yu W H, Walczewska A, Karanth S, McCann S M. Proc Natl Acad Sci USA. 1997;94:1023–1028. doi: 10.1073/pnas.94.3.1023. [DOI] [PMC free article] [PubMed] [Google Scholar]
- 2.Yu W H, Walczewska A, Karanth S, McCann S M. Endocrinology. 1997;138:5055–5058. doi: 10.1210/endo.138.11.5649. [DOI] [PubMed] [Google Scholar]
- 3.Morash B, Li A, Murphy P R, Wilkinson M, Ur E. Endocrinology. 1999;140:5995–5998. doi: 10.1210/endo.140.12.7288. [DOI] [PubMed] [Google Scholar]
- 4.Bornstein S R, Abu-Asab M, Glasow A, Path G, Hauner H, Tsokos M, Chrousos G P, Scherbaum W A. Diabetes. 2000;49:532–538. doi: 10.2337/diabetes.49.4.532. [DOI] [PubMed] [Google Scholar]
- 5.Ribiere C, Jaubert A M, Gaudiot N, Sabourault D, Marcus M L, Boucher J L, Denis-Henriot D, Giudicelli Y. Biochem Biophys Res Commun. 1996;222:706–712. doi: 10.1006/bbrc.1996.0824. [DOI] [PubMed] [Google Scholar]
- 6.McCann S M, Licinio J, Wong M L, Yu W H, Karanth S, Rettori V. Exp Gerontol. 1998;33:813–826. doi: 10.1016/s0531-5565(98)00050-3. [DOI] [PubMed] [Google Scholar]
- 7.Vargas H M, Cuevas J M, Ignarro L J, Chaudhuri G. J Pharmacol Exp Ther. 1991;257:1208–1215. [PubMed] [Google Scholar]
- 8.Soares T J, Coimbra T M, Martins A R, Pereira A G, Carnio E C, Branco L G, Albuquerque-Araujo W I, de Nucci G, Favaretto A L, Gutkowska J, et al. Proc Natl Acad Sci USA. 1999;96:278–283. doi: 10.1073/pnas.96.1.278. [DOI] [PMC free article] [PubMed] [Google Scholar]
- 9.Oswald I P, Dozois C M, Fournout S, Petit J F, Lemaire G. Eur Cytokine Network. 1999;10:533–540. [PubMed] [Google Scholar]
- 10.McCann S M, Kimura M, Karanth S, Yu W H, Mastronardi C A, Rettori V. Ann NY Acad Sci. 2000;917:4–18. doi: 10.1111/j.1749-6632.2000.tb05368.x. [DOI] [PubMed] [Google Scholar]
- 11.McCann S M, Kimura M, Yu W H, Mastronardi C A, Rettori V, Karanth S. Vitam Horm. 2001;63:29–62. doi: 10.1016/s0083-6729(01)63002-4. [DOI] [PubMed] [Google Scholar]
- 12.Zhang F, Basinski M B, Beals J M, Briggs S L, Churgay L M, Clawson D K, DiMarchi R D, Furman T C, Hale J E, Hsiung H M, et al. Nature (London) 1997;387:206–209. doi: 10.1038/387206a0. [DOI] [PubMed] [Google Scholar]
- 13.Klinger M M, MacCarter G D, Boozer C N. Lab Anim Sci. 1996;46:67–70. [PubMed] [Google Scholar]
- 14.Mastronardi C A, Yu W H, Srivastava V K, Dees W L, McCann S M. Proc Natl Acad Sci USA. 2001;98:14720–14725. doi: 10.1073/pnas.251543598. [DOI] [PMC free article] [PubMed] [Google Scholar]
- 15.Mastronardi C A, Yu W H, McCann S M. Neuroimmunomodulation. 2001;9:148–156. doi: 10.1159/000049019. [DOI] [PubMed] [Google Scholar]
- 16.Mastronardi C A, Yu W H, McCann S M. Exp Biol Med. 2001;226:296–300. doi: 10.1177/153537020122600405. [DOI] [PubMed] [Google Scholar]
- 17.Harms P G, Ojeda S R. J Appl Physiol. 1974;36:391–392. doi: 10.1152/jappl.1974.36.3.391. [DOI] [PubMed] [Google Scholar]
- 18.Mastronardi C A, Walczewska A, Yu W H, Karanth S, Parlow A F, McCann S M. Exp Biol Med. 2000;224:152–158. doi: 10.1046/j.1525-1373.2000.22414.x. [DOI] [PubMed] [Google Scholar]
- 19.Iossa S, Lionetti L, Mollica M P, Barletta A, Liverini G. J Nutr. 1999;129:1593–1596. doi: 10.1093/jn/129.8.1593. [DOI] [PubMed] [Google Scholar]
- 20.Licinio J, Negrao A B, Mantzoros C, Kaklamani V, Wong M L, Bongiorno P B, Mulla A, Cearnal L, Veldhuis J D, Flier J S, et al. Proc Natl Acad Sci USA. 1998;95:2541–2546. doi: 10.1073/pnas.95.5.2541. [DOI] [PMC free article] [PubMed] [Google Scholar]
- 21.Mastronardi C A, Yu W H, Rettori V, McCann S M. Neuroimmunomodulation. 2001;8:91–97. doi: 10.1159/000026458. [DOI] [PubMed] [Google Scholar]
- 22.Fruhbeck G. Diabetes. 1999;48:903–908. doi: 10.2337/diabetes.48.4.903. [DOI] [PubMed] [Google Scholar]


