

Abstract
Tomato (Solanum lycopersicum L.), one of the most widely grown vegetables in the world, has been seriously impacted in the past decade by the emerging tomato brown rugose fruit virus (ToBRFV). ToBRFV is a seed-borne tobamovirus, with ability to overcome the commonly used Tm-22 resistance gene in tomato. The objective of this study was to conduct quantitative trait locus (QTL) mapping and identify single-nucleotide polymorphism (SNP) markers associated with ToBRFV resistance in tomato. Two F2 populations were used for QTL mapping: One derived from a cross between S. pimpinellifolium USVL333 (PI 390718) × USVL332 (PI 390717) and another from ‘Moneymaker’ × USVL332 (PI 390717), with population sizes of 195 and 79 plants, respectively. The resistance trait was derived from the S. pimpinellifolium accession USVL332 (PI 390717). A major QTL for ToBRFV resistance was identified on chromosome 11 (SL4.0ch11), with the peak located at approximately 46.84 Mbp. This QTL spans a 22-kb interval between 46,825,788 bp and 46,847,421 bp, as determined through both genome-wide association study (GWAS) and QTL linkage mapping. Three SNP markers, SL4.0ch11_46825788, SL4.0ch11_46847421, and SL4.0ch11_46850215, demonstrated the most significant association with high LOD values (LOD = 13 in the Blink model) in GWAS analysis. In this genomic region, two disease resistance gene analogs, Solyc11g062150 (TIR-NBS-LRR resistance protein, Toll-Interleukin receptor) and Solyc11g062180 (disease resistance protein, leucine-rich repeat), were identified, which may serve as candidates for ToBRFV resistance. The QTL identified in this study could be valuable for plant breeders in facilitating tomato breeding with ToBRFV resistance.
Supplementary Information
The online version contains supplementary material available at 10.1007/s00122-025-04974-0.
Introduction
Tomato (Solanum lycopersicum L.), one of the most important vegetable crops globally, has an annual farm gate value exceeding $2 billion in the United States (U.S.) (FAO Statistics 2021). California leads in tomato production for processing, while Florida dominates fresh-market tomato production. Additionally, the U.S. imports significant quantities of fresh tomatoes, primarily from Mexico and Canada, which are often grown in greenhouses (Guan et al. 2018). Domestic greenhouse tomato production in the U.S. is also expanding but remains insufficient to meet the strong demand (Guan et al. 2018). However, the intensive production practice and controlled greenhouse environment in greenhouse tomato productions have facilitated the emergence of several seed-borne and mechanically transmitted viruses, posing significant challenges to the tomato productions worldwide (Rivarez et al. 2021).
Tomato brown rugose fruit virus (ToBRFV), an emerging tobamovirus, presents a severe threat to global tomato production (Salem et al., 2023; Zhang et al. 2022). First identified in Jordan and Israel in 2014–2015 (Luria et al. 2017; Salem et al. 2016), ToBRFV has since spread to more than 40 countries worldwide (EPPO 2025). The rapid spread of ToBRFV has resulted in a global pandemic (Salem et al., 2023; Zhang et al. 2022). In the U.S., ToBRFV was first detected in greenhouse-grown tomatoes in California in 2018 (Ling et al. 2019). To mitigate its spread, the USDA-APHIS issued a Federal Order in 2019, later amended in 2024, requiring inspections of imported tomato and pepper seeds and propagating materials (USDA-APHIS 2024).
The global outbreaks of ToBRFV have been attributed to its seed-borne nature, resistance-breaking ability against resistance genes (Tm-1, Tm-2, and Tm-22), and increased international seed and produce trade (Chanda et al. 2021b; Luria et al. 2017; Maayan et al. 2018). For over 60 years, the Tm-22 gene (PI 128650) has been used to confer resistance to other tobamoviruses such as tomato mosaic virus (ToMV) (Alexander 1963; Carr 2024; Spiegelman and Dinesh-Kumar 2023). However, ToBRFV’s resistance-breaking capabilities have necessitated significant efforts to identify new genetic resistance sources, including work by public institutions (Kabas et al. 2022; Jaiswal et al. 2024; Jewehan et al. 2022a, 2022b; Zinger et al. 2021) and private companies through patent filings (Ashkenazi et al. 2018; Hamelink et al. 2019; Millenaar et al. 2021; Ykema et al. 2020). Several quantitative trait loci (QTLs) associated with ToBRFV resistance have been identified. These include regions on chromosomes 6, 9, and 11 in S. lycopersicum (Ashkenazi et al. 2018), chromosomes 2 and 11 (Zinger et al. 2021), and chromosome 11 (Millenaar et al. 2021). To our knowledge, there is still no available information on QTL analysis for ToBRFV-resistant S. pimpinellifolium which was recently identified (Jaiswal et al. 2024).
To support tomato breeding, there is an urgent need to identify molecular markers associated with ToBRFV resistance from the newly identified genetic resources. Our earlier research identified a resistant line of S. pimpinellifolium (PI 390717) that exhibits asymptomatic responses and low to undetectable virus titers (Jaiswal et al. 2024). The objective of this study was to identify QTLs associated with ToBRFV resistance in S. pimpinellifolium. Using two F2 populations derived from interspecific (S. pimpinellifolium × S. lycopersicum) and intraspecific (S. pimpinellifolium × S. pimpinellifolium) crosses, we identified a major QTL on chromosome 11 in S. pimpinellifolium PI 390717. Associated single-nucleotide polymorphisms (SNPs) located within a narrow region on chromosome 11 have the potential to serve as molecular markers for marker-assisted selection in tomato breeding programs.
Materials and methods
Plant materials and F2 genetic population development
To study the genetic inheritance of ToBRFV resistance in S. pimpinellifolium USVL332 (derived from PI 390717), two populations were developed by crossing the resistant S. pimpinellifolium parent USVL332 with two susceptible parents: S. lycopersicum ‘Moneymaker’ and S. pimpinellifolium USVL333 (derived from PI 390718). These crosses produced F1 seeds, which were then self-pollinated to generate F2 populations. The resulting F2 populations included 205 individuals from an intraspecies cross of two S. pimpinellifolium parents, USVL333 x USVL332 (designated as UU), and 80 individuals from an interspecies cross between ‘Moneymaker’ and USVL332 (designated as MU). These populations were used for phenotyping ToBRFV resistance and genotyping through whole-genome resequencing using NovaSeq to identify QTLs associated with ToBRFV resistance in S. pimpinellifolium USVL332 (PI 390717).
TOBRFV resistance evaluation
The phenotypic evaluation for ToBRFV resistance was conducted in a containment greenhouse at the U.S. Vegetable Laboratory in Charleston, SC, USA, using the ToBRFV-US isolate CA18-01 (GenBank accession no. MT002973) (Chanda et al., 2020; Ling et al. 2019). Virus inoculum preparation and mechanical inoculation of test plants followed the standard protocol described by Chanda et al. (2021b).
The developed populations were phenotyped based on symptom observation and serological tests to assess virus titers in the test plants. Symptoms were scored according to a disease severity index on a scale from 0 to 5. Class 0 represented asymptomatic systemic leaves; class 1, mild mosaic on systemic leaves; class 2, mosaic on systemic leaves; class 3, mosaic with leaf deformation; class 4, severe mosaic and mottling with leaf deformation; and class 5, severe mottling, leaf deformation, and string-like leaves (Jaiswal et al. 2024).
In addition to symptom-based phenotyping, serological testing (enzyme-linked immunosorbent assay, ELISA) for ToBRFV was performed according to the manufacturer’s instructions (Agdia, Elkhart, IN, USA). Plants classified as asymptomatic (class 0) with low or non-detectable virus titers were considered resistant (R). Plants with disease severity scores of 1 or 2 were considered moderately susceptible (MS), while those with scores of 3–5 were classified as susceptible (S).
DNA extraction, sequencing, and SNP genotyping
Genomic DNA was extracted from freshly collected young leaves of each inoculated plant in two F2 populations using the DNeasy® Plant Mini Kit (Qiagen, Germantown, MD). Emerging trifoliate leaves were collected from each of the three parents and 285 F2 individuals. DNA concentration was adjusted to 10 µg/mL using a Nanophotometer® P-class (Implen, Westlake Village, CA).
The 285 F2 samples (205 UU and 80 MU), along with three parents, were subjected to whole-genome resequencing (WGR) with 2 × tomato genome size coverage (~ 2 Gb sequencing data) at the Texas A&M University’s Genomics and Bioinformatics Center. DNA sequence libraries were prepared using the PerkinElmer NEXTFLEX Rapid XP Kit protocol. Tomato samples were sequenced on an Illumina 6000 system with NovaSeq S4 flow cell and Xp workflow using the 2 × 150 bp recipe. FASTQ files were processed using the Illumina Dynamic Read Analysis for Genomics (DRAGEN) Bio-IT processor, and variant calling (SNP and insertions/deletions) was conducted using the DRAGEN pipeline (v3.8.4) to map sequence reads to the Solanum lycopersicum ITAG4.0 reference genome (https://data.jgi.doe.gov/refine-download/phytozome?organism=Slycopersicum&expanded=691) (Hosmani et al. 2019).
A total of 5,160,657 SNPs were identified across the 12 chromosomes in the two tested F2 populations. A chi-square test was performed on all 5,160,657 SNPs obtained from DNA sequencing using a Visual Basic (VB) script in Microsoft Excel. SNPs fitting a 1:1 segregation ratio for homozygous alleles (P-value > 0.01) and showing allele differences between the resistant parent (‘USV332’) and the two susceptible parents (‘Moneymaker’ and ‘USVL333’) were retained for further analysis. SNPs with more than 5% missing data were filtered out. After filtering, 440,962 SNPs remained.
A single-marker regression (SMR) analysis of these SNPs identified a QTL on chromosome 11. To reduce the dataset, 10,000 SNPs were randomly selected from each chromosome, except chromosome 11, where 26,357 SNPs were retained. Ultimately, 136,357 high-quality SNPs were used for further analysis in this study (Supplementary Figure S1). The SNP dataset for the tested population has been published in a public database at https://doi.org/10.6084/m9.figshare.25345042.v1.
Association analysis
A genome-wide association study (GWAS) was performed using the 136,357 SNPs across the 274 F2 individuals. We employed three different statistical models—single-marker regression (SMR), general linear model (GLM), and mixed linear model (MLM)—to perform GWAS analysis in TASSEL 5 (Bradbury et al. 2007). Additionally, GWAS analysis was conducted using GAPIT 3 (Genomic Association and Prediction Integrated Tool version 3) with four methods: standard mixed linear model (MLM), multiple loci mixed model (MLMM), fixed and random model circulating probability unification (FarmCPU), and Bayesian-information and linkage-disequilibrium iteratively nested keyway (BLINK). The principal component analysis (PCA) parameter was set to 3 (Wang and Zhan 2021; https://zzlab.net/GAPIT/index.html; https://github.com/jiabowang/GAPIT3).
Through extensive analyses using multiple models in TASSEL 5 and GAPIT 3 programs, we intended to identify reliable and stable ToBRFV resistance-associated SNP markers, candidate genes, and QTL regions in the two F2 populations. Using Bonferroni correction with a P-value at α = 0.05, calculated as 0.05 / number of SNPs, significant thresholds of associations were determined (López-Hernández and Cortés 2019). A logarithm of odds (LOD) of 6.44 was used as the significance threshold based on the 136,357 SNPs analyzed in this study. Additionally, a t-test was performed on all 136,357 SNPs using Visual Basic for Applications (VBA) in Microsoft Excel 2016.
Genetic mapping and QTL analysis
Linkage maps for the two F2 populations were constructed using JoinMap 4 (Van Ooijen 2006) and MSTmap (Wu et al. 2008; http://mstmap.org/). QTL mapping was performed using three different statistical methods: single-marker regression (SMR), single-trait Bayesian interval mapping (BIM), and single-trait multiple interval mapping (SMIM), implemented in QGene (Joehanes et al. 2008).
Candidate gene identification/detection
Candidate genes were searched within the 327 kb confidence interval of the QTL region on the Solanum lycopersicum ITAG4.0 reference genome assembly (https://data.jgi.doe.gov/refine-download/phytozome?organism=Slycopersicum&expanded=691). Resistance gene analogs located within or flanking the QTL were considered potential candidate genes for ToBRFV resistance.
Results
Resistance response to ToBRFV
The parent S. pimpinellifolium ‘USVL332’ exhibited resistance to ToBRFV infection, whereas the two other parents, S. pimpinellifolium ‘USVL333’ and S. lycopersicum ‘Moneymaker,’ were susceptible (Fig. 1). All F1 individuals from both populations, ‘USVL333’ x ‘USVL332’ (UU) and ‘Moneymaker’ x ‘USVL332’ (MU), were susceptible to ToBRFV infection (Fig. 1), indicating that resistance in ‘USVL332’ was recessive. The resistance segregation ratio in the F2 population followed a 1 resistant (R):3 susceptible (S) (MS + S) ratio, with P = 0.30 for the intraspecific cross (UU) and P = 0.85 for the interspecific cross (MU). Similarly, the combined F2 populations also conformed to a 1 R:3 S (MS + S) ratio, with P = 0.44 (Table 1 and Fig. 2), confirming the recessive inheritance of resistance in USVL332.
Fig. 1.
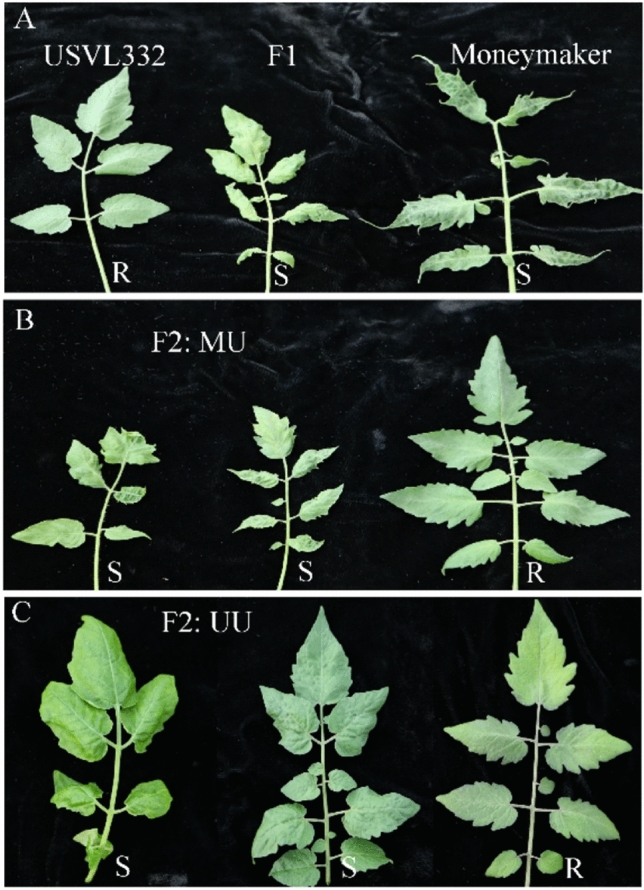
Representative phenotypes of genetic populations generated from their respective parents, F1 and F2 for resistance to tomato brown rugose fruit virus. A Phenotypic expression of the resistance line (S. pimpinellifolium ‘USVL332’) and the susceptible parent (S. lycopersicum ‘Moneymaker’) and their F1 plants upon inoculation with ToBRFV US isolate (CA18-01); B Representative phenotypes of a F2 MU population generated between ‘Moneymaker’ and ‘USVL332’ with mosaic, mottling, and leaf deformation (S) and normal healthy-looking leaves (R). C Representative phenotypes of a F2 UU population generated between ‘USVL333’ and ‘USVL332’ with mosaic and mottling (S) and normal asymptomatic leaves (R)
Table 1.
Chi-square test for segregation ratios of resistant and susceptible plants in F2 populations
| F2 population | R | MS | S | Total | R | MS + S | E(R) | E(S) | χ2 [1R:3(M + S)] | P-value |
|---|---|---|---|---|---|---|---|---|---|---|
| F2.UU | 55 | 97 | 43 | 195 | 55 | 140 | 48.75 | 146.25 | 1.068 | 0.30 |
| F2.MU | 19 | 11 | 49 | 79 | 19 | 60 | 19.75 | 59.25 | 0.038 | 0.85 |
| F2 | 74 | 108 | 92 | 274 | 74 | 200 | 68.5 | 205.5 | 0.589 | 0.44 |
Fig. 2.

Distributions of resistance (R), intermediate susceptible (MS), and susceptible (S) individuals against tomato brown rugose fruit virus infection in the two individual F2 populations (F2.UU and F2.MU) and a combination of both F2 populations (F2)
Population structure and principal component analysis
Population genetic diversity analysis was conducted on the two F2 populations, consisting of 274 individuals. Phylogenetic trees were constructed using the neighbor-joining (NJ) method in GAPIT 3, resulting in an unrooted tree (Fig. 3A) displaying three distinct sub-populations; a 3D graphical plot of principal component analysis (PCA) (Fig. 3B) illustrating the three sub-populations; and a PCA eigenvalue plot (Fig. 3C), generated using GAPIT 3, indicating that the first three principal components (PCs) explain the majority of the variation among the 274 F2 individuals. These plots and phylogenetic trees revealed the presence of three distinct clusters within the two combined F2 populations. The PCA data for the three sub-populations were subsequently used as a Q-matrix in the GWAS analysis to identify SNP markers associated with ToBRFV resistance.
Fig. 3.

Population genetic diversity analysis of two F2 populations consisting of 274 individuals. A Unrooted phylogenetic tree constructed using the neighbor-joining (NJ) method, showing three sub-populations; B 3D graphical plot of principal component analysis (PCA), illustrating the three sub-populations; and C PCA eigenvalue plot generated using GAPIT 3, showing that the top three principal components (PCA = 3) explain majority of the variation among the 274 F2 individuals
Among the three clusters (sub-populations), Q1 consisted of 71 individuals (25.9% of the entire population), including 28 from F2.MU (35.4% of F2.MU) and 43 from F2.UU (22.1% of F2.UU). Q2 included 131 individuals (47.8%), comprising 35 from F2.MU (44.3%) and 96 from F2.UU (49.2%). Q3 comprised 72 individuals (26.3%), with 16 from F2.MU (20.3%) and 56 from F2.UU (28.7%) (Table S1a, S1b, S1c-Fig). These results indicate the presence of three distinct sub-populations (clusters) within each of the F2 populations (F2.MU and F2.UU), as well as in the combined population, which supports the suitability of this material for GWAS.
Association study
Association analysis for ToBRFV resistance was conducted using four models: MLM, MLMM, FarmCPU, and Blink in GAPIT 3, and three models: SMR, GLM, and MLM in TASSEL 5. The observed versus expected LOD [-log10(p)] distributions in QQ-plots showed a significant divergence from the expected distribution across the four models (MLM, MLMM, FarmCPU, and Blink) (Fig. 4A), indicating the presence of SNPs associated with ToBRFV resistance in ‘USVL332’ within the F2 populations. The multiple Manhattan plots generated from the four models (Fig. 4B) identified significant SNPs on chromosome 11 with LOD values greater than 6.44 (the significance threshold), suggesting their association with ToBRFV resistance. Additionally, the multiple Manhattan and QQ-plots for ToBRFV resistance based on the four models are provided in Supplementary Figure S1. A Manhattan plot generated using the Blink model highlights a highly significant associated SNP marker (Fig. 4C).
Fig. 4.

Genome wide association study (GWAS) for ToBRFV resistance in Solanum pimpinellifolium was conducted. Four models: MLM, MLMM, FarmCPU, and Blink in GAPIT 3 were used to generate a QQ-plot (A) and Manhattan plots (B). A BLINK Manhattan plot (C) revealed SNP markers significantly associated with the ToBRFV resistance on chromosome 11
The QQ-plots and Manhattan plots generated using the three models in TASSEL 5 (Supplementary Fig. S2) showed similar trends to those from GAPIT 3 for ToBRFV resistance, with numerous significant SNP markers observed on chromosome 11. This suggests the presence of QTLs for ToBRFV resistance on chromosome 11.
Across the four models in GAPIT 3 and three models in TASSEL 5, five SNPs were identified as significantly associated with ToBRFV resistance. These SNPs, located within a ~ 178 kbp region spanning from 46,825,788 bp to 47,003,077 bp on chromosome 11, had LOD [-log(P)] values exceeding 6.44 in three or more of the seven models used (Table 2 and Fig. 4). In TASSEL 5, these SNPs had LOD values exceeding 12 in SMR, greater than 9 in GLM, and above 5.8 in MLM. Similarly, in GAPIT 3, the LOD values exceeded 6.5 in MLM (Table 2). Among these five SNPs, SL4.0ch11_46825788 showed the strongest association, with LOD > 6.44 in six out of seven models, including 13.03 in BLINK and 9.19 in FarmCPU. SL4.0ch11_46847421 had LOD > 6.44 in five models, including a value of 12.65 in MLMM. SL4.0ch11_46850215 and SL4.0ch11_46850230 each had LOD > 6.44 in three models, with LOD values close to 6.0 in TASSEL MLM. SL4.0ch11_47003077 had LOD > 6.44 in four models (Table 2). These SNPs ranked in significance as follows: SL4.0ch11_46825788 > SL4.0ch11_46847421 > SL4.0ch11_47003077 > SL4.0ch11_46850215 > SL4.0ch11_46850230. The R-squared values for these SNPs ranged from 10.89% for SL4.0ch11_46850230 in TASSEL MLM to 24.75% for SL4.0ch11_46847421 in SMR, with an average of 16.7% (Table 2). These results confirm the presence of a QTL on chromosome 11 associated with ToBRFV resistance.
Table 2.
SNP markers associated with ToBRFV resistance based on seven models
| SNP | Chr | Pos (bp) | MAF% | LOD[-Log(-value)] in GAPIT3 | LOD[-Log(-value)] in Tassel 5 | %R-square in Tassel 5 | |||||||
|---|---|---|---|---|---|---|---|---|---|---|---|---|---|
| MLM | MLMM | FarmCPU | BLINK | SMR | GLM | MLM | SMR | GLM | MLM | ||||
| SL4.0ch11_46825788 | 11 | 46,825,788 | 14.8 | 7.37 | 1.14 | 9.19 | 13.03 | 16.20 | 12.30 | 7.56 | 24.54 | 15.80 | 13.93 |
| SL4.0ch11_46847421 | 11 | 46,847,421 | 15.0 | 8.17 | 12.65 | 0.55 | 2.03 | 16.36 | 12.99 | 8.48 | 24.75 | 16.49 | 15.85 |
| SL4.0ch11_46850215 | 11 | 46,850,215 | 15.3 | 6.81 | 0.59 | 0.26 | 0.75 | 13.32 | 10.03 | 6.19 | 20.87 | 13.23 | 11.32 |
| SL4.0ch11_46850230 | 11 | 46,850,230 | 15.1 | 6.61 | 0.33 | 0.08 | 0.33 | 12.46 | 9.32 | 5.84 | 19.94 | 12.53 | 10.89 |
| SL4.0ch11_47003077 | 11 | 47,003,077 | 13.5 | 6.50 | 0.32 | 0.34 | 0.93 | 15.25 | 11.12 | 6.78 | 23.21 | 14.25 | 12.42 |
Genetic mapping and QTL analysis
We attempted to create SNP genetic maps using JoinMap 3 and MSTMap from the individual UU, MU, and combined F2 populations. However, the genetic maps generated for each chromosome did not align with the physical maps, as over 90% of the SNPs did not exhibit a 1:2:1 segregation pattern. From the GWAS analysis, only chromosome 11 showed a significant QTL region associated with ToBRFV resistance. The 26,357 SNPs on chromosome 11 were too dense to perform effective QTL mapping with the small sample sizes of the individual F2 populations (UU, MU, or combined, consisting of 195, 79, or 274 individuals, respectively). Therefore, we selected 51 SNPs within the QTL region identified by GWAS to create a linkage map for further QTL analysis of ToBRFV resistance.
QTL mapping using SMR, SMIM (Fig. 5), and BIM (Supplementary Fig. S3) in Qgene revealed a peak on chromosome 11 for ToBRFV resistance. Three SNPs, SL4.0ch11_46825788, SL4.0ch11_46850270, and SL4.0ch11_46847421, were tightly linked to ToBRFV resistance, with high LOD values of 14.25 in SMR, 7.01 in SMIM, and a posterior value of 0.88 in BIM (Table 3). These results indicate that a QTL for ToBRFV resistance exists in the SL4.0ch11_46825788—SL4.0ch11_46850270—SL4.0ch11_46847421 region of chromosome 11. The R2 values ranged from 5.5% to 35.5% using the single-trait multiple interval mapping (SMIM) model and from 38.2% to 56.4% for key SNPs (Table 3). These findings support the presence of a major-effect QTL in this region.
Fig. 5.

The genetic map at the QTL region with the viewable SNPs on chromosome 11 created by single-trait multiple interval mapping (SMIM) for ToBRFV resistance, where x-axis presents genetic map with SNP markers, and y-axis presents LOD value
Table 3.
QTL and linked SNP markers for ToBRFV resistance based on three models in Qgene
| Mapping Model | SNP | Pos (cM) | Additive effect | LOD | %R2 |
|---|---|---|---|---|---|
| Singe marker regression (SMR) | SL4.0ch11_46825788 | 214.9 | 2.82 | 13.95 | 55.7 |
| SL4.0ch11_46850270 | 217 | 2.78 | 13.33 | 54 | |
| SL4.0ch11_46847421 | 221.6 | 2.81 | 14.25 | 56.4 | |
| SL4.0ch11_47006543 | 229.3 | 2.33 | 8.26 | 38.2 | |
| Single-trait multiple interval mapping (SMIM) | SL4.0ch11_46825788 | 216–220 | 0.42–3.16 | 3.93–7.01 | 5.5–33.5 |
| SL4.0ch11_46850270 | |||||
| SL4.0ch11_46847421 |
| Mapping Model | SNP | Pos (cM) | Additive effect | Posterior |
|---|---|---|---|---|
| Single-trait Bayesian interval mapping (BIM) | SL4.0ch11_46825788 | 216–218 | 2.13–2.53 | 0.27–0.88 |
| SL4.0ch11_46850270 | ||||
| SL4.0ch11_46847421 |
Candidate gene identification/detection
A total of 17 genes were identified within the QTL region between 46.7 Mbp and 47.1 Mbp on chromosome 11 (Supplementary Table S2). Among these 17 genes, two disease resistance gene analogs were identified as potential candidates for ToBRFV resistance in ‘USVL332.’ These include Solyc11g062150, a TIR-NBS-LRR resistance protein (Toll-Interleukin receptor), located at 46,961,662 bp–46,964,437 bp, and Solyc11g062180, a disease resistance protein with leucine-rich repeat (LRR) domains, located at 46,983,996 bp–46,984,571 bp on chromosome 11 (SL4.0ch11). In addition, Solyc11g062160 (46,979,044–46,979,646 bp), encoding an endonuclease/exonuclease/phosphatase, was located within this region. These enzyme families are known to contribute to plant immune responses by participating in DNA replication and repair, while phosphatases modulate intracellular signaling pathways during stress (Schweighofer et al. 2004). Furthermore, Solyc11g062060 (46,837,096–46,839,707 bp), encoding a C2H2-type zinc finger protein, belongs to a gene family implicated in the transcriptional regulation of defense-related genes (Huang et al. 2024). These observations suggest that allelic variation in these candidate genes may underlie the resistance phenotype observed in ‘USVL332.’ Resequencing-based SNP and InDel analyses are underway, and functional validation is in progress to confirm their roles in ToBRFV resistance.
Discussion
ToBRFV resistance in S. pimpinellifolium
A diverse range of Solanum species, including tomato breeding lines and wild relatives, have been identified as resistance or tolerance to ToBRFV (Salem et al. 2023). Apart from one resistance source in S. lycopersicum and another tolerant S. pimpinellifolium (Zinger et al. 2021), most other resistant or tolerant materials have not been genetically characterized or made publicly available (Salem et al. 2023). A recent study demonstrated that the resistance to ToBRFV in S. lycopersicum involves an interaction of the Tm-1 gene and an unknown locus on chromosome 11 (Zinger et al. 2025). In this study, we used the resistant S. pimpinellifolium ‘USVL332,’ which was previously identified in our earlier work (Jaiswal et al. 2024). We developed two F2 populations (a total of 274 individuals) from two crosses: one an intraspecific cross between S. pimpinellifolium ‘USVL332’ and ‘USVL333’ (195 F2 plants), and another an interspecific cross between S. pimpinellifolium ‘USVL332’ and S. lycopersicum ‘Moneymaker’ (79 F2 plants). Both ‘USVL332’ and ‘USVL333’ were derived through a single-seed descent for three generations (S3) from PI 390717 and PI 390718, respectively. These two S. pimpinellifolium accessions were originally collected from Peru but exhibited distinct responses to ToBRFV infection. While PI 390717 was resistant, PI 390718 was susceptible to ToBRFV infection in our germplasm screening (Jaiswal et al. 2024).
Upon confirming their respective resistance or susceptibility to ToBRFV, two parental lines, ‘USVL332’ and ‘USVL333,’ were crossed. The F2 populations generated from this intraspecific cross between the two S. pimpinellifolium lines were selected for QTL analysis due to their similar genetic background, with a major difference in phenotype regarding their resistance or susceptibility to ToBRFV infection. Resistance in ‘USVL332’ was characterized by low to non-detectable levels of virus titer in infected plants, determined by ELISA and qRT-PCR testing (Jaiswal et al. 2024). In contrast, ‘USVL333’ exhibited mosaic and mottling symptoms on infected plants, with a high virus titer, similar to that of the susceptible tomato control ‘Moneymaker’ (Jaiswal et al. 2024). However, the resistance to ToBRFV in ‘USVL332’ is not complete immunity. Nevertheless, its high resistance to ToBRFV and the ease of cross-pollination with S. lycopersicum make this line an attractive source of genetic resistance for incorporation into common tomato cultivars and breeding lines aimed at improving ToBRFV resistance.
QTL and association mapping of ToBRFV resistance
QTL mapping is based on the association of phenotypic and genotypic data to map QTLs to chromosomes in segregating genetic populations (F2, F2:3, RIL) using statistical models to tag major or minor genes/alleles in crops. In the present study, JoinMap 4 (Van Ooijen 2006) and MSTmap (Wu et al. 2008) were used to create genetic linkage maps in two F2 populations of 274 individuals: One derived from an intraspecific cross between S. pimpinellifolium ‘USVL332’ and ‘USVL333,’ and the other from an interspecific cross between S. pimpinellifolium ‘USVL332’ and S. lycopersicum ‘Moneymaker.’ A total of 136,357 SNPs were used to construct the genetic maps, incorporating both genetic and physical distances. However, the SNP orders did not align well between the genetic and physical locations in each chromosome. This discrepancy may have been due to the small sizes of the mapping populations, with 195 F2 individuals from UU and 79 F2 from MU.
To overcome the genetic order errors in QTL mapping, we performed a GWAS for ToBRFV resistance in the two F2 populations. Using four models in GAPIT 3 and three models in TASSEL 5, we generated QQ-plots and Manhattan plots, which identified a peak on chromosome 11 for ToBRFV resistance (Fig. 5). Three SNPs, SL4.0ch11_46825788, SL4.0ch11_46850270, and SL4.0ch11_46847421, showed significant associations with ToBRFV resistance, with high LOD values (Table 3), indicating the presence of a QTL in this region of chromosome 11. The identification of a major QTL on chromosome 11 for ToBRFV resistance is consistent with the findings of a previous study on S. lycopersicum (Zinger et al. 2021).
Candidate gene for ToBRFV resistance
In the QTL region between 46.7 Mbp and 47.1 Mbp on chromosome 11, a total of 17 genes were identified (Table S2). Among them, two disease resistance gene analogs were of particular interest: Solyc11g062150, a TIR-NBS-LRR resistance protein (Toll-Interleukin receptor), and Solyc11g062180, a disease resistance protein with a leucine-rich repeat (LRR). Further characterization of these genes is necessary to determine if they are candidate genes for ToBRFV resistance in S. pimpinellifolium ‘USVL332.’
Conclusion
In this study, a QTL region for ToBRFV resistance was identified in two F2 populations derived from S. pimpinellifolium ‘USVL333’ × ‘USVL332’ and ‘Moneymaker’ × ‘USVL332.’ The QTL was located in the approximately 46.84 Mbp region on chromosome 11, with three SNP markers showing the highest LOD values (> 15) in association with the ToBRFV resistance locus. The disease gene analogs Solyc11g062150 (TIR-NBS-LRR resistance protein, Toll-Interleukin receptor) and Solyc11g062180 (disease resistance protein, leucine-rich repeat) on chromosome 11 (SL4.0ch11) were recognized as potential candidates for ToBRFV resistance in S. pimpinellifolium. The three identified SNPs could be further explored for the development of ToBRFV-resistant cultivars through marker-assisted selection, while the candidate disease resistance genes could serve as targets for functional analysis.
Supplementary Information
Below is the link to the electronic supplementary material.
Acknowledgements
We thank the USDA-ARS National Plant Disease Recovery System (NPDRS) and Crop Germplasm Committee for tomato for supporting funds to this research (6080-22000-032-000D). The authors also thank the Texas A&M AgriLife Genomics and Bioinformatics Service Center for the sequencing and basic bioinformatics analysis to provide raw DNA sequencing and SNP data. Tomato germplasm was provided by the Tomato Genetics Resource Center at the University of California, Davis, or from the USDA-ARS Plant Genetic Resources Unit at Geneva, NY. This research was supported in part by appointments (NJ, BZ) to the Agricultural Research Service (ARS) Research Participation Program administered by the Oak Ridge Institute for Science and Education (ORISE) through an interagency agreement between the U.S. Department of Energy (DOE) and the U.S. Department of Agriculture (USDA). ORISE is managed by ORAU under DOE contract number DE-SC0014664. All opinions expressed in this paper are the author's and do not necessarily reflect the policies and views of USDA, DOE, or ORAU/ORISE. Mention of trade names or commercial products in this article is solely for the purpose of providing specific information and does not imply recommendation or endorsement by the USDA. The USDA is an equal opportunity provider and employer.
Author contributions
KSL was the principal investigator (PI) for the project. NJ, BC, AG, and KSL were involved in the phenotyping and performed ToBRFV-resistant evaluation. NJ and BZ performed DNA isolation and quantification for high-throughput sequencing. AS performed genomic and statistical analysis. AS, NJ, and KSL wrote the draft of the manuscript. All authors have edited, reviewed, and approved the manuscript.
Funding
The USDA-ARS base project: 6080-22000-032-000D to KSL and USDA-NIFA Crop Production and Pest Management program: 2023-70006-40603 to AS and KSL.
Data availability
The datasets presented in this study are available in Tables, Figures, Supplementary Tables, and Supplementary Figures. The SNP data are available in FigShare https://doi.org/10.6084/m9.figshare.25345042.v1. The accession number(s) used in this study can be found in the article/Supplementary Material.
Declarations
Conflict of interest
There is no conflict of interest in this research.
Footnotes
Publisher's Note
Springer Nature remains neutral with regard to jurisdictional claims in published maps and institutional affiliations.
Contributor Information
Ainong Shi, Email: ashi@uark.edu.
Kai-Shu Ling, Email: kai.ling@usda.gov.
References
- Alexander LJ (1963) Transfer of a dominant type of resistance to the four known Ohio pathogenic strains of tobacco mosaic virus (TMV) from Lycopersiconperuvianum to L. esculentum. Phytopathology 53:869 [Google Scholar]
- Ashkenazi V, Rotem Y, Ecker R, Nashilevitz S, Barom N (2018) Tolerance in plants of Solanum lycopersicum to the tobamovirus tomato brown rugose fruit virus (TBRFV). WO Patent 2018/219941. https://patentscope.wipo.int/search/es/detail.jsf?docId=WO2018219941
- Bradbury PJ, Zhang Z, Kroon DE, Casstevens TM, Ramdoss Y, Buckler ES (2007) TASSEL: Software for association mapping of complex traits in diverse samples. Bioinformatics 23:2633–2635. 10.1093/bioinformatics/btm308 [DOI] [PubMed] [Google Scholar]
- Carr JP (2024) Engineered resistance to Tobamoviruses. Viruses 16(7):1007. 10.3390/v16071007 [DOI] [PMC free article] [PubMed] [Google Scholar]
- Chanda B, Rivera Y, Nunziata SO, Galvez ME, Gilliard A, and Ling KS (2020) Complete genome sequence of a tomato brown rugose fruit virus isolated in the United States. Microbiol Resour Announc 9:e00630–20. 10.1128/MRA.00630-20 [DOI] [PMC free article] [PubMed] [Google Scholar]
- Chanda B, Shamimuzzaman M, Gilliard A, Ling K-S (2021a) Effectiveness of disinfectants against the spread of tobamoviruses: tomato brown rugose fruit virus and Cucumber green mottle mosaic virus. Virol J 18:7. 10.1186/s12985-020-01479-8 [DOI] [PMC free article] [PubMed] [Google Scholar]
- Chanda B, Gilliard A, Jaiswal N, Ling K-S (2021b) Comparative analysis of host range, ability to infect tomato cultivars with Tm-22 gene, and real-time reverse transcription PCR detection of tomato brown rugose fruit virus. Plant Dis 105:3643–3652. 10.1094/PDIS-05-20-1070-RE [DOI] [PubMed] [Google Scholar]
- EPPO (2025) Tomato brown rugose fruit virus (ToBRFV) datasheet. EPPO Global Database. https://gd.eppo.int/taxon/TOBRFV/datasheet (accessed 1/19/2025)
- Guan Z, Biswas T Wu F (2018) The US tomato industry: an overview of production and trade. UF IFAS Extension. https://www.researchgate.net/publication/345847964_The_US_Tomato_Industry_An_Overview_of_Production_and_Trade (Accessed 1/19/2025)
- Hamelink R, Kalisvaart J, Rashidi H (2019) TBRFV resistant tomato plant. WO Patent 2019/110130. https://patentscope.wipo.int/search/en/detail.jsf?docId=WO2019110130
- Hosmani PS, Flores-Gonzalez M, van de Geest H, Maumus F, Bakker LV, Schijlen E, Saha S (2019) An improved de novo assembly and annotation of the tomato reference genome using single-molecule sequencing. Cold Spring Harbor Laboratory, Hi-C proximity ligation and optical maps. 10.1101/767764 [Google Scholar]
- Huang L, Xie R, Hu Y, Du L, Wang F, Zhao X et al (2024) A C2H2-type zinc finger protein TaZFP8-5B negatively regulates disease resistance. BMC Plant Biol 24(1):1116. 10.1186/s12870-024-05843-6 [DOI] [PMC free article] [PubMed] [Google Scholar]
- Jaiswal N, Chanda B, Gilliard A, Shi A, Ling K-S (2024) Evaluation of tomato germplasm against tomato brown rugose fruit virus and identification of resistance in Solanum pimpinellifolium. Plants 13:581. 10.3390/plants13050581 [DOI] [PMC free article] [PubMed] [Google Scholar]
- Jewehan A, Salem N, Tóth Z, Salamon P, Szabó Z (2022a) Screening of Solanum (sections Lycopersicon and Juglandifolia) germplasm for reactions to the tomato brown rugose fruit virus (ToBRFV). J Plant Dis Prot 129:117–123. 10.1007/s41348-021-00535-x [DOI] [PMC free article] [PubMed] [Google Scholar]
- Jewehan A, Salem N, Tóth Z et al (2022b) Evaluation of responses to tomato brown rugose fruit virus (ToBRFV) and selection of resistant lines in Solanum habrochaites and Solanum peruvianum germplasm. J Gen Plant Pathol 88:187–196. 10.1007/s10327-022-01055-8 [Google Scholar]
- Joehanes R, Nelson JC (2008) QGene 4.0, an extensible Java QTL-analysis platform. Bioinformatics 24:2788–2789. 10.1093/bioinformatics/btn523 [DOI] [PubMed] [Google Scholar]
- Kabas A, Fidan H, Kucukaydin H, Atan HN, Kabas A, Fidan H, Kucukaydin H, Atan HN (2022) Screening of wild tomato species and interspecific hybrids for resistance/tolerance to Tomato brown rugose fruit virus (ToBRFV). Chil J Agric Res 82:189–196. 10.4067/S0718-58392022000100189 [Google Scholar]
- Ling KS, Tian T, Gurung S, Salati R, Gilliard A (2019) First report of tomato brown rugose fruit virus infecting greenhouse tomato in the United States. Plant Dis 103:1439. 10.1094/PDIS-11-18-1959-PDN [Google Scholar]
- López-Hernández F, Cortés AJ (2019) Last-generation genome–environment associations reveal the genetic basis of heat tolerance in common bean (Phaseolus vulgaris L.). Front. Genet. 10:954. 10.3389/fgene.2019.00954 [DOI] [PMC free article] [PubMed] [Google Scholar]
- Luria N, Smith E, Reingold V, Bekelman I, Lapidot M, Levin I, Elad N, Tam Y, Sela N, Abu-Ras A, Ezra N, Haberman A, Yitzhak L, Lachman O, Dombrovsky A (2017) A new Israeli tobamovirus isolate infects tomato plants harboring Tm-22 resistance genes. PLoS ONE 12:e0170429. 10.1371/journal.pone.0170429 [DOI] [PMC free article] [PubMed] [Google Scholar]
- Maayan Y, Pandaranayaka EPJ, Srivastava DA, Lapidot M, Levin I, Dombrovsky A, Harel A (2018) Using genomic analysis to identify tomato Tm-2 resistance-breaking mutations and their underlying evolutionary path in a new and emerging tobamovirus. Adv Virol 163:1863–1875. 10.1007/s00705-018-3819-5 [DOI] [PubMed] [Google Scholar]
- Millenaar F, Vredenbregt-Pillon P, Altena J, Mammella MA, Verbakel H (2021) Solanum lycopersicum plants having improved Tobamovirus resistance. WO Patent 2021/213892. https://patentscope.wipo.int/search/es/detail.jsf;jsessionid=9B86BE3006E08CC4CCB6FA0D1D0E3F81.wapp1nA?docId=WO2021213892&_gid=202143
- Van Ooijen JW, van Ooijen J, van’t Verlaat J, Tol J, et al (2006) JoinMap® 4, Software for the calculation of genetic linkage maps in experimental populations. Kyazma B.V., Wageningen. https://www.scienceopen.com/book?vid=baa76c8c-fb55-4c13-a6ca-24c71002ab5a
- Rivarez MPS, Vucurovic A, Mehle N, Ravnikar M, Kutnjak D (2021) Global advances in tomato virome research: current status and the impact of high-throughput sequencing. Front Microbiol 12:671925. 10.3389/fmicb.2021.671925 [DOI] [PMC free article] [PubMed] [Google Scholar]
- Schweighofer A, Hirt H, Meskiene I (2004) Plant PP2C phosphatases: emerging functions in stress signaling. Trends Plant Sci 9(5):236–243. 10.1016/j.tplants.2004.03.007 [DOI] [PubMed] [Google Scholar]
- Spiegelman Z, Dinesh-Kumar SP (2023) Breaking boundaries: the perpetual interplay between tobamoviruses and plant immunity. Ann Rev Virol 10:455–476. 10.1146/annurev-virology-111821-122847 [DOI] [PubMed] [Google Scholar]
- USDA-APHIS (2024) APHIS amends Federal Order for U.S. Imports of tomato (Solanum lycopersicum) and pepper (Capsicum spp.) hosts of Tomato brown rugose fruit virus (ToBRFV). https://www.aphis.usda.gov/news/program-update/amend-us-imports-tomato-pepper-federal-order-tomato-brown-rugose-fruit-virus (Accessed 11/12/2024)
- Ykema M, Verweij CW, De La Fuente van Bentem S (2020) Tomato plant resistant to tomato brown rugose fruit virus. WO Patent 2020/147921. https://patentscope.wipo.int/search/en/detail.jsf?docId=WO2020147921
- Zhang S, Griffiths JS, Marchand G, Bernards MA, Wang A (2022) Tomato brown rugose fruit virus: an emerging and rapidly spreading plant RNA virus that threatens tomato production worldwide. Mol Plant Pathol 23:1262–1277. 10.1111/mpp.13229 [DOI] [PMC free article] [PubMed] [Google Scholar]
- Zinger A, Lapidot M, Harel A, Doron-Faigenboim A, Gelbart D, Levin I (2021) Identification and mapping of tomato genome loci controlling tolerance and resistance to tomato brown rugose fruit virus. Plants 10:1–16. 10.3390/plants10010179 [DOI] [PMC free article] [PubMed] [Google Scholar]
- Zinger A, Doron-Faigenboim A, Gelbart D, Levin I, Lapidot M (2025) Contribution of the tobamovirus resistance gene Tm-1 to control of tomato brown rugose fruit virus (ToBRFV) resistance in tomato. PLoS Genet 21(5):e1011725. 10.1371/journal.pgen.1011725 [DOI] [PMC free article] [PubMed] [Google Scholar]
- Salem N, Mansour A, Ciuffo M, Falk BW, Turina MA (2016) New tobamovirus infecting tomato crops in Jordan. Arch Virol 161:503–506. 10.1007/s00705-015-2677-7 [DOI] [PubMed] [Google Scholar]
- Salem NM, Jewehan A, Aranda MA, Fox A (2023) Tomato brown rugose fruit virus pandemic. Annu Rev Phytopathol 61:137–164. 10.1146/annurev-phyto-021622-120703 [DOI] [PubMed] [Google Scholar]
- Wang J, Zhang Z (2021) GAPIT version 3: boosting power and accuracy for genomic association and prediction. Genomics, Proteomics & Bioinformatics. doi:10.1016/j.gpb.2021.08.005 [DOI] [PMC free article] [PubMed] [Google Scholar]
- Wu Y, Bhat PR, Close TJ, Lonardi S (2008) Efficient and accurate construction of genetic linkage maps from the minimum spanning tree of a graph. PLoS Genet 4(10): e1000212. 10.1371/journal.pgen.1000212 [DOI] [PMC free article] [PubMed] [Google Scholar]
Associated Data
This section collects any data citations, data availability statements, or supplementary materials included in this article.
Supplementary Materials
Data Availability Statement
The datasets presented in this study are available in Tables, Figures, Supplementary Tables, and Supplementary Figures. The SNP data are available in FigShare https://doi.org/10.6084/m9.figshare.25345042.v1. The accession number(s) used in this study can be found in the article/Supplementary Material.