

ABSTRACT
Speech‐motor and cognitive impairments are commonly observed in age‐related neurodegenerative diseases, including mild cognitive impairment (MCI) and Alzheimer's Disease (AD). Although there is a strong interaction between motor and cognitive functions, intact speech motor control is a crucial yet often‐overlooked component of cognitive functioning. Additionally, motor decline can occur independently and may precede the onset of cognitive impairment in neurodegenerative conditions. These impairments can confound measures of higher‐order cognition, typically assessed through behavioral performance. Notably, the associations between cognitive performance and biological indices of speech motor production have been largely unexplored. This study is the first to examine cognitive associations of cortical thickness in brain regions implicated in speech motor performance across the adult lifespan, and to investigate whether age‐related structural changes in speech motor regions precede those seen in the hippocampus. Our sample included 699 cognitively healthy adults (56% female) spanning 35–90 years from the Human Connectome Project (HCP)‐Aging dataset. Cognition was estimated using standard neuropsychological assessments including: the Trail Making Task A/B (TMT), the Rey Auditory Verbal Learning Test (RAVLT), and a cognitive composite score (summating cognitive performance across multiple tasks). Whole‐brain T1‐ and T2‐weighted MRI images were acquired using 3‐Tesla scanners across multiple study sites. Structural images were preprocessed using the HCP minimal preprocessed pipelines to reconstruct cortical surfaces. Volume‐based estimates including hippocampal volume and total gray matter volume were adjusted for head size using an adjusted measure of estimated Total Intracranial Volume (eTIV). Speech motor regions were investigated relative to well‐characterized relationships with hippocampal volume (a hallmark region for memory and cognition and AD‐related atrophy). Estimates of cortical thickness were extracted from 14 bilateral speech motor control regions spanning premotor, motor, somatosensory, insular, and prefrontal cortices. Performance across all cognitive tasks and estimates of brain structure were all highly correlated with age. After controlling for the effects of age, greater hippocampal volume remained correlated with better cognitive performance across all cognitive tasks. However, only cognitive associations with greater total gray matter volume survived correction for multiple comparisons. As expected, age associations with hippocampal volume differed between early (−0.191%/year) and late adulthood (−0.714%/year) (T = 6.179, p = 0.0002). Age associations with speech motor control regions significantly differed from the associations seen in GMV, mCT, and/or hippocampal volume across the lifespan (Pcor < 0.0001) and during late adulthood when compared separately. Half the speech motor control regions explored showed decelerated estimated percent difference per year from early and late adulthood. Our results suggest that neurocognitive relationships are highly impacted and often confounded by age. The thickness of several speech motor regions was not associated with cognitive performance and can therefore provide a more intrinsic measure of aging. Additionally, speech motor control regions decline earlier in adulthood than hippocampal volume and may therefore serve as a target and early indicator of AD‐related neurodegeneration. This nuanced understanding is critical for refining early diagnostic criteria for neurodegenerative diseases, including AD, and sheds light on the complex interplay between age‐related changes, disease pathology, and cognitive decline.
Speech motor control thickness measures were generally not correlated with cognitive performance and showed stronger age associations than hippocampal volume during early adulthood. Thinning of specific speech motor regions precedes reduction in hippocampal volume during early adulthood, and may serve as a target and early indicator of AD‐related neurodegeneration.

1. Introduction
Although motor and cognitive functions are closely linked, speech motor control remains a crucial, yet often overlooked aspect of cognitive functioning. Importantly, motor decline can occur independently and may even precede the onset of cognitive impairment in neurodegenerative diseases (Buchman and Bennett 2011; Eshghi et al. 2025; Montero‐Odasso et al. 2017). Such motor impairments can confound assessments of higher‐order cognition, which are typically based on behavioral performance. Despite this, the relationship between cognitive performance and biological markers of speech motor function remains surprisingly underexplored. Speech is a complex human behavior that relies heavily on structurally and functionally intact neural and mechanical subsystems (i.e., respiratory, phonatory, resonatory, sensory, and articulatory). Although speech intelligibility is typically maintained in healthy older adults, research has documented several age‐related changes in speech production and the motoric output of speech. In general, compared to younger adults, older adults have demonstrated slower speaking and articulation rates (Amerman and Parnell 1992; Bailey and Dromey 2015; Dromey et al. 2014; Duchin and Mysak 1987; GoozÉe et al. 2005; Jacewicz et al. 2009; Ramig 1983; Ryan and Burk 1974; Smith et al. 1987; Wohlert and Smith 1998). The duration of segments, syllables, and sentences has been reported to increase by 20%–25% in older adults compared to younger adults at both habitual and fast speaking rate conditions (Smith et al. 1987). Similarly, the rate and speed of syllable production in oral diadochokinetic tasks (i.e., the fast repetition of a syllable on a single breath) are lower in older adults than in young adults (Ben‐David and Icht 2017; Bilodeau‐Mercure, Kirouac, et al. 2015; Bilodeau‐Mercure, Lortie, et al. 2015; Flanagan and Dembowski 2002; Watanabe et al. 2017). Older adults have also been observed to show increased articulatory coordination variability and movement duration in speech tasks with increased cognitive load involving response inhibition, selective attention, and working memory processes (MacPherson 2019).
Behavioral assessments and cognitive testing batteries are the current clinical protocol for evaluating individual cognitive abilities, for monitoring normal cognitive aging, as well as for the clinical diagnostics of neurological and neurodegenerative outcomes. These cognitive assessments range in their association to speech motor performance and to higher‐order domain‐specific intellect. Both the Trail Making Test (TMT) and the Rey Auditory Verbal Learning Test (RAVLT) are widely used in clinical settings to evaluate cognitive impairments associated with various neurological conditions, such as traumatic brain injury, stroke, AD, and other dementias (Baudic et al. 2006; Estévez‐González et al. 2003; Kopp et al. 2015; Lafleche and Albert 1995; Moradi et al. 2017; Periáñez et al. 2007; Ricci et al. 2012; Tamez et al. 2011; Terada et al. 2013; Tierney et al. 1994; Tsiakiri et al. 2024). The TMT consists of two distinct parts (Bowie and Harvey 2006; Corrigan and Hinkeldey 1987; Giovagnoli et al. 1996; Linari et al. 2022; Misdraji and Gass 2010; Muir et al. 2015; Sánchez‐Cubillo et al. 2009). Part A is primarily used to evaluate visual attention and psychomotor speed, while Part B is more complex and is used to assess cognitive flexibility (i.e., the ability to switch between different tasks or mental sets), divided attention, response inhibition, in addition to the skills evaluated in Part A (Allen et al. 2011; Arbuthnott and Frank 2000; Gaudino et al. 1995; Kortte et al. 2002; MacPherson et al. 2017). The RAVLT is another essential neuropsychological assessment that evaluates verbal learning and memory through delayed recall: the ability to remember information after a time delay (Dias et al. 2021; Fard et al. 2016; Fernaeus et al. 2014; Ranjith et al. 2010; Schoenberg et al. 2006).
While biological indices of speech motor production have been largely unexplored—the hippocampus—known for its role in memory, cognitive flexibility, and social behavior—has been the obvious target for studying healthy brain aging and cognition for decades (Gorbach et al. 2017; Hardcastle et al. 2020; Jack et al. 1999; O'Shea et al. 2016; Papp et al. 2014). MRI‐based estimates of hippocampal volume have linked increased volume to greater behavioral performance on cognitive tests (Gorbach et al. 2017; Hardcastle et al. 2020; Hu and Li 2020; O'Shea et al. 2016; Papp et al. 2014; Uribe et al. 2018). Previous cross‐sectional cohorts have demonstrated a nonlinear decline of hippocampal volume across the lifespan; where volume is maintained during early adulthood and shows a steeper decline later in adulthood (Narvacan et al. 2017; Nobis et al. 2019). Moreover, accelerated hippocampal atrophy has been found in patients with amnestic MCI and AD (Aschenbrenner et al. 2018; Nagata et al. 2011; Peng et al. 2015), is a well‐established marker of future conversion to AD, and is strongly associated with AD progression (Chincarini et al. 2016; Jack et al. 1999; McRae‐McKee et al. 2019; Van Der Flier and Scheltens 2009).
This study maps cognitive performance and age associations to biological indices of speech motor control in relation to hippocampal volume by investigating the cortical structure of speech regions in a large cohort of well‐screened healthy adults across the adult lifespan. Speech regions‐of‐interest (ROIs) were selected for their neural representation of speech motor control, including planning, sequencing, and execution of speech behaviors (Tourville and Guenther 2011).
First, associations of structural measures in speech motor regions were compared to those of known associations between hippocampal volume and cognitive performance. We hypothesized that both hippocampal volume and speech motor regional thickness would be correlated with cognitive performance. More specifically, we posited that hippocampal volume may show stronger correlations with cognitive performance measures associated with more general or higher‐order aspects of cognition, while speech motor regions would show the strongest correlations with speech and response performance measures of cognition.
Second, age associations with cortical thickness of brain regions known to play a role in speech motor control and planning were compared to hippocampal volume in cognitively normal adults across a wide age span. As this theoretical figure shows, comparing the strength of age associations at various points across the lifespan may provide insight into which regions age first (see Figure 1). In this model, we propose regions most vulnerable to the effects of aging would show an accelerated rate of change early on in adulthood, while regions that are more resilient to aging would show a slower rate of change early in adulthood and a more accelerated rate of change during late adulthood.
FIGURE 1.
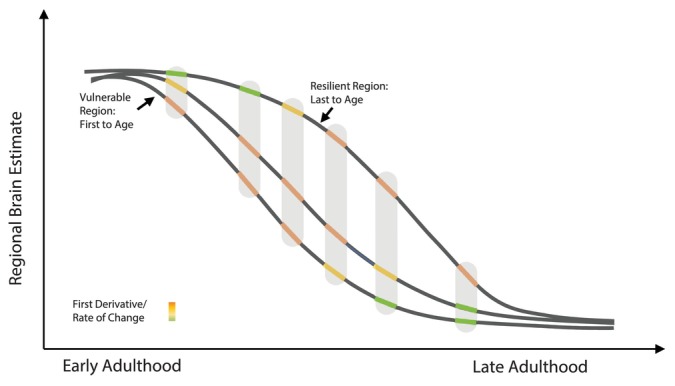
This theoretical model depicts how normative age curves may provide insight into which regions age first. Using this method, a region that ages earlier should show an accelerated decline earlier and show a slower decline later in adulthood. Whereas a region that is more resilient to age would show a reduced rate of decline earlier and a more accelerated decline later in adulthood. Color depicts the strength of the age‐association or rate of change. Maximal rate of change (or rate of decline) may be a different age for different regions of the brain.
Moreover, recent work has demonstrated that the chronological age of 60 years may represent a period of maximal biological and physiological change leading to altered age‐related trajectories (Mahlknecht and Kaiser 2010; Shen et al. 2024). Changes that occur at ~60 years of age may alter the pace of subsequent aging, and for this reason, it was chosen as the pivotal point for early and late age split analyses. We aim to replicate previous findings that hippocampal volume may be preserved early on, and show greater decline later in adulthood. Secondly, we hypothesized that speech motor regions, unlike hippocampal volume, would show greater decline early on, and slower decline later in adulthood. Findings of this study will improve our understanding of the underlying neuroanatomical substrates of age‐related changes in speech production and provide normative information to better differentiate age‐from disorder‐related changes in structural measures of speech motor regions.
2. Materials and Methods
2.1. Participants
Participants were 699 cognitively healthy adults between 36 and 90 years of age from the larger Human Connectome Project (HCP) Aging sample (Bookheimer et al. 2019). Demographics for the sample, including sex and handedness, are provided by age (in 5‐year age groups) in Table 1. All study procedures were approved by institutional review boards of all HCP‐Aging participating institutions. Participants provided written informed consent. Of the full HCP Aging sample (n = 1176), data were excluded if the participant was above 90 years of age (n = 23), if neuroimaging data was of poor/low quality or not yet processed through HCP's structural processing pipeline (n = 320), or due to data missingness (n = 134).
TABLE 1.
HCP aging sample demographics, performance scores of cognitive tasks, and structural (T1w/T2w) image quality measures.
| Age (in years) | 36–39 | 40–44 | 45–49 | 50–54 | 55–59 | 60–64 | 65–69 | 70–74 | 75–79 | 80–84 | 85–90 |
|---|---|---|---|---|---|---|---|---|---|---|---|
| Size (n) | 66 | 81 | 80 | 75 | 78 | 62 | 58 | 60 | 51 | 56 | 33 |
| Sex (% Female) | 50 | 63 | 56.3 | 58.7 | 57.7 | 54.8 | 56.9 | 51.7 | 53 | 51.8 | 54.5 |
| Handedness (% Right) | 95.5 | 95.1 | 95 | 90.7 | 93.6 | 85.5 | 86.2 | 85 | 94.1 | 90.9 | 81.8 |
| Trail making task A/B time (seconds) | |||||||||||
| Size (n) | 66 | 81 | 80 | 75/74 | 77/78 | 62 | 57/58 | 60 | 51 | 55/54 | 32/33 |
| A: Median (SE) | 23.8 (1.5) | 24.0 (1.2) | 24.2 (0.95) | 23.3 (1.1) | 26.8 (1.1) | 26.1 (1.5) | 31.1 (1.5) | 29.6 (1.3) | 38.7 (1.6) | 37.9 (1.7) | 38.9 (2.3) |
| B: Median (SE) | 58.6 (3.2) | 54.2 (4.4) | 51.9 (3.9) | 57.4 (4.1) | 58.2 (4.0) | 55.7 (4.5) | 74.0 (5.9) | 64.5 (4.1) | 84.7 (5.6) | 93.7 (8.5) | 88.8 (11.3) |
| RAVLT short delay total correct score | |||||||||||
| Size (n) | 63 | 81 | 79 | 73 | 75 | 61 | 54 | 60 | 51 | 55 | 33 |
| Median (SE) | 67 (1.4) | 65 (1.4) | 67 (1.4) | 63 (1.6) | 60 (1.5) | 59 (1.9) | 58 (2.0) | 58 (1.7) | 54 (1.7) | 47 (1.6) | 49 (1.8) |
| Total cognitive composite score | |||||||||||
| Size (n) | 59 | 75 | 66 | 68 | 66 | 59 | 57 | 52 | 45 | 32 | 19 |
| Median (SE) | 112 (1.2) | 109 (1.3) | 111 (1.5) | 106 (1.2) | 106 (1.3) | 106 (1.2) | 105 (1.2) | 106 (1.1) | 102 (1.3) | 97 (1.8) | 98 (2.0) |
| Structural image quality metrics (T1/T2) | |||||||||||
| Visual quality score | 3.0/2.5 | 3.0/3.0 | 3.0/2.5 | 3.0/2.5 | 3.0/2.5 | 3.0/3.0 | 3.0/3.0 | 2.5/2.5 | 2.5/2.5 | 2.5/2.5 | 2.5/2.5 |
| Motion score (# vNAV) | 177/101 | 181/101 | 181/101 | 182/101 | 194/104 | 185/103 | 196/107 | 190/104 | 196/111 | 196/110 | 196/108 |
| Surface recon score | 25 (1.2) | 25 (0.9) | 25 (1.1) | 23 (0.8) | 27 (2.5) | 26 (2.3) | 31 (1.5) | 36 (2.3) | 48 (3.7) | 53 (7.3) | 52 (5.3) |
| (# Holes): median (SE) | |||||||||||
2.2. Cognitive Tasks
2.2.1. Trial Making Task (TMTA/TMTB)
The Trail Making Task (TMT) consists of two distinct parts (A/B) and is classically used to capture a variety of cognitive functions, including: visual attention, task switching, processing speed, and executive functioning (Bowie and Harvey 2006; Corrigan and Hinkeldey 1987; Giovagnoli et al. 1996; Linari et al. 2022; Misdraji and Gass 2010; Muir et al. 2015; Sánchez‐Cubillo et al. 2009). In Part A, participants are required to connect a series of randomly arranged numbers in ascending order by drawing a line as quickly and accurately as possible. This part is used to assess visual scanning, numeric sequencing, and motor speed. In Part B, participants are asked to switch between different tasks and/or mental sets. This part is used to assess cognitive flexibility, divided attention, inhibition of impulsive responses in addition to the skills evaluated in Part A (Allen et al. 2011; Arbuthnott and Frank 2000; Gaudino et al. 1995; Kortte et al. 2002; MacPherson et al. 2017). Longer completion times and more errors on the TMT are indicative of cognitive deficits and can impact daily functioning and driving abilities. The TMT is often scored as a ratio B/A or B adjusted by A; however, for this analysis, subtests were evaluated separately to better explore a broader range of higher‐order and lower‐order cognitive performance demands.
2.2.2. Rey Auditory Verbal Learning Test (RAVLT)
The RAVLT is another essential neuropsychological assessment that evaluates verbal learning, memory, and recall abilities (Dias et al. 2021; Fard et al. 2016; Fernaeus et al. 2014; Ranjith et al. 2010; Schoenberg et al. 2006). In this task, participants are presented with a list of 15 unrelated words and are asked to recall after a short delay. The RAVLT is used to assess immediate and delayed recall, the learning rate (i.e., the rate at which new information is learned over repeated trials), as well as cognitive flexibility to adapt to proactive and retroactive interference (i.e., the influence of previously learned information on new learning, or the impact of new learning on the retention of previously learned information, respectively) (Dias et al. 2021; Fard et al. 2016; Fernaeus et al. 2014; Ranjith et al. 2010; Schoenberg et al. 2006). RAVLT delayed recall score was used in the current analyses.
2.2.3. Cognitive Composite Score
The NIH toolbox for the assessment of neurological and behavioral function (Hook and Gershon 2023) is commonly used to evaluate general cognition and to distinguish individuals with mild or severe traumatic brain injury (Akshoomoff et al. 2013; Tulsky et al. 2017). Previously, work has shown the composite score to have excellent test–retest reliability (Heaton et al. 2014) and is robust to developmental and aging effects. The battery consists of seven sub‐tests includingthe Picture Vocabulary Test, the Oral Reading Recognition Test, the Dimensional Change Card Sort Test, the Flanker Inhibitory Control and Attention Test, the Picture Sequence Memory Test, the List Sorting Working Memory Test, and the Pattern Comparison Processing Speed Test. These subtests were designed to evaluate executive function, language, processing speed, as well as episodic and working memory. Readers are referred to (Akshoomoff et al. 2013; Hook and Gershon 2023) for a summary of all sub‐tests. The total cognitive composite score, calculated as the average across all subtests, was used as an estimate of general cognition in our analyses.
2.3. Imaging Data
2.3.1. Data Acquisition
Whole‐brain T1‐ and T2‐weighted MRI images were acquired using a 32‐channel head coil and 3‐Tesla Siemens scanners across multiple study sites. Details on the HCP‐Aging imaging acquisition protocols have been described previously (Bookheimer et al. 2019; Glasser et al. 2016, 2013; Harms et al. 2018), and HCP‐style pulse sequences are available for distribution at http://www.cmrr.umn.edu/multiband/index.shtml. The T1w sequence was a multi‐echo MPRAGE (van der Kouwe et al. 2008) with the following sequence parameters: TR = 2500 ms, TI = 1000 ms, TE (4 echos) = 1.8/3.6/5.4/7.2 ms, flip angle = 8 deg., FOV 256 × 240 × 166 mm, voxel size = 0.8 mm isotropic, scan time = 8:22 min maximum. T2w images were acquired using a turbo‐spin‐echo (TSE) sequence (Siemens SPACE) (Mugler III et al. 2000) with parameters TR = 3200 ms, TE = 564 ms, turbo factor = 314, voxel size = 0.8 mm isotropic, scan time = 7:45 min maximum (25 TRs additional available for reacquisition). All structural images were acquired with embedded positional navigators (vNAV) (Tisdall et al. 2016), which were used to reacquire TRs if the participant moved during acquisition: up to 30 TRs could be reacquired for T1w, and up to 25 TRs for T2w images.
2.3.2. Image Quality
Structural image quality control protocols have been described previously in (Marcus et al. 2013). All T1w and T2w images were inspected manually for artifacts and assigned an overall rating (1 = poor, 2 = fair, 3 = good, 4 = excellent). T1w were required to have a rating of 2 (or higher) and T2w a score of 1.5+ to be included in these analyses. Additionally, the greater number of acquired positional navigators (vNAV) during the scan reflects the use of real‐time motion correction during image acquisition (Tisdall et al. 2016). Quality of surface reconstruction was estimated using the number of surface holes detected during Freesurfer's process of reconstructing the cortical surfaces, which reflects the quality of cortical surface reconstruction (Dale et al. 1999; Rosen et al. 2018). Visual quality scores, vNAV motion scores (total # of positional navigators acquired), and cortical reconstruction quality scores (# of surface holes) for the study sample are provided in Table 1.
2.3.3. Image Preprocessing
Structural images were preprocessed using HCP's minimal processing pipeline (Glasser et al. 2013) which has been described in detail previously (Glasser et al. 2016; Glasser et al. 2013; Glasser and Van Essen 2011; Harms et al. 2018); additionally see HCP protocols Supplementary Note 4 at http://protocols.humanconnectome.org/lifespan/. Briefly, T1w and T2w images were defaced, gradient‐field, bias‐field, and readout‐distortion corrected and aligned in T1w native volume. Next, FreeSurfer's Imaging Suite (v6.0.0; https://freesurfer.net/) was employed to construct 3D cortical surfaces and provide estimates of brain structure. FreeSurfer's standard automated pipeline was adapted to better handle high‐resolution < 1.0 mm voxel size, to make use of additional T2w images for surface construction. All images underwent intensity normalization, removal of non‐brain tissue, and volume‐based segmentation of subcortical and white matter structures (Dale et al. 1999; Fischl and Dale 2000; Fischl et al. 2002, 2004). Gray/white and pial tissue boundaries were defined, and a reconstruction of the cortical surfaces was created as a 3D triangular mesh, with each cortical surface (hemisphere) containing ~30,000 triangular vertices (Fischl and Dale 2000; Fischl et al. 2004). Cortical thickness was estimated as the shortest distance between two vertices spanning gray‐white and pial surfaces. Cortical thickness was estimated for all speech motor regions by averaging thickness estimates of all vertices within that region. In this analysis, hippocampal volume, total gray matter volume, eTIV, mean cortical thickness, and estimates of cortical thickness from speech motor control regions were used.
2.3.4. Regions of Interest (ROIs)
Speech‐related ROIs were derived from the SpeechLabel Parcellation System (Cai et al. 2014; Tourville and Guenther 2003): a neuroanatomical parcellation scheme developed based on the Directions Into Velocities of Articulators (DIVA) model of speech production (Guenther 1994a, 1994b, 1995, 2006; Guenther et al. 2006, 1998; Guenther and Vladusich 2012). The DIVA is a model for neural substrates of speech motor controls developed based on the neuroimaging findings in populations with dysarthria and apraxia of speech (Guenther 1994a, 1994b, 1995, 2006; Guenther et al. 2006, 1998; Guenther and Vladusich 2012). The full SpeechLabel parcellation scheme encompasses the entire cerebral cortex and the cerebellum and divides each cortical hemisphere into 63 ROIs designed for studying neural correlates of speech motor control and processing. Speech ROIs used in this study were 14 bilateral subregions of primary motor cortex, premotor cortex, supplementary motor area, pars opercularis, insula, and inferior frontal cortices. More specifically, these ROIs included: ventral (vPMC), middle (midPMC), middle dorsal (mdPMC), and posterior dorsal (pdPMC) regions of the primary motor cortex, ventral (vMC), middle (midMC), dorsal (dMC) regions of the motor cortex, presupplementary (preSMA) and supplementary (SMA) motor area, anterior (aINS), and posterior (pINS) insula, as well as dorsal pars opercularis (dIFo), ventral pars opercularis (vIFo), posterior inferior frontal sulcus (pIFs) of the prefrontal cortex. These regions have been identified as key cortical regions responsible for speech motor planning, motor sequencing, and execution in various studies, as well as the DIVA and Gradient Order DIVA (GODIVA) models of speech production (Ackermann and Riecker 2004, 2010; Behroozmand et al. 2020; Bohland and Guenther 2006; Bouchard et al. 2013; Golfinopoulos et al. 2010; Guenther 2006; Guenther et al. 2006; Hertrich et al. 2016; Hoshi and Tanji 2004; Janssen and Mendieta 2020; Long et al. 2016; Murphy et al. 1997; Nakamichi et al. 2018; Oh et al. 2014; Peeva et al. 2010; Riecker et al. 2005; Wildgruber et al. 2001; Woolnough et al. 2019). Readers are referred to table 1 in (Tourville and Guenther 2003) for the approximate corresponding Brodmann area for these regions.
2.4. Statistical Analyses
All statistical analyses were performed in R v4.2.2 (https://www.r‐project.org/) and libraries: reshape2, ggplot2, nlme, and lsmeans. To compare associations between cognitive performance and brain measures, linear regression models were employed. Age and image quality (i.e., number of positional navigators acquired) were included as covariates of no interest in the regression model. The cognitive correlation coefficient (b), T and p values, and model coefficient of determination (R 2 ) are provided in Table 2. Correlations with p < 0.00083 survived correction for multiple comparisons (=0.05/60), using standard Bonferroni correction for 4 cognitive measures × 15 brain estimates.
TABLE 2.
Brain estimate and cognitive performance correlations: Including the correlation coefficient (b), T and p statistical values, coefficient of determination (R 2 ).
| Trail making task A | Trail making task B | RAVLT | Composite score | |||||||||||||
|---|---|---|---|---|---|---|---|---|---|---|---|---|---|---|---|---|
| b | T | p | R 2 | b | T | p | R 2 | b | T | p | R 2 | b | T | p | R 2 | |
| Hippocampal volume | −0.00377 | −2.88 | 0.00409 | 0.165 | −0.0161 | −3.29 | 0.00105 | 0.11 | 0.00389 | 2.47 | 0.0135 | 0.176 | 0.00309 | 2.33 | 0.0202 | 0.0957 |
| eTIV | −0.00421 | −1.87 | 0.0618 | 0.159 | −0.0249 | −2.98 | 0.00302 | 0.108 | −0.00758 | −2.83 | 0.0048 | 0.179 | 0.00661 | 3.06 | 0.00229 | 0.102 |
| Total gray matter volume | −6.15E‐05 | −4.66 | 3.74E‐06 | 0.18 | −2.38E‐04 | −4.81 | 1.90E‐06 | 0.125 | 1.78E‐05 | 1.11 | 0.267 | 0.17 | 5.34E‐05 | 4.07 | 5.27E‐05 | 0.112 |
| Mean cortical thickness | −9.46 | −2.15 | 0.0321 | 0.16 | −38.7 | −2.35 | 0.019 | 0.104 | 10.4 | 1.97 | 0.0493 | 0.174 | 8.02 | 1.82 | 0.0694 | 0.0924 |
| vPMC Thickness | 0.372 | 0.107 | 0.915 | 0.155 | −15 | −1.17 | 0.244 | 0.0949 | 1.13 | 0.271 | 0.786 | 0.167 | 5.58 | 1.61 | 0.107 | 0.0893 |
| midPMC thickness | −4.48 | −1.56 | 0.119 | 0.158 | −20.1 | −1.89 | 0.0592 | 0.0978 | 6.24 | 1.82 | 0.0686 | 0.171 | 2.96 | 1.05 | 0.294 | 0.087 |
| mdPMC thickness | 0.847 | 0.287 | 0.774 | 0.155 | −4.79 | −0.436 | 0.663 | 0.0933 | 2.43 | 0.688 | 0.492 | 0.168 | −0.82 | −0.281 | 0.778 | 0.0854 |
| pdPMC thickness | 0.0555 | 0.02 | 0.984 | 0.155 | −4.22 | −0.416 | 0.678 | 0.0933 | 1.29 | 0.398 | 0.691 | 0.167 | −1.76 | −0.644 | 0.52 | 0.0859 |
| midMC thickness | −4.47 | −1.46 | 0.144 | 0.157 | −22.6 | −1.99 | 0.0467 | 0.0983 | 6.04 | 1.65 | 0.0998 | 0.17 | 3.85 | 1.28 | 0.2 | 0.0878 |
| vMC thickness | −3 | −1.11 | 0.267 | 0.156 | −15.7 | −1.56 | 0.119 | 0.0963 | 5.08 | 1.56 | 0.119 | 0.17 | 5.38 | 2.02 | 0.0439 | 0.0915 |
| dMC thickness | −5.81 | −2.05 | 0.0406 | 0.16 | −21.2 | −2.01 | 0.0451 | 0.0984 | 2.03 | 0.596 | 0.551 | 0.168 | 3.04 | 1.06 | 0.292 | 0.087 |
| preSMA thickness | −1.47 | −0.45 | 0.653 | 0.155 | −19.8 | −1.63 | 0.103 | 0.0966 | 9.31 | 2.41 | 0.0165 | 0.174 | −0.135 | −0.042 | 0.966 | 0.0853 |
| SMA thickness | 3.16 | 0.92 | 0.358 | 0.168 | 0.536 | 0.187 | 0.852 | 0.155 | −4.62 | −0.432 | 0.666 | 0.0933 | −2.76 | −0.958 | 0.339 | 0.0867 |
| aINS thickness | 0.738 | 0.216 | 0.829 | 0.155 | 1.72 | 0.135 | 0.893 | 0.0931 | 8.48 | 2.08 | 0.0382 | 0.172 | 7.29 | 2.1 | 0.0359 | 0.0921 |
| pINS thickness | 0.142 | 0.058 | 0.953 | 0.155 | −2.88 | −0.318 | 0.751 | 0.0932 | 5.14 | 1.77 | 0.0773 | 0.171 | 6.2 | 2.52 | 0.0121 | 0.095 |
| dIFo thickness | −2.41 | −0.763 | 0.445 | 0.155 | −19.8 | −1.68 | 0.0932 | 0.0968 | 10.9 | 2.89 | 0.00393 | 0.177 | 5.88 | 1.92 | 0.0551 | 0.0909 |
| vIFo thickness | −0.691 | −0.254 | 0.8 | 0.155 | 0.00704 | 0.001 | 0.999 | 0.0931 | 0.449 | 0.163 | 0.871 | 0.085 | 3.74 | 1.14 | 0.255 | 0.169 |
| pIFs thickness | −0.471 | −0.115 | 0.908 | 0.155 | 7.01 | 0.463 | 0.644 | 0.0934 | 3.09 | 0.632 | 0.528 | 0.168 | −4.49 | −1.13 | 0.26 | 0.0872 |
To compare associations with age, brain estimates from older ages were compared to those from the youngest age range (i.e., 36–39 years) as the percent difference across age. Individual estimates were pooled into 5‐year age bins, and the mean of each age bin was used to calculate the normalized percent difference of that group compared to the youngest group. For interpretability, the Percent Annualized Rate (PAR)—calculated as the percent difference per year—has been provided in Table 3. Age associations were compared between regions using an analysis of variance (ANOVA) test. All regions were included in the same model, and Tukey's method was used for correcting for multiple comparisons. Age associations were investigated across the full adult lifespan and separately for early (35–69 years) and late adulthood (60–90 years). As mentioned above, 60 years of age was chosen as the pivotal point for early and late age‐split analyses, as recent work has demonstrated maximal change may occur at this time (Mahlknecht and Kaiser 2010; Shen et al. 2024). Comparisons of regional brain‐age associations between early and late adulthood were performed using ANOVA tests for each region. Correlations with p < 0.00298 survived correction for multiple comparisons (=0.05/18) using standard post hoc Bonferroni correction for 18 brain estimates.
TABLE 3.
Estimated percent annualized rate (PAR) of decline in hippocampal volume, and cortical thinning of speech motor control regions across the lifespan (36–90 years), or estimated across early (36–69 years) and late (60–90 years) adulthood.
| Lifespan (%/year) | Early Adulthood (%/year) | Late Adulthood (%/year) | |
|---|---|---|---|
| Hippocampal volume ●● | −0.388 | −0.191 | −0.714 |
| eTIV | 0.0552 †† , **, ## | 0.00359 †† , **, ## | 0.0443 †† , **, ## |
| Total gray volume ●● | −0.367 | −0.316 † | −0.439 |
| Mean thickness ●●● | −0.294 | −0.248 | −0.361 † |
| vPMC thickness | −0.170 †† , **, ## | −0.196 | −0.154 †† |
| midPMC thickness | −0.183 †† , **, # | −0.166* | −0.227 †† |
| mdPMC thickness ●● | −0.171 †† , **, ## | −0.187 | −0.167 †† , * |
| pdPMC thickness ● | −0.213 †† , ** | −0.228 | −0.193 †† , * |
| vMC thickness | −0.200 †† , ** | −0.185 | −0.231 †† |
| midMC thickness ● | −0.178 †† , **, # | −0.126** | −0.261 †† |
| dMC thickness ●● | −0.218 †† , ** | −0.173* | −0.289 †† |
| preSMA thickness | −0.150 †† , **, ## | −0.168 | −0.140 †† , ** |
| SMA thickness | −0.141 †† , **, ## | −0.142** | −0.139 †† , **, # |
| aINS thickness ●● | −0.0498 †† , **, ## | −0.0946**, # | 0.00438 †† , **, ## |
| pINS thickness ● | −0.0501 †† , **, ## | −0.12** | 0.00972 †† , **, ## |
| dIFo thickness | −0.149 †† , **, ## | −0.122** | −0.186 †† , * |
| vIFo thickness | −0.155 †† , **, ## | −0.133** | −0.194 †† , * |
| pIFs thickness | −0.117 †† , **, ## | −0.121** | −0.177 †† , ** # |
Note: P values were calculated using ANOVA with tukey p‐value adjustment.
p < 0.01.
p < 0.0001—Age association differs significantly from hippocampal volume.
p < 0.01.
p < 0.0001—Age association differs significantly from gray matter volume.
p < 0.01.
p < 0.0001—Age association differs significantly from mean cortical thickness.
p < 0.05.
p < 0.0029.
p < 0.0001—Age association differs significantly from early to late adulthood.
Finally, estimated Total Intracranial Volume (eTIV) is commonly used to correct for head size in volume‐based structural estimates, given that it is stable within an individual post development (Buckner et al. 2004). It is worth noting that eTIV was correlated with age in the HCP dataset (PAR = 0.180%; p < 0.005). Raw eTIV values were adjusted using Freesurfer's atlas transform error score (see Appendix A.1 for further details). This adjustment removed the correlation with age (PAR: 0.0551%; p > 0.05). Hippocampal volume, total gray matter, and any other volume‐based estimates have been adjusted for differences in head size using this corrected measure of eTIV.
3. Results
3.1. Better Performance Across Cognitive Tasks Was Most Correlated with Greater Total Gray Matter Volume
Performance measured using the Trail Making Task (TMT) A/B, Rey Auditory Verbal Learning Test (RAVLT), and a Cognitive Composite Score was compared with estimates of hippocampal volume, total gray matter volume, and premotor, motor, somatomotor, insular, and inferior frontal speech motor regional thickness (see Figure 2). Greater hippocampal volume correlated with better performance on all cognitive tasks (R2 range from 0.058 to 0.096). Greater regional premotor thickness showed the next strongest correlations with cognitive performance (R 2 range from 0.029 to 0.066). All regression models used to investigate brain‐cognition associations were highly significant, with age contributing significantly to most models. Table 2 includes the cognitive correlation coefficient (b), T and p values, and model coefficient of determination (R 2 ) for all models. Hippocampal volume remained correlated with performance on all cognitive tasks (p range 0.02–0.001) even after removing the contributions of age and T1w image quality. eTIV was correlated with cognitive performance on TMTB, RAVLT, and cognitive composite score (p < 0.005). Total gray matter volume was associated with cognitive performance on TMTA/B and composite score (p < 1.0e‐4). Select speech motor regions, including preSMA (p = 0.0165), dIFo (p = 0.00393) and aINS (p = 0.0382) thickness were correlated with performance on the RAVLT, and insular thickness was correlated with cognitive composite score (aINS p = 0.0359; pINS p = 0.0121). However, only associations between total gray matter volume and cognitive performance survived correction for multiple comparisons (p < 0.00083).
FIGURE 2.
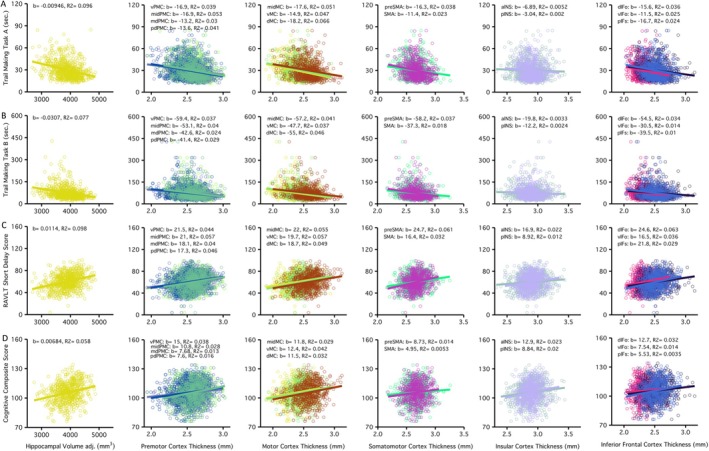
Better performance across cognitive tasks was associated with larger hippocampal volume and greater thickness in speech motor control regions. Cognitive performance across tasks is organized by row, in order: (A) Trail Making Task A, (B) Trail Making Task B, (C) Rey Auditory Verbal Learning Task (RAVLT) and (D) Cognitive Composite Score. Structural brain estimates include hippocampal volume and cortical thickness of premotor, motor, somato‐motor, insular, and inferior frontal cortices. Each plot displays the cognitive score on the y‐axis, while hippocampal volume or cortical thickness of speech motor control regions is found on the x‐axis; the beta and R‐squared are provided for each brain‐cognitive association.
3.2. All Structural Brain Estimates Decline Across the Adult Lifespan
Hippocampal volume and thickness of speech motor regions are displayed across the adult lifespan in Figure 3. As expected, our reference estimate (eTIV) showed little to no change across the lifespan (Percent Annualized Rate = 0.055%; see Table 3 for all structural estimate PARs). Total gray matter volume (GMV: Early: −0.316%; Late: −0.439%) and mean cortical thickness (mCT: Early: −0.246%; Late: −0.361%) showed significantly greater age associations in late, compared to early adulthood. GMV and mCT age associations were not significantly different from each other. As expected, hippocampal volume showed a weaker age association early in adulthood (−0.191%) and a stronger association in late adulthood (−0.714%). This difference was statistically significant (T = 6.179, p = 0.0002). Notably, age associations were not significantly different between hippocampal volume and GMV or mCT when estimated across the full adult lifespan (see Figure 3c). Age associations with speech motor control regions were generally weaker than the associations seen in GMV, mCT, or hippocampal volume (Pcor < 0.0001, see Table 3 for further details). The strongest age associations were seen with ventral motor (vMC: −0.200%), posterior dorsal premotor (pdPMC: −0.213%) and dorsal motor (dMC: −0.219%) regions, while the weakest associations were found with anterior (aINS −0.0498%) and posterior insular (pINS −0.0501%) regions (see Figure 3d).
FIGURE 3.
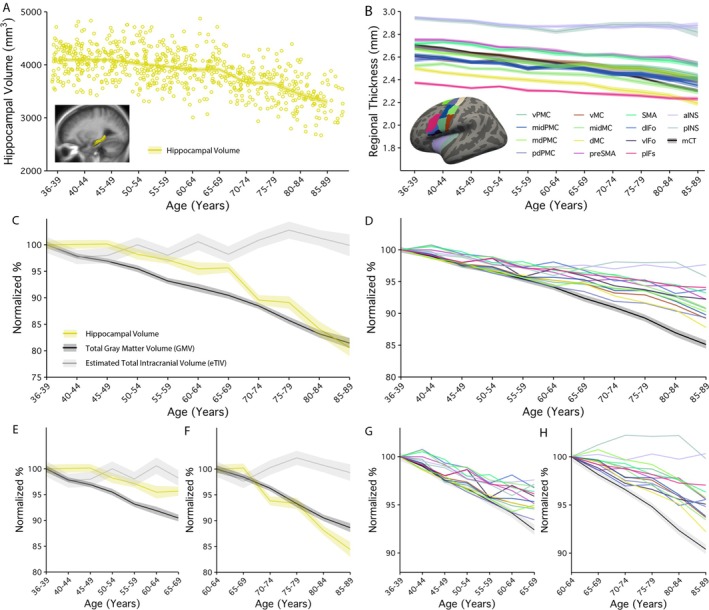
Age associations with speech motor control regional thickness was significantly different than associations seen with hippocampal volume during adulthood. (A) Individual estimates of hippocampal volume are plotted against age. The line represents the mean and standard error of estimates grouped into 5‐year age bins. (B) Age associations in 14 speech motor control regions as well as mean cortical thickness are displayed across the adult lifespan. Each line connects the mean and standard error of region is grouped into 5‐year age bins. (C) Normalized age‐curves for hippocampal volume are plotted alongside total gray matter volume (GMV) and estimated total intracranial volume (eTIV) across the full adult lifespan. (D) Similarly, normalized age‐curves for speech‐motor regions were plotted alongside mean cortical thickness across the adult lifespan. Finally, age associations were further displayed as (E) early and (F) late adulthood for hippocampal volume. and for (G) early and (H) late adulthood for speech motor control regions.
Finally, age associations were investigated in early and late adulthood (see Figure 3e–h). Across early adulthood, hippocampal volume (−0.181%) showed a significantly weaker age association than GMV (−0.316%) (T = −4.355, p = 0.0043). The next strongest age associations were also found with mCT (−0.248%), vMC (−0.198%), vPMC (−0.215%), mdPMC (−0.224%), and pdPMC (−0.239%); however, these associations did not differ significantly from those with hippocampal volume. By comparison, across late adulthood, hippocampal volume (−0.714%) showed a significantly stronger association with age than any of the speech motor control regions. The next strongest age associations were seen in the midPMC (−0.257%), vMC (−0.260%), midMC (−0.309%) and dMC (−0.321%), while the weakest associations continued to be found with aINS (0.00438%) and pINS (0.00972%). Notably, age associations were not significantly different between hippocampal volume and GMV in late adulthood.
From early and late adulthood, PAR values were reduced for exactly half of the speech motor control regions explored (see Table 3). Regions showing stronger age associations in late, compared to early adulthood, included the dMC (Early: −0.173%; Late: −0.298%) and midMC (Early: −0.126%; Late: −0.261%). However, associations found in midMC did not meet thresholds for multiple comparisons. Regions showing stronger age associations in early, compared to late adulthood, included the mdPMC (Early: −0.187%; Late: −0.167%), pdPMC (Early: −0.228%; Late: −0.193%), aINS (Early: −0.0946%; Late: 0.00438%), and pINS (Early: −0.12%; Late: 0.00972%). However, the associations found in pINS and pdPMC did not meet thresholds for multiple comparisons.
4. Discussion
An increasing body of research has highlighted that speech impairments are often among the earliest indicators of neurodegenerative diseases such as amyotrophic lateral sclerosis, multiple sclerosis, Parkinson's disease, and AD. More specifically, impaired speech fluency, speech tempo, increased pauses, lower speech and articulation rate, as well as altered voice quality, fundamental frequency, spectrum features, and formants have been reported in individuals with MCI and AD (Lopez‐de‐Ipiña et al. 2015; Martínez‐Nicolás et al. 2021; Mueller et al. 2018; Tóth et al. 2018). By understanding the effects of normal aging on brain structure and speech function, researchers can better disentangle the impacts of underlying neuropathological impairment from the natural aging process. This study is the first to examine cognitive‐ and age‐associations of cortical thickness in brain regions implicated in speech motor performance across the adult lifespan. Our findings first demonstrated that speech motor control regional thickness was not correlated with cognitive performance. Secondly, thinning of specific speech motor regions likely precedes reduction in hippocampal volume seen in late adulthood and could serve as a target and early indicator of AD‐related neurodegeneration.
4.1. Thickness of Speech Motor Control Regions Was Not Correlated with Cognitive Performance, and May Serve as a More Intrinsic Measure of Aging
Unlike Gray Matter Volume, greater total gray matter volume was correlated with better performance across multiple behavioral tasks. This relationship is highly robust and has been demonstrated previously (Aljondi et al. 2019; Posthuma et al. 2002; Royle et al. 2013; Zhao et al. 2019). Other previous studies have shown a relationship between regional cortical thickness and cognition, including temporal and limbic lobes (Choi et al. 2019; Hanford et al. 2019); however, these regions were not explored in the current study. Generally, thickness of speech motor control regions was not correlated with cognition, allowing it to be independent of the confounding effects of cognition (also known to be impacted by age). Future work can take advantage of this disassociation to better understand the effects of aging.
The TMTA primarily assesses processing speed and motor control, while the RAVLT is a measure of verbal memory and learning, which also involves significant motor planning and execution, particularly in verbal retrieval (Reitan 1985; Schmidt 1996). We therefore hypothesized that cortical regions traditionally associated with motor functions would be more strongly correlated with the TMTA and RAVLT, while cortical regions traditionally associated with high‐order cognitive function (i.e., prefrontal cortex and hippocampus) would be more strongly correlated with the cognitive compositive score (thought to capture general cognition). Cognitive associations outside of total gray matter volume did not survive correction for multiple comparisons and should therefore be interpreted with caution. Hippocampal volume was associated with cognitive performance, even after removing the contributions of image quality or age. Hippocampal volume has previously been linked to greater behavioral performance on cognitive tests (Gorbach et al. 2017; Hardcastle et al. 2020; Hu and Li 2020; O'Shea et al. 2016; Papp et al. 2014; Uribe et al. 2018). Additionally, performance on the RAVLT was correlated with preSMA, dIFo, and aINS thickness after controlling for age and image quality. Associations with preSMA could reflect the involvement of speech motor regions in facilitating the complex motor and verbal demands of these tasks, which require not only the retrieval and articulation of verbal information but also the coordination of motor actions in a timed environment (Salthouse 2011). Finally, associations between the insula and cognitive performance could have been predicted by previous studies that have linked a broader range of cognitive domains, including executive function, memory, and attention to the activity of the insula (Craig 2009; Dronkers 1996).
4.2. Decline of Speech Motor Control Regions May Serve as a Target and Early Indicator of AD‐Related Neurodegeneration
Our results that hippocampal volume is preserved during early adulthood and may decline more rapidly later in adulthood is supported by previous cross‐sectional studies investigating age associations across the adult lifespan (Narvacan et al. 2017; Nobis et al. 2019; Sele et al. 2020). By relying solely on hippocampal atrophy as an early biomarker for neurodegenerative diseases, we may lose out on changes occurring in other brain regions, such as those involved in speech motor control. Several motor and all premotor cortical regions examined showed comparable, if not a stronger, rate of change than that seen in the hippocampus in early adulthood. Regions showing a larger decline may provide an easier target for detecting or monitoring change given the larger estimated effect size.
Motor and premotor cortical regions, including areas involved in speech production, show early maturation in development (Fjell et al. 2015; Lebel et al. 2008), and show early structural changes in neurodegenerative diseases (Landin‐Romero et al. 2021). These regions, which are critical for coordinating complex motor actions, including speech, appear to undergo cortical thinning before more cognitive‐linked regions like the hippocampus (Sele et al. 2020; Wang et al. 2019). In fact, studies have demonstrated that changes in speech motor control regions are among the first detectable signs of neurodegeneration in diseases like Parkinson's disease and early‐stage AD (Ash et al. 2010; Pathak et al. 2021; Rusz et al. 2021). Research from Garcia and colleagues highlights the early detection potential of speech motor control changes as markers in diagnosing neurodegenerative disorders, including Alzheimer's and Parkinson's diseases (García et al. 2023).
4.3. Study Limitations and Future Directions
Our study is not without its limitations, and we outline areas for improvement that could be addressed in future research. First, we identified an unexpected association between eTIV—a measure generally considered stable across the lifespan—and age (Buckner et al. 2004). To mitigate this issue, we applied an adjustment using the atlas transform error term, which effectively removed the age‐related correlations. To ensure transparency and reproducibility, we have included an Appendix A detailing the methods used to adjust eTIV. However, we acknowledge this adjustment does not fully resolve the challenge posed by variability in how different brains register to the standard atlas space. Second, we acknowledge the inherent limitations in making inferences about aging from cross‐sectional populations. Cross‐sectional designs, while useful, cannot capture the dynamic changes that occur within individuals over time. Third, although behavioral assessments and cognitive testing batteries remain the clinical gold standard for evaluating cognitive abilities and these assessments have limitations. Behavioral assessments are often subject to biases such as subjectivity and practice effects, which can compromise their reliability over repeated administrations. They can also be influenced by factors such as education and socioeconomic status, which can confound the results and obscure true cognitive decline. A promising alternative approach has been to assess speech motor performance, which yield detailed measures about acoustic and kinematic aspects of speech. These measures offer more objective and quantifiable assessments of behavior, providing higher precision and reducing the influence of cognitive confounders. As a future direction, we plan to incorporate speech motor behaviors alongside traditional cognitive measures to enhance the accuracy and objectivity of our assessments. Unfortunately, these data were not available in the HCP‐Aging dataset, limiting our ability to explore these relationships in the current study. Nonetheless, we believe that integrating speech motor control measures in future research could significantly advance our understanding of cognitive aging and neurodegenerative processes. Additionally, the structural integrity of cortical white matter is also crucial for speech function (Hertrich et al. 2016). While estimates of regional white matter were not explored in this manuscript, they could provide a possible target for future studies.
4.4. Conclusions and Clinical Implications
In summary, these findings collectively support the notion that speech motor regions are integral to both speech production and cognitive performance. This nuanced understanding is critical for refining early diagnostic criteria for neurodegenerative diseases, including AD, and sheds light on the complex interplay between age‐related changes, disease pathology, and cognitive decline. The strong correlations between the decline in speech motor control regions and performance on motoric cognitive tasks highlight their dual role in both speech and cognitive processes, suggesting that treatment or therapies aimed at preserving or enhancing function in these regions could have significant benefits. Cognitive‐motor training programs, which engage both cognitive and motor functions simultaneously, could be particularly effective in delaying the onset of symptoms in individuals with early‐stage AD. Utilizing these regions as surrogate markers in clinical trials could enhance the assessment of treatment efficacy. Their larger effect sizes might enable the detection of meaningful changes over shorter periods, potentially accelerating the development and approval of new therapies, ultimately leading to better outcomes for patients with neurodegenerative diseases.
Finally, the observation that speech motor control regions exhibit earlier decline than hippocampal regions carries important clinical implications for the early detection of neurodegenerative diseases like AD. These regions could serve as critical biomarkers for identifying individuals at risk, even before significant cognitive symptoms emerge. Integrating neuroimaging techniques that focus on cortical thickness in these regions into routine diagnostic protocols could allow healthcare providers to detect subtle changes in patients who may be in the very early stages of the disease. This early identification would enable the timely implementation of therapeutic strategies designed to slow disease progression, thereby improving patient outcomes and potentially altering the course of the disease.
Conflicts of Interest
The authors declare no conflicts of interest.
Acknowledgments
Research reported in this publication was supported by the MGH. Institute of Health Professions, funds provided by the American Speech‐Language‐Hearing Foundation and the NIH‐NIDCD grant K23DC019179 (PI: Marziye Eshghi). Data for this study were obtained with support from the National Institute on Aging (U01AG052564). We would like to extend our thanks to Dr. Barnaly Rashid for their valuable feedback on earlier drafts of the manuscript.
Appendix A.
Adjusted Estimated Total Intracranial Volume (eTIV)
Volume‐based structural estimates are confounded by head size and are typically corrected for using estimated Total Intracranial Volume (eTIV). While eTIV should remain consistent across the lifespan (Buckner et al. 2004), it was noted to have a negative association with age in the HCP‐Aging dataset. This age association was diminished (for female participants) and removed (for male participants) after adjusting eTIV by FreeSurfer's atlas transform error score (atlas_txfm_error) using the following equation:
where eTIVadj is the adjusted measure, eTIVraw is the automated measure provided by FreeSurfer's recon‐all pipeline, b is the slope of the atlas transform error with age, atlas_txfm_errorraw is the individual measure and atlas_txfm_errormean is the average atlas transform error across the HCP‐Aging sample.
All reference to eTIV in the manuscript is to this adjusted measure of eTIV. Adjusted eTIV was used to correct for head size in volume‐based estimates (including hippocampal volume and total gray matter volume).

Hanford, L. C. , Jacoby J., Salat D. H., Arnold S. E., and Eshghi M.. 2025. “Age‐Associated Cortical Thinning in Speech Motor Regions Precedes Hippocampal Decline: Implications for Alzheimer's Disease.” Human Brain Mapping 46, no. 11: e70288. 10.1002/hbm.70288.
Funding: This work was supported by the MGH Institute of Health Professions, National Institute of Health: National Institute on Aging (U01AG052564), National Institute on Deafness and Other Communication Disorders (K23DC019179), and American Speech‐Language‐Hearing Foundation.
Data Availability Statement
The data that support the findings of this study are openly available in Human Connectome Project‐Aging (HCP‐A) Release 2.0 #1062 at https://nda.nih.gov/study.html?id=1062.
References
- Ackermann, H. , and Riecker A.. 2004. “The Contribution of the Insula to Motor Aspects of Speech Production: A Review and a Hypothesis.” Brain and Language 89, no. 2: 320–328. [DOI] [PubMed] [Google Scholar]
- Ackermann, H. , and Riecker A.. 2010. “The Contribution (s) of the Insula to Speech Production: A Review of the Clinical and Functional Imaging Literature.” Brain Structure and Function 214: 419–433. [DOI] [PubMed] [Google Scholar]
- Akshoomoff, N. , Beaumont J. L., Bauer P. J., et al. 2013. “VIII. NIH Toolbox Cognition Battery (CB): Composite Scores of Crystallized, Fluid, and Overall Cognition.” Monographs of the Society for Research in Child Development 78, no. 4: 119–132. [DOI] [PMC free article] [PubMed] [Google Scholar]
- Aljondi, R. , Szoeke C., Steward C., Yates P., and Desmond P.. 2019. “A Decade of Changes in Brain Volume and Cognition.” Brain Imaging and Behavior 13: 554–563. [DOI] [PubMed] [Google Scholar]
- Allen, M. D. , Owens T. E., Fong A. K., and Richards D. R.. 2011. “A Functional Neuroimaging Analysis of the Trail Making Test‐B: Implications for Clinical Application.” Behavioural Neurology 24, no. 2: 159–171. [DOI] [PMC free article] [PubMed] [Google Scholar]
- Amerman, J. D. , and Parnell M. M.. 1992. “Speech Timing Strategies in Elderly Adults.” Journal of Phonetics 20, no. 1: 65–76. [Google Scholar]
- Arbuthnott, K. , and Frank J.. 2000. “Trail Making Test, Part B as a Measure of Executive Control: Validation Using a Set‐Switching Paradigm.” Journal of Clinical and Experimental Neuropsychology 22, no. 4: 518–528. [DOI] [PubMed] [Google Scholar]
- Aschenbrenner, A. J. , Gordon B. A., Benzinger T. L., Morris J. C., and Hassenstab J. J.. 2018. “Influence of Tau PET, Amyloid PET, and Hippocampal Volume on Cognition in Alzheimer Disease.” Neurology 91, no. 9: e859–e866. [DOI] [PMC free article] [PubMed] [Google Scholar]
- Ash, S. , McMillan C., Gunawardena D., et al. 2010. “Speech Errors in Progressive Non‐Fluent Aphasia.” Brain and Language 113, no. 1: 13–20. [DOI] [PMC free article] [PubMed] [Google Scholar]
- Bailey, D. J. , and Dromey C.. 2015. “Bidirectional Interference Between Speech and Nonspeech Tasks in Younger, Middle‐Aged, and Older Adults.” Journal of Speech, Language, and Hearing Research 58, no. 6: 1637–1653. [DOI] [PubMed] [Google Scholar]
- Baudic, S. , Dalla Barba G., Thibaudet M. C., Smagghe A., Remy P., and Traykov L.. 2006. “Executive Function Deficits in Early Alzheimer's Disease and Their Relations With Episodic Memory.” Archives of Clinical Neuropsychology 21, no. 1: 15–21. [DOI] [PubMed] [Google Scholar]
- Behroozmand, R. , Johari K., Bridwell K., Hayden C., Fahey D., and Den Ouden D.‐B.. 2020. “Modulation of Vocal Pitch Control Through High‐Definition Transcranial Direct Current Stimulation of the Left Ventral Motor Cortex.” Experimental Brain Research 238, no. 6: 1525–1535. [DOI] [PubMed] [Google Scholar]
- Ben‐David, B. M. , and Icht M.. 2017. “Oral‐Diadochokinetic Rates for Hebrew‐Speaking Healthy Ageing Population: Non‐Word Versus Real‐Word Repetition.” International Journal of Language & Communication Disorders 52, no. 3: 301–310. [DOI] [PubMed] [Google Scholar]
- Bilodeau‐Mercure, M. , Lortie C. L., Sato M., Guitton M. J., and Tremblay P.. 2015. “The Neurobiology of Speech Perception Decline in Aging.” Brain Structure and Function 220: 979–997. [DOI] [PubMed] [Google Scholar]
- Bilodeau‐Mercure, M. , Kirouac V., Langlois N., Ouellet C., Gasse I., and Tremblay P.. 2015. “Movement Sequencing in Normal Aging: Speech, Oro‐Facial, and Finger Movements.” Age 37: 1–13. [DOI] [PMC free article] [PubMed] [Google Scholar]
- Bohland, J. W. , and Guenther F. H.. 2006. “An fMRI Investigation of Syllable Sequence Production.” NeuroImage 32, no. 2: 821–841. [DOI] [PubMed] [Google Scholar]
- Bookheimer, S. Y. , Salat D. H., Terpstra M., et al. 2019. “The Lifespan Human Connectome Project in Aging: An Overview.” NeuroImage 185: 335–348. [DOI] [PMC free article] [PubMed] [Google Scholar]
- Bouchard, K. E. , Mesgarani N., Johnson K., and Chang E. F.. 2013. “Functional Organization of Human Sensorimotor Cortex for Speech Articulation.” Nature 495, no. 7441: 327–332. [DOI] [PMC free article] [PubMed] [Google Scholar]
- Bowie, C. R. , and Harvey P. D.. 2006. “Administration and Interpretation of the Trail Making Test.” Nature Protocols 1, no. 5: 2277–2281. [DOI] [PubMed] [Google Scholar]
- Buchman, A. S. , and Bennett D. A.. 2011. “Loss of Motor Function in Preclinical Alzheimer's Disease.” Expert Review of Neurotherapeutics 11, no. 5: 665–676. [DOI] [PMC free article] [PubMed] [Google Scholar]
- Buckner, R. L. , Head D., Parker J., et al. 2004. “A Unified Approach for Morphometric and Functional Data Analysis in Young, Old, and Demented Adults Using Automated Atlas‐Based Head Size Normalization: Reliability and Validation Against Manual Measurement of Total Intracranial Volume.” NeuroImage 23, no. 2: 724–738. [DOI] [PubMed] [Google Scholar]
- Cai, S. , Tourville J. A., Beal D. S., Perkell J. S., Guenther F. H., and Ghosh S. S.. 2014. “Diffusion Imaging of Cerebral White Matter in Persons Who Stutter: Evidence for Network‐Level Anomalies.” Frontiers in Human Neuroscience 8: 54. [DOI] [PMC free article] [PubMed] [Google Scholar]
- Chincarini, A. , Sensi F., Rei L., et al. 2016. “Integrating Longitudinal Information in Hippocampal Volume Measurements for the Early Detection of Alzheimer's Disease.” NeuroImage 125: 834–847. [DOI] [PubMed] [Google Scholar]
- Choi, M. , Youn H., Kim D., et al. 2019. “Comparison of Neurodegenerative Types Using Different Brain MRI Analysis Metrics in Older Adults With Normal Cognition, Mild Cognitive Impairment, and Alzheimer's Dementia.” PLoS One 14, no. 8: e0220739. [DOI] [PMC free article] [PubMed] [Google Scholar]
- Corrigan, J. D. , and Hinkeldey N. S.. 1987. “Relationships Between Parts A and B of the Trail Making Test.” Journal of Clinical Psychology 43, no. 4: 402–409. [DOI] [PubMed] [Google Scholar]
- Craig, A. D. 2009. “How Do You Feel—Now? The Anterior Insula and Human Awareness.” Nature Reviews Neuroscience 10, no. 1: 59–70. [DOI] [PubMed] [Google Scholar]
- Dale, A. M. , Fischl B., and Sereno M. I.. 1999. “Cortical Surface‐Based Analysis: I. Segmentation and Surface Reconstruction.” NeuroImage 9, no. 2: 179–194. [DOI] [PubMed] [Google Scholar]
- Dias, B. F. , Bicalho M. A. C., Costa M. V., et al. 2021. “Episodic Memory in Normal and Pathological Aging at the RAVLT Test: Comparisons of Immediate and Delayed Recall.” Psychology & Neuroscience 14, no. 4: 388–395. [Google Scholar]
- Dromey, C. , Boyce K., and Channell R.. 2014. “Effects of Age and Syntactic Complexity on Speech Motor Performance.” Journal of Speech, Language, and Hearing Research 57, no. 6: 2142–2151. [DOI] [PubMed] [Google Scholar]
- Dronkers, N. F. 1996. “A New Brain Region for Coordinating Speech Articulation.” Nature 384, no. 6605: 159–161. [DOI] [PubMed] [Google Scholar]
- Duchin, S. W. , and Mysak E. D.. 1987. “Disfluency and Rate Characteristics of Young Adult, Middle‐Aged, and Older Males.” Journal of Communication Disorders 20, no. 3: 245–257. [DOI] [PubMed] [Google Scholar]
- Eshghi, M. , Rong P., Dadgostar M., et al. 2025. “APOE‐ε4 Modulates Facial Neuromuscular Activity in Nondemented Adults: Toward Sensitive Speech‐Based Diagnostics for AD.” MedRxiv: 25326665. [Google Scholar]
- Estévez‐González, A. , Kulisevsky J., Boltes A., Otermín P., and García‐Sánchez C.. 2003. “Rey Verbal Learning Test Is a Useful Tool for Differential Diagnosis in the Preclinical Phase of Alzheimer's Disease: Comparison With Mild Cognitive Impairment and Normal Aging.” International Journal of Geriatric Psychiatry 18, no. 11: 1021–1028. [DOI] [PubMed] [Google Scholar]
- Fard, E. K. , Keelor J. L., Bagheban A. A., and Keith R. W.. 2016. “Comparison of the Rey Auditory Verbal Learning Test (RAVLT) and Digit Test Among Typically Achieving and Gifted Students.” Iranian Journal of Child Neurology 10, no. 2: 26. [PMC free article] [PubMed] [Google Scholar]
- Fernaeus, S. E. , Östberg P., Wahlund L. O., and Hellström Å.. 2014. “Memory Factors in Rey AVLT: Implications for Early Staging of Cognitive Decline.” Scandinavian Journal of Psychology 55, no. 6: 546–553. [DOI] [PubMed] [Google Scholar]
- Fischl, B. , Van Der Kouwe A., Destrieux C., et al. 2004. “Automatically Parcellating the Human Cerebral Cortex.” Cerebral Cortex 14, no. 1: 11–22. [DOI] [PubMed] [Google Scholar]
- Fischl, B. , and Dale A. M.. 2000. “Measuring the Thickness of the Human Cerebral Cortex From Magnetic Resonance Images.” Proceedings of the National Academy of Sciences of The United States of America 97, no. 20: 11050–11055. 10.1073/pnas.200033797. [DOI] [PMC free article] [PubMed] [Google Scholar]
- Fischl, B. , Salat D. H., Busa E., et al. 2002. “Whole Brain Segmentation: Automated Labeling of Neuroanatomical Structures in the Human Brain.” Neuron 33, no. 3: 341–355. [DOI] [PubMed] [Google Scholar]
- Fjell, A. M. , Grydeland H., Krogsrud S. K., et al. 2015. “Development and Aging of Cortical Thickness Correspond to Genetic Organization Patterns.” Proceedings of the National Academy of Sciences of The United States of America 112, no. 50: 15462–15467. [DOI] [PMC free article] [PubMed] [Google Scholar]
- Flanagan, K. P. , and Dembowski J. S.. 2002. “Kinematics of Normal Lingual Diadokokinesis.” Journal of the Acoustical Society of America 111, no. 5_Supplement: 2476. [Google Scholar]
- García, A. M. , de Leon J., Tee B. L., Blasi D. E., and Gorno‐Tempini M. L.. 2023. “Speech and Language Markers of Neurodegeneration: A Call for Global Equity.” Brain 146, no. 12: 4870–4879. 10.1093/brain/awad253. [DOI] [PMC free article] [PubMed] [Google Scholar]
- Gaudino, E. A. , Geisler M. W., and Squires N. K.. 1995. “Construct Validity in the Trail Making Test: What Makes Part B Harder?” Journal of Clinical and Experimental Neuropsychology 17, no. 4: 529–535. [DOI] [PubMed] [Google Scholar]
- Giovagnoli, A. R. , Del Pesce M., Mascheroni S., Simoncelli M., Laiacona M., and Capitani E.. 1996. “Trail Making Test: Normative Values From 287 Normal Adult Controls.” Italian Journal of Neurological Sciences 17: 305–309. [DOI] [PubMed] [Google Scholar]
- Glasser, M. F. , and Van Essen D. C.. 2011. “Mapping Human Cortical Areas In Vivo Based on Myelin Content as Revealed by T1‐and T2‐Weighted MRI.” Journal of Neuroscience 31, no. 32: 11597–11616. [DOI] [PMC free article] [PubMed] [Google Scholar]
- Glasser, M. F. , Smith S. M., Marcus D. S., et al. 2016. “The Human Connectome Project's Neuroimaging Approach.” Nature Neuroscience 19, no. 9: 1175–1187. [DOI] [PMC free article] [PubMed] [Google Scholar]
- Glasser, M. F. , Sotiropoulos S. N., Wilson J. A., et al. 2013. “The Minimal Preprocessing Pipelines for the Human Connectome Project.” NeuroImage 80: 105–124. [DOI] [PMC free article] [PubMed] [Google Scholar]
- Golfinopoulos, E. , Tourville J. A., and Guenther F. H.. 2010. “The Integration of Large‐Scale Neural Network Modeling and Functional Brain Imaging in Speech Motor Control.” NeuroImage 52, no. 3: 862–874. [DOI] [PMC free article] [PubMed] [Google Scholar]
- GoozÉe, J. V. , Stephenson D. K., Murdoch B. E., Darnell R. E., and Lapointe L. L.. 2005. “Lingual Kinematic Strategies Used to Increase Speech Rate: Comparison Between Younger and Older Adults.” Clinical Linguistics & Phonetics 19, no. 4: 319–334. [DOI] [PubMed] [Google Scholar]
- Gorbach, T. , Pudas S., Lundquist A., et al. 2017. “Longitudinal Association Between Hippocampus Atrophy and Episodic‐Memory Decline.” Neurobiology of Aging 51: 167–176. [DOI] [PubMed] [Google Scholar]
- Guenther, F. H. 1994a. “A Neural Network Model of Speech Acquisition and Motor Equivalent Speech Production.” Biological Cybernetics 72, no. 1: 43–53. [DOI] [PubMed] [Google Scholar]
- Guenther, F. H. 1994b. “Skill Acquisition, Coarticulation, and Rate Effects in a Neural Network Model of Speech Production.” Journal of the Acoustical Society of America 95, no. 5_Supplement: 2924. [Google Scholar]
- Guenther, F. H. 1995. “Speech Sound Acquisition, Coarticulation, and Rate Effects in a Neural Network Model of Speech Production.” Psychological Review 102, no. 3: 594–621. [DOI] [PubMed] [Google Scholar]
- Guenther, F. H. 2006. “Cortical Interactions Underlying the Production of Speech Sounds.” Journal of Communication Disorders 39, no. 5: 350–365. [DOI] [PubMed] [Google Scholar]
- Guenther, F. H. , and Vladusich T.. 2012. “A Neural Theory of Speech Acquisition and Production.” Journal of Neurolinguistics 25, no. 5: 408–422. [DOI] [PMC free article] [PubMed] [Google Scholar]
- Guenther, F. H. , Hampson M., and Johnson D.. 1998. “A Theoretical Investigation of Reference Frames for the Planning of Speech Movements.” Psychological Review 105, no. 4: 611–633. [DOI] [PubMed] [Google Scholar]
- Guenther, F. H. , Ghosh S. S., and Tourville J. A.. 2006. “Neural Modeling and Imaging of the Cortical Interactions Underlying Syllable Production.” Brain and Language 96, no. 3: 280–301. [DOI] [PMC free article] [PubMed] [Google Scholar]
- Hanford, L. C. , Pinnock F., Hall G. B., and Heinrichs R. W.. 2019. “Cortical Thickness Correlates of Cognitive Performance in Cognitively‐Matched Individuals With and Without Schizophrenia.” Brain and Cognition 132: 129–137. [DOI] [PubMed] [Google Scholar]
- Hardcastle, C. , O'Shea A., Kraft J. N., et al. 2020. “Contributions of Hippocampal Volume to Cognition in Healthy Older Adults.” Frontiers in Aging Neuroscience 12: 593833. [DOI] [PMC free article] [PubMed] [Google Scholar]
- Harms, M. P. , Somerville L. H., Ances B. M., et al. 2018. “Extending the Human Connectome Project Across Ages: Imaging Protocols for the Lifespan Development and Aging Projects.” NeuroImage 183: 972–984. [DOI] [PMC free article] [PubMed] [Google Scholar]
- Heaton, R. K. , Akshoomoff N., Tulsky D., et al. 2014. “Reliability and Validity of Composite Scores From the NIH Toolbox Cognition Battery in Adults.” Journal of the International Neuropsychological Society 20, no. 6: 588–598. [DOI] [PMC free article] [PubMed] [Google Scholar]
- Hertrich, I. , Dietrich S., and Ackermann H.. 2016. “The Role of the Supplementary Motor Area for Speech and Language Processing.” Neuroscience & Biobehavioral Reviews 68: 602–610. [DOI] [PubMed] [Google Scholar]
- Hook, J. N. , and Gershon R. C.. 2023. “NIH Toolbox for the Assessment of Neurological and Behavioral Function (NIHTB).” In The SAGE Handbook of Clinical Neuropsychology: Clinical Neuropsychological Assessment and Diagnosis, 469–482. SAGE Publications Ltd. [Google Scholar]
- Hoshi, E. , and Tanji J.. 2004. “Differential Roles of Neuronal Activity in the Supplementary and Presupplementary Motor Areas: From Information Retrieval to Motor Planning and Execution.” Journal of Neurophysiology 92, no. 6: 3482–3499. [DOI] [PubMed] [Google Scholar]
- Hu, S. , and Li C.‐s. R.. 2020. “Age‐Related Structural and Functional Changes of the Hippocampus and the Relationship With Inhibitory Control.” Brain Sciences 10, no. 12: 1013. [DOI] [PMC free article] [PubMed] [Google Scholar]
- Jacewicz, E. , Fox R. A., O'Neill C., and Salmons J.. 2009. “Articulation Rate Across Dialect, Age, and Gender.” Language Variation and Change 21, no. 2: 233–256. [DOI] [PMC free article] [PubMed] [Google Scholar]
- Jack, C. R. , Petersen R. C., Xu Y. C., et al. 1999. “Prediction of AD With MRI‐Based Hippocampal Volume in Mild Cognitive Impairment.” Neurology 52, no. 7: 1397. [DOI] [PMC free article] [PubMed] [Google Scholar]
- Janssen, N. , and Mendieta C. C. R.. 2020. “The Dynamics of Speech Motor Control Revealed With Time‐Resolved fMRI.” Cerebral Cortex 30, no. 1: 241–255. [DOI] [PubMed] [Google Scholar]
- Kopp, B. , Rösser N., Tabeling S., et al. 2015. “Errors on the Trail Making Test Are Associated With Right Hemispheric Frontal Lobe Damage in Stroke Patients.” Behavioural Neurology 2015, no. 1: 309235. [DOI] [PMC free article] [PubMed] [Google Scholar]
- Kortte, K. B. , Horner M. D., and Windham W. K.. 2002. “The Trail Making Test, Part B: Cognitive Flexibility or Ability to Maintain Set?” Applied Neuropsychology 9, no. 2: 106–109. [DOI] [PubMed] [Google Scholar]
- Lafleche, G. , and Albert M. S.. 1995. “Executive Function Deficits in Mild Alzheimer's Disease.” Neuropsychology 9, no. 3: 313–320. [Google Scholar]
- Landin‐Romero, R. , Liang C. T., Monroe P. A., et al. 2021. “Brain Changes Underlying Progression of Speech Motor Programming Impairment.” Brain Communications 3, no. 3: fcab205. [DOI] [PMC free article] [PubMed] [Google Scholar]
- Lebel, C. , Walker L., Leemans A., Phillips L., and Beaulieu C.. 2008. “Microstructural Maturation of the Human Brain From Childhood to Adulthood.” NeuroImage 40, no. 3: 1044–1055. [DOI] [PubMed] [Google Scholar]
- Linari, I. , Juantorena G. E., Ibáñez A., Petroni A., and Kamienkowski J. E.. 2022. “Unveiling Trail Making Test: Visual and Manual Trajectories Indexing Multiple Executive Processes.” Scientific Reports 12, no. 1: 14265. [DOI] [PMC free article] [PubMed] [Google Scholar]
- Long, M. A. , Katlowitz K. A., Svirsky M. A., et al. 2016. “Functional Segregation of Cortical Regions Underlying Speech Timing and Articulation.” Neuron 89, no. 6: 1187–1193. [DOI] [PMC free article] [PubMed] [Google Scholar]
- Lopez‐de‐Ipiña, K. , Alonso J. B., Solé‐Casals J., et al. 2015. “On Automatic Diagnosis of Alzheimer's Disease Based on Spontaneous Speech Analysis and Emotional Temperature.” Cognitive Computation 7: 44–55. [Google Scholar]
- MacPherson, M. K. 2019. “Cognitive Load Affects Speech Motor Performance Differently in Older and Younger Adults.” Journal of Speech, Language, and Hearing Research 62, no. 5: 1258–1277. [DOI] [PubMed] [Google Scholar]
- MacPherson, S. E. , Cox S. R., Dickie D. A., et al. 2017. “Processing Speed and the Relationship Between Trail Making Test‐B Performance, Cortical Thinning and White Matter Microstructure in Older Adults.” Cortex 95: 92–103. [DOI] [PMC free article] [PubMed] [Google Scholar]
- Mahlknecht, U. , and Kaiser S.. 2010. “Age‐Related Changes in Peripheral Blood Counts in Humans.” Experimental and Therapeutic Medicine 1, no. 6: 1019–1025. [DOI] [PMC free article] [PubMed] [Google Scholar]
- Marcus, D. S. , Harms M. P., Snyder A. Z., et al. 2013. “Human Connectome Project Informatics: Quality Control, Database Services, and Data Visualization.” NeuroImage 80: 202–219. [DOI] [PMC free article] [PubMed] [Google Scholar]
- Martínez‐Nicolás, I. , Llorente T. E., Martínez‐Sánchez F., and Meilán J. J. G.. 2021. “Ten Years of Research on Automatic Voice and Speech Analysis of People With Alzheimer's Disease and Mild Cognitive Impairment: A Systematic Review Article.” Frontiers in Psychology 12: 620251. [DOI] [PMC free article] [PubMed] [Google Scholar]
- McRae‐McKee, K. , Evans S., Hadjichrysanthou C., Wong M., De Wolf F., and Anderson R.. 2019. “Combining Hippocampal Volume Metrics to Better Understand Alzheimer's Disease Progression in At‐Risk Individuals.” Scientific Reports 9, no. 1: 7499. [DOI] [PMC free article] [PubMed] [Google Scholar]
- Misdraji, E. L. , and Gass C. S.. 2010. “The Trail Making Test and Its Neurobehavioral Components.” Journal of Clinical and Experimental Neuropsychology 32, no. 2: 159–163. [DOI] [PubMed] [Google Scholar]
- Montero‐Odasso, M. , Pieruccini‐Faria F., Bartha R., et al. 2017. “Motor Phenotype in Neurodegenerative Disorders: Gait and Balance Platform Study Design Protocol for the Ontario Neurodegenerative Research Initiative (ONDRI).” Journal of Alzheimer's Disease 59, no. 2: 707–721. [DOI] [PMC free article] [PubMed] [Google Scholar]
- Moradi, E. , Hallikainen I., Hänninen T., and Tohka J.. 2017. “Rey's Auditory Verbal Learning Test Scores Can Be Predicted From Whole Brain MRI in Alzheimer's Disease.” NeuroImage: Clinical 13: 415–427. [DOI] [PMC free article] [PubMed] [Google Scholar]
- Mueller, K. D. , Hermann B., Mecollari J., and Turkstra L. S.. 2018. “Connected Speech and Language in Mild Cognitive Impairment and Alzheimer's Disease: A Review of Picture Description Tasks.” Journal of Clinical and Experimental Neuropsychology 40, no. 9: 917–939. [DOI] [PMC free article] [PubMed] [Google Scholar]
- Mugler III, J. P. , Bao S., Mulkern R. V., et al. 2000. “Optimized Single‐Slab Three‐Dimensional Spin‐Echo MR Imaging of the Brain.” Radiology 216, no. 3: 891– 899. [DOI] [PubMed] [Google Scholar]
- Muir, R. T. , Lam B., Honjo K., et al. 2015. “Trail Making Test Elucidates Neural Substrates of Specific Poststroke Executive Dysfunctions.” Stroke 46, no. 10: 2755–2761. [DOI] [PMC free article] [PubMed] [Google Scholar]
- Murphy, K. , Corfield D., Guz A., et al. 1997. “Cerebral Areas Associated With Motor Control of Speech in Humans.” Journal of Applied Physiology 83, no. 5: 1438–1447. [DOI] [PubMed] [Google Scholar]
- Nagata, T. , Shinagawa S., Ochiai Y., et al. 2011. “Association Between Executive Dysfunction and Hippocampal Volume in Alzheimer's Disease.” International Psychogeriatrics 23, no. 5: 764–771. [DOI] [PubMed] [Google Scholar]
- Nakamichi, N. , Takamoto K., Nishimaru H., et al. 2018. “Cerebral Hemodynamics in Speech‐Related Cortical Areas: Articulation Learning Involves the Inferior Frontal Gyrus, Ventral Sensory‐Motor Cortex, and Parietal‐Temporal Sylvian Area.” Frontiers in Neurology 9: 939. [DOI] [PMC free article] [PubMed] [Google Scholar]
- Narvacan, K. , Treit S., Camicioli R., Martin W., and Beaulieu C.. 2017. “Evolution of Deep Gray Matter Volume Across the Human Lifespan.” Human Brain Mapping 38, no. 8: 3771–3790. [DOI] [PMC free article] [PubMed] [Google Scholar]
- Nobis, L. , Manohar S. G., Smith S. M., et al. 2019. “Hippocampal Volume Across Age: Nomograms Derived From Over 19,700 People in UK Biobank.” NeuroImage: Clinical 23: 101904. [DOI] [PMC free article] [PubMed] [Google Scholar]
- O'Shea, A. , Cohen R. A., Porges E. C., Nissim N. R., and Woods A. J.. 2016. “Cognitive Aging and the Hippocampus in Older Adults.” Frontiers in Aging Neuroscience 8: 298. [DOI] [PMC free article] [PubMed] [Google Scholar]
- Oh, A. , Duerden E. G., and Pang E. W.. 2014. “The Role of the Insula in Speech and Language Processing.” Brain and Language 135: 96–103. [DOI] [PMC free article] [PubMed] [Google Scholar]
- Papp, K. V. , Kaplan R. F., Springate B., et al. 2014. “Processing Speed in Normal Aging: Effects of White Matter Hyperintensities and Hippocampal Volume Loss.” Aging, Neuropsychology, and Cognition 21, no. 2: 197–213. [DOI] [PMC free article] [PubMed] [Google Scholar]
- Pathak, N. , Vimal S. K., Tandon I., Agrawal L., Hongyi C., and Bhattacharyya S.. 2021. “Neurodegenerative Disorders of Alzheimer, Parkinsonism, Amyotrophic Lateral Sclerosis and Multiple Sclerosis: An Early Diagnostic Approach for Precision Treatment.” Metabolic Brain Disease 37: 1–38. [DOI] [PubMed] [Google Scholar]
- Peeva, M. G. , Guenther F. H., Tourville J. A., et al. 2010. “Distinct Representations of Phonemes, Syllables, and Supra‐Syllabic Sequences in the Speech Production Network.” NeuroImage 50, no. 2: 626–638. [DOI] [PMC free article] [PubMed] [Google Scholar]
- Peng, G. P. , Feng Z., He F. P., et al. 2015. “Correlation of Hippocampal Volume and Cognitive Performances in Patients With Either Mild Cognitive Impairment or Alzheimer's Disease.” CNS Neuroscience & Therapeutics 21, no. 1: 15–22. [DOI] [PMC free article] [PubMed] [Google Scholar]
- Periáñez, J. , Ríos‐Lago M., Rodríguez‐Sánchez J., et al. 2007. “Trail Making Test in Traumatic Brain Injury, Schizophrenia, and Normal Ageing: Sample Comparisons and Normative Data.” Archives of Clinical Neuropsychology 22, no. 4: 433–447. [DOI] [PubMed] [Google Scholar]
- Posthuma, D. , De Geus E. J., Baaré W. F., Pol H. E. H., Kahn R. S., and Boomsma D. I.. 2002. “The Association Between Brain Volume and Intelligence Is of Genetic Origin.” Nature Neuroscience 5, no. 2: 83–84. [DOI] [PubMed] [Google Scholar]
- Ramig, L. A. 1983. “Effects of Physiological Aging on Speaking and Reading Rates.” Journal of Communication Disorders 16, no. 3: 217–226. [DOI] [PubMed] [Google Scholar]
- Ranjith, N. , Mathuranath P., Sharma G., and Alexander A.. 2010. “Qualitative Aspects of Learning, Recall, and Recognition in Dementia.” Annals of Indian Academy of Neurology 13, no. 2: 117–122. [DOI] [PMC free article] [PubMed] [Google Scholar]
- Reitan, R. M. 1985. The Halstead‐Reitan Neuropsychological Test Battery: Therapy and Clinical Interpretation. Neuropsychology Press. [Google Scholar]
- Ricci, M. , Graef S., Blundo C., and Miller L. A.. 2012. “Using the Rey Auditory Verbal Learning Test (RAVLT) to Differentiate Alzheimer's Dementia and Behavioural Variant Fronto‐Temporal Dementia.” Clinical Neuropsychologist 26, no. 6: 926–941. [DOI] [PubMed] [Google Scholar]
- Riecker, A. , Mathiak K., Wildgruber D., et al. 2005. “fMRI Reveals Two Distinct Cerebral Networks Subserving Speech Motor Control.” Neurology 64, no. 4: 700–706. [DOI] [PubMed] [Google Scholar]
- Rosen, A. F. , Roalf D. R., Ruparel K., et al. 2018. “Quantitative Assessment of Structural Image Quality.” NeuroImage 169: 407–418. [DOI] [PMC free article] [PubMed] [Google Scholar]
- Royle, N. A. , Booth T., Hernández M. C. V., et al. 2013. “Estimated Maximal and Current Brain Volume Predict Cognitive Ability in Old Age.” Neurobiology of Aging 34, no. 12: 2726–2733. [DOI] [PMC free article] [PubMed] [Google Scholar]
- Rusz, J. , Tykalová T., Novotný M., Růžička E., and Dušek P.. 2021. “Distinct Patterns of Speech Disorder In Early‐Onset and Late‐Onset De‐Novo Parkinson's Disease.” npj Parkinson's Disease 7, no. 1: 98. [DOI] [PMC free article] [PubMed] [Google Scholar]
- Ryan, W. J. , and Burk K. W.. 1974. “Perceptual and Acoustic Correlates of Aging in the Speech of Males.” Journal of Communication Disorders 7, no. 2: 181–192. [DOI] [PubMed] [Google Scholar]
- Salthouse, T. A. 2011. “What Cognitive Abilities Are Involved in Trail‐Making Performance?” Intelligence 39, no. 4: 222–232. [DOI] [PMC free article] [PubMed] [Google Scholar]
- Sánchez‐Cubillo, I. , Periáñez J. A., Adrover‐Roig D., et al. 2009. “Construct Validity of the Trail Making Test: Role of Task‐Switching, Working Memory, Inhibition/Interference Control, and Visuomotor Abilities.” Journal of the International Neuropsychological Society 15, no. 3: 438–450. [DOI] [PubMed] [Google Scholar]
- Schmidt, M. 1996. Rey Auditory Verbal Learning Test. Western Psychological Services. [Google Scholar]
- Schoenberg, M. R. , Dawson K. A., Duff K., Patton D., Scott J. G., and Adams R. L.. 2006. “Test Performance and Classification Statistics for the Rey Auditory Verbal Learning Test in Selected Clinical Samples.” Archives of Clinical Neuropsychology 21, no. 7: 693–703. [DOI] [PubMed] [Google Scholar]
- Sele, S. , Liem F., Mérillat S., and Jäncke L.. 2020. “Decline Variability of Cortical and Subcortical Regions in Aging: A Longitudinal Study.” Frontiers in Human Neuroscience 14: 363. [DOI] [PMC free article] [PubMed] [Google Scholar]
- Shen, X. , Wang C., Zhou X., et al. 2024. “Nonlinear Dynamics of Multi‐Omics Profiles During Human Aging.” Nature Aging 4, no. 11: 1–16. [DOI] [PMC free article] [PubMed] [Google Scholar]
- Smith, B. L. , Wasowicz J., and Preston J.. 1987. “Temporal Characteristics of the Speech of Normal Elderly Adults.” Journal of Speech, Language, and Hearing Research 30, no. 4: 522–529. [DOI] [PubMed] [Google Scholar]
- Tamez, E. , Myerson J., Morris L., White D. A., Baum C., and Connor L. T.. 2011. “Assessing Executive Abilities Following Acute Stroke With the Trail Making Test and Digit Span.” Behavioural Neurology 24, no. 3: 177–185. [DOI] [PMC free article] [PubMed] [Google Scholar]
- Terada, S. , Sato S., Nagao S., et al. 2013. “Trail Making Test B and Brain Perfusion Imaging in Mild Cognitive Impairment and Mild Alzheimer's Disease.” Psychiatry Research: Neuroimaging 213, no. 3: 249–255. [DOI] [PubMed] [Google Scholar]
- Tierney, M. C. , Nores A., Snow W. G., Fisher R. H., Zorzitto M. L., and Reid D. W.. 1994. “Use of the Rey Auditory Verbal Learning Test in Differentiating Normal Aging From Alzheimer's and Parkinson's Dementia.” Psychological Assessment 6, no. 2: 129–134. [Google Scholar]
- Tisdall, M. D. , Reuter M., Qureshi A., Buckner R. L., Fischl B., and van der Kouwe A. J.. 2016. “Prospective Motion Correction With Volumetric Navigators (vNavs) Reduces the Bias and Variance in Brain Morphometry Induced by Subject Motion.” NeuroImage 127: 11–22. [DOI] [PMC free article] [PubMed] [Google Scholar]
- Tóth, L. , Hoffmann I., Gosztolya G., et al. 2018. “A Speech Recognition‐Based Solution for the Automatic Detection of Mild Cognitive Impairment From Spontaneous Speech.” Current Alzheimer Research 15, no. 2: 130–138. [DOI] [PMC free article] [PubMed] [Google Scholar]
- Tourville, J. A. , and Guenther F. H.. 2003. A Cortical and Cerebellar Parcellation System for Speech Studies. Boston University, Center for Adaptive Systems and Department of Cognitive. [Google Scholar]
- Tourville, J. A. , and Guenther F. H.. 2011. “The DIVA Model: A Neural Theory of Speech Acquisition and Production.” Language & Cognitive Processes 26, no. 7: 952–981. [DOI] [PMC free article] [PubMed] [Google Scholar]
- Tsiakiri, A. , Christidi F., Tsiptsios D., et al. 2024. “Processing Speed and Attentional Shift/Mental Flexibility in Patients With Stroke: A Comprehensive Review on the Trail Making Test in Stroke Studies.” Neurology International 16, no. 1: 210–225. [DOI] [PMC free article] [PubMed] [Google Scholar]
- Tulsky, D. S. , Carlozzi N. E., Holdnack J., et al. 2017. “Using the NIH Toolbox Cognition Battery (NIHTB‐CB) in Individuals With Traumatic Brain Injury.” Rehabilitation Psychology 62, no. 4: 413–424. [DOI] [PMC free article] [PubMed] [Google Scholar]
- Uribe, C. , Segura B., Baggio H. C., et al. 2018. “Differential Progression of Regional Hippocampal Atrophy in Aging and Parkinson's Disease.” Frontiers in Aging Neuroscience 10: 325. [DOI] [PMC free article] [PubMed] [Google Scholar]
- Van Der Flier, W. M. , and Scheltens P.. 2009. “Hippocampal Volume Loss and Alzheimer Disease Progression.” Nature Reviews Neurology 5, no. 7: 361–362. [DOI] [PubMed] [Google Scholar]
- van der Kouwe, A. J. , Benner T., Salat D. H., and Fischl B.. 2008. “Brain Morphometry With Multiecho MPRAGE.” NeuroImage 40, no. 2: 559–569. [DOI] [PMC free article] [PubMed] [Google Scholar]
- Wang, Y. , Xu Q., Luo J., Hu M., and Zuo C.. 2019. “Effects of Age and Sex on Subcortical Volumes.” Frontiers in Aging Neuroscience 11: 259. [DOI] [PMC free article] [PubMed] [Google Scholar]
- Watanabe, Y. , Hirano H., Arai H., et al. 2017. “Relationship Between Frailty and Oral Function in Community‐Dwelling Elderly Adults.” Journal of the American Geriatrics Society 65, no. 1: 66–76. [DOI] [PubMed] [Google Scholar]
- Wildgruber, D. , Ackermann H., and Grodd W.. 2001. “Differential Contributions of Motor Cortex, Basal Ganglia, and Cerebellum to Speech Motor Control: Effects of Syllable Repetition Rate Evaluated by fMRI.” NeuroImage 13, no. 1: 101–109. [DOI] [PubMed] [Google Scholar]
- Wohlert, A. B. , and Smith A.. 1998. “Spatiotemporal Stability of Lip Movements in Older Adult Speakers.” Journal of Speech, Language, and Hearing Research 41, no. 1: 41–50. [DOI] [PubMed] [Google Scholar]
- Woolnough, O. , Forseth K. J., Rollo P. S., and Tandon N.. 2019. “Uncovering the Functional Anatomy of the Human Insula During Speech.” eLife 8: e53086. [DOI] [PMC free article] [PubMed] [Google Scholar]
- Zhao, B. , Luo T., Li T., et al. 2019. “Genome‐Wide Association Analysis of 19,629 Individuals Identifies Variants Influencing Regional Brain Volumes and Refines Their Genetic Co‐Architecture With Cognitive and Mental Health Traits.” Nature Genetics 51, no. 11: 1637–1644. [DOI] [PMC free article] [PubMed] [Google Scholar]
Associated Data
This section collects any data citations, data availability statements, or supplementary materials included in this article.
Data Availability Statement
The data that support the findings of this study are openly available in Human Connectome Project‐Aging (HCP‐A) Release 2.0 #1062 at https://nda.nih.gov/study.html?id=1062.